Price movements in the crypto market are not determined solely by spot buying and selling. As perpetual futures and other derivatives trading have developed, market participants can use leverage to increase position size or establish long or short exposure without directly holding the underlying asset. These trading methods improve capital efficiency, but they also make the market more sensitive to price changes. When prices move rapidly in one direction, positions with insufficient margin may be forcibly closed by the platform, resulting in concentrated liquidations.
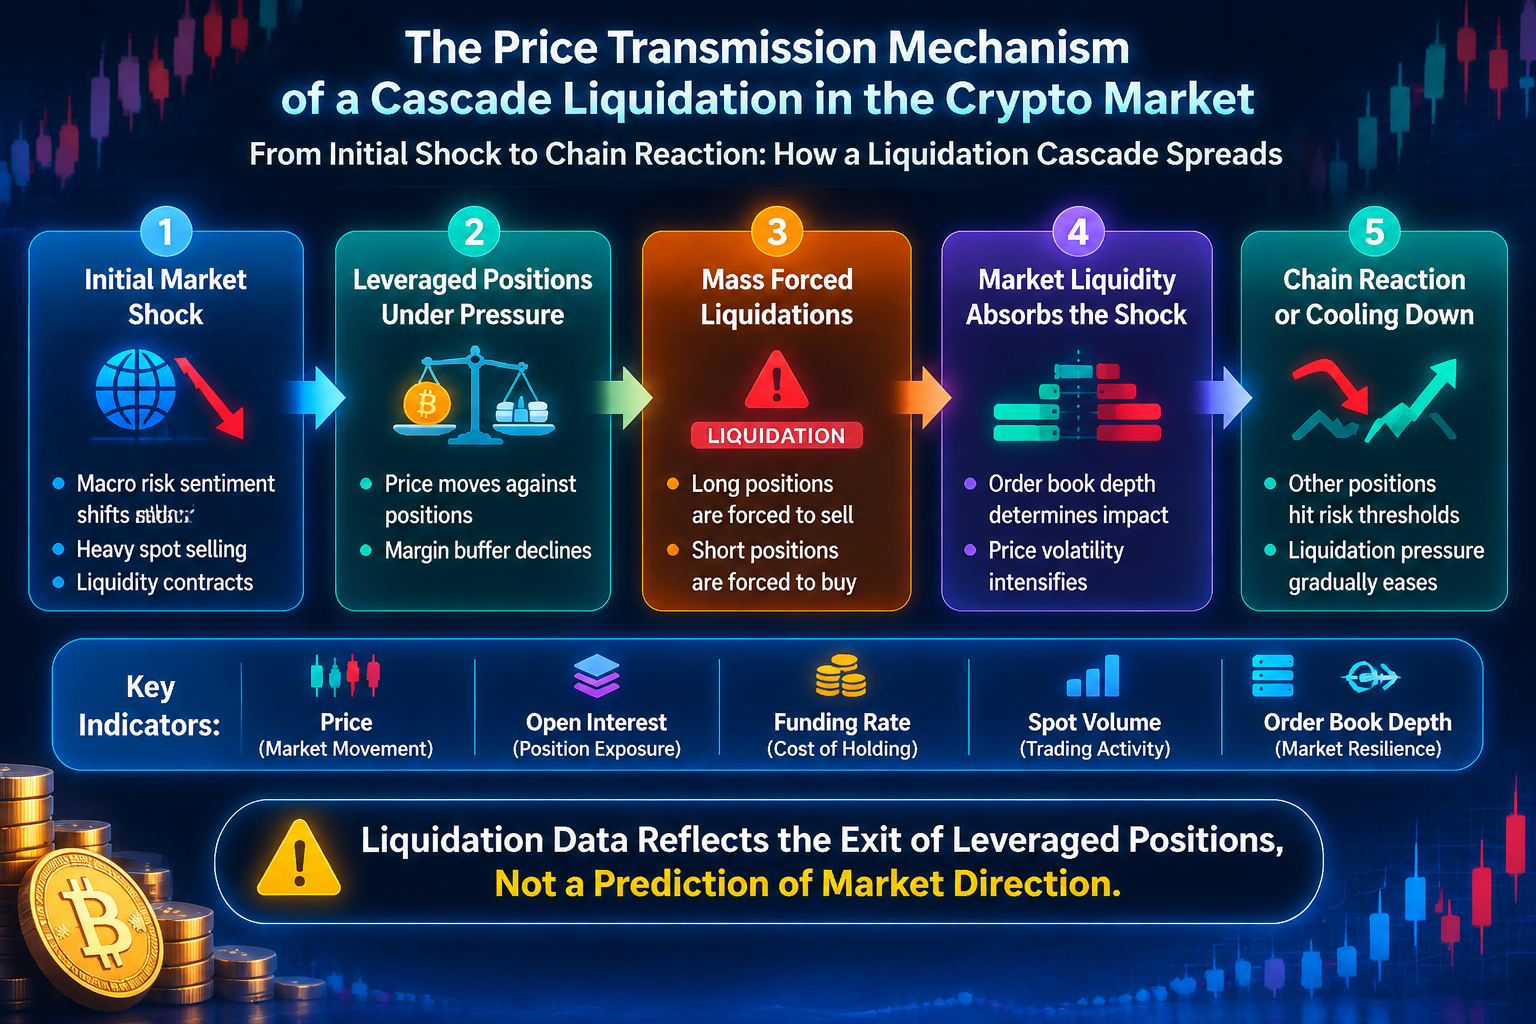
During broad market declines, leveraged long positions often face more direct pressure. If prices continue to fall, some positions may reach liquidation conditions, and system-executed sell orders may further affect market prices. As prices continue to reach the risk thresholds of other positions, new liquidations may occur. This process, in which forced position closures push subsequent positions into risk zones, is commonly known as a liquidation cascade.
However, liquidation data alone cannot explain why a market declines or directly predict the next price direction. The market may first be affected by macro risk appetite, spot selling, or changes in liquidity, with derivatives liquidations subsequently amplifying volatility. To understand liquidations in the crypto market, it is necessary to observe the spot market, derivatives positions, and order book liquidity together rather than focusing only on total liquidations within a specific time window.
Key Takeaways
-
Liquidation cascades typically occur when leveraged positions are concentrated, prices change rapidly, and market liquidity is insufficient. Forced liquidations may further amplify existing price volatility
-
Liquidation amounts, open interest, funding rates, and spot trading volume reflect different market information and should be analyzed together with prices and order book depth
-
Concentrated liquidations can cause sharp short-term price movements, but liquidation data itself is not a reliable standalone buy or sell signal and cannot prove that the market has formed a bottom or reached a top
How Does a Single Liquidation Become a Market Event?
Liquidations in derivatives trading are usually triggered by margin conditions. After traders establish positions using leverage, they need to maintain a certain level of margin. When market prices move in an unfavorable direction, unrealized losses continue to increase, and available margin continues to decline relative to maintenance margin requirements, potentially causing the position to enter the forced liquidation process.
If leveraged positions in the market are relatively dispersed, a single liquidation may not have a significant impact on overall prices. However, the situation may differ if a large number of positions face liquidation within similar price ranges. When prices enter these areas, multiple positions may be taken over by the system in succession, causing forced liquidation orders to enter the market in concentration and affecting the supply-demand balance of buy and sell orders.
Using long positions as an example, falling market prices cause long positions to incur losses. When some long positions reach liquidation conditions, the system needs to sell the relevant contracts or reduce risk through corresponding procedures. If buy orders in the order book are insufficient to absorb this selling demand, execution prices may continue to decline. Lower prices may then bring more long positions closer to their liquidation thresholds, creating a continuous transmission of risk.
Short positions also face risk in the opposite direction. When the market rises rapidly, losses on short positions increase, and forced liquidations may create buying demand that further pushes prices higher. Whether through long or short liquidations, the core mechanism is the forced exit of leveraged positions, rather than market participants actively changing their assessment of an asset's long-term value.
Why Can Concentrated Liquidations Amplify Market Volatility?
The impact of a liquidation cascade depends on whether sufficient counterparties are available to absorb forced liquidation orders when they enter the market. When order book depth is high, large buy or sell orders may be absorbed by liquidity at different price levels, resulting in relatively limited price impact. Conversely, when market participants cancel orders in concentration, bid-ask spreads widen, or trading depth declines, forced liquidation orders are more likely to push prices rapidly through multiple quoted price levels.
This effect varies across assets. Highly liquid assets such as BTC and ETH generally have deeper markets, but their order books can also change rapidly during periods of extreme volatility. Tokens with smaller market capitalizations and lower trading depth may face greater price impact. Forced liquidation orders of the same size may produce entirely different outcomes under different market conditions.
It is also important to note that liquidation orders are not the only initial cause of market declines. Changes in macro risk appetite, spot capital outflows, selling by large holders, project-related news, and shrinking market liquidity can all be starting points for price movements. Derivatives liquidations may add additional buying or selling pressure on this basis, making existing market movements more severe.
Therefore, when analyzing liquidation events, it is necessary to distinguish between triggering factors and amplifying factors. Triggering factors explain why the market began to move, while amplifying factors explain why price changes may accelerate within a short period. Attributing all declines to liquidations may overlook actual changes in the spot market and external environment.
Long Liquidations and Short Squeezes: How Does Liquidation Direction Affect Prices?
Long liquidations typically occur during price declines. Traders who buy using leverage need to maintain margin levels, and as prices continue to fall, account equity may become insufficient to meet maintenance margin requirements. After the system takes over the positions, related sell orders may increase market selling pressure. If multiple long positions are concentrated within similar price ranges, liquidation pressure may occur continuously.
Short liquidations are more common during rapid price increases. After traders establish short positions, continued price increases gradually consume their margin. When short positions reach liquidation conditions, the system may close the risk exposure through buy orders. These forced buy orders may further push prices higher, placing greater pressure on other short positions and creating a short squeeze.
Both situations can cause short-term price acceleration, but their market implications are not entirely the same. A concentration of long liquidations indicates that some leveraged long positions are exiting, while a concentration of short liquidations indicates that some leveraged short positions are exiting. After liquidations occur, the related positions have been closed, but this alone does not indicate that new buying or selling demand will necessarily follow.
Therefore, traders need to distinguish between passive order flow generated by liquidations and active trading demand. Forced liquidations can explain some short-term price movements, but they cannot independently prove that the market has formed a new trend. To assess whether a market move has momentum, it is also necessary to observe spot trading activity, market depth, and subsequent changes in open interest.
How Can You Assess Liquidation Risk Using Price, Open Interest, and Funding Rates?
Open interest (OI) reflects the size of outstanding derivatives contracts in the market and can help show whether leveraged positions are increasing or decreasing. It differs from trading volume: trading volume records trading activity over a given period, while open interest focuses on contracts that remain open. Observing price movements together with open interest can help analyze whether market activity is driven by new positions entering or existing positions exiting.
For example, if prices decline while open interest decreases significantly, it may indicate that some long positions are being closed or liquidated. If prices decline while open interest increases, it may mean that new positions are entering the market, including new short positions or other hedging strategies. Changes in open interest alone cannot determine the direction of all positions, so analysis should include other data.
Funding rates reflect periodic funding payments between long and short participants in perpetual futures. Persistently high positive funding rates may indicate strong long demand or relatively crowded long positions, while persistently low or negative funding rates may reflect relatively strong short demand. However, funding rates are not direct price prediction indicators and cannot independently indicate which direction liquidations will occur.
A more effective approach is to observe price, open interest, funding rates, and spot trading volume within the same time window. If prices decline rapidly, open interest contracts significantly, and substantial long liquidation data appears at the same time, it may indicate that the market is experiencing a concentrated exit of leveraged positions. If prices decline while open interest continues to increase, further analysis is needed to determine whether new positions are increasing directional concentration in the market.
Market data may also differ in methodology. Different platforms may cover different exchanges, contract types, and liquidation data sources, and some liquidation statistics may be estimates or delayed. Therefore, traders should not treat the liquidation amount displayed by a single data platform as a complete representation of the entire market, nor should they treat price areas on liquidation heat maps as price levels that will inevitably be reached.
What Does a Price Rebound After Liquidations Mean?
After large-scale liquidations occur, the market may sometimes rebound rapidly. One possible reason is that the passive order flow generated by concentrated liquidations gradually weakens, easing the sustained selling or buying pressure. When the market no longer needs to absorb forced liquidation orders of the same scale, prices may experience a short-term recovery.
However, a price rebound does not necessarily mean that the market has recovered. If the rebound is mainly driven by short covering and spot buying has not improved significantly, the price may lack the active demand needed for sustained gains. Similarly, a rebound after long liquidations does not mean that prior spot selling pressure has completely disappeared.
Assessing the quality of market conditions after liquidations requires continued observation of spot market trading volume, order book depth, and changes in open interest. If a price rebound is accompanied by improved spot trading activity and gradually recovering market depth, it may indicate that the price recovery has gained broader market support. If open interest rises rapidly and funding rates become extreme again during a rebound, the market may be accumulating leverage risk once more.
In addition, price structure after liquidations may also be affected by external information. Macroeconomic data, policy changes, overall risk asset performance, and large capital flows can all change market participants' expectations. Therefore, the end of liquidations is only a temporary result of one round of forced position closures and does not mean that market volatility has ended.
Liquidation Mechanisms and Market Observations in Gate Futures Markets
Gate's perpetual futures trading provides a practical setting for observing derivatives liquidation mechanisms. Users can view information such as positions, margin, and mark price on the Gate Futures page and manage their own risk according to platform rules. Gate's liquidation mechanism guide explains how the system takes over positions after the maintenance margin ratio reaches the relevant risk threshold, as well as the differences between cross margin and isolated margin modes.
For market analysts, understanding a platform's liquidation rules can also help explain how forced liquidations affect the market. Forced liquidations may involve canceling unfilled orders, reducing position risk in stages, and, in specific circumstances, using an insurance fund or an auto-deleveraging mechanism. Gate's Insurance Fund guide further explains the role of the insurance fund in handling futures-related risks. It is important to note that these mechanisms are primarily used to manage platform-level risk and do not mean that traders can receive compensation for losses.
In actual trading, users should also pay attention to parameters such as mark price, maintenance margin, and risk limits. Gate's perpetual futures trading guide explains concepts related to margin, mark price, and liquidation. Mark price is used to assess futures risk and may not necessarily equal the latest execution price. Traders who observe only the latest execution price while ignoring mark price and margin ratio may underestimate the actual risk faced by their positions.
Gate's futures mechanisms can help users understand the liquidation process for individual accounts, but liquidation cascades across the broader crypto market also involve interactions among different trading platforms, spot markets, and other derivatives markets. When analyzing the market, platform rules should be considered alongside cross-market data rather than treating liquidation records from a single platform as results for the entire market.
Building an Analytical Framework for Monitoring Market Liquidation Risk
Liquidation risk in the crypto market can be assessed across five dimensions. The first is price structure, including market direction, the speed of volatility, and key price areas. The second is derivatives positions, including open interest, leverage usage, and the concentration of long and short positions. The third is funding rates, which can be used to observe long and short demand and holding costs in perpetual futures. The fourth is liquidity, including spot trading volume, order book depth, bid-ask spreads, and slippage. The fifth is liquidation data, including the scale and timing of long and short liquidations, as well as the data coverage of different platforms.
These indicators are related but cannot replace one another. Increasing open interest does not necessarily mean that one-directional risk is rising, because both long and short participants may be increasing their positions. High funding rates do not mean that prices will necessarily reverse, and large liquidation amounts do not mean that the market has completed deleveraging. Only by placing these indicators within the same time window and considering spot market performance can market structure changes be understood more accurately.
During rapid market declines, you can observe whether falling prices are accompanied by declining open interest, rising liquidation data, and decreasing order book depth. If these phenomena occur simultaneously, it may indicate that derivatives position exits are amplifying price volatility. However, if the spot market also experiences sustained selling, price pressure may not come solely from forced liquidations. Conversely, if prices begin to recover while open interest and funding rates rise rapidly again, it is important to monitor whether leverage is becoming concentrated once more.
Ultimately, the value of liquidation data lies in helping traders identify the market's risk structure rather than directly providing a trading direction. Combining liquidation scale, open interest, funding rates, spot trading activity, and market depth can better distinguish active trading demand from passive liquidation pressure and help explain why market volatility may suddenly accelerate at certain stages.
FAQ
What does liquidation mean in the crypto market?
Liquidation generally refers to the process in which a leveraged position is partially or fully forcibly closed by a trading platform because the account or position margin is insufficient to meet maintenance margin requirements. Specific trigger conditions and handling procedures depend on platform rules.
Why can large-scale liquidations further push prices lower?
When long positions are forcibly liquidated in concentration, system-generated sell orders may increase market selling pressure. If order book depth is insufficient, execution prices may continue to decline and push more positions into liquidation ranges.
Does a larger liquidation amount mean the market is closer to a bottom?
No. Liquidation amounts reflect the scale of positions forcibly closed over a certain period, but they cannot independently indicate whether spot demand has recovered, selling pressure has ended, or the market trend has reversed.
Does a decline in open interest always indicate liquidations?
Not necessarily. A decline in open interest may result from voluntary position closures, forced liquidations, or position transfers. It should be assessed together with price, trading volume, and liquidation data.
Can funding rates predict the next round of liquidations?
Funding rates can help observe whether long and short demand in perpetual futures is concentrated, but they are not an independent forecasting tool. The market may continue operating with high funding rates, or price adjustments may occur before funding rates change.
Can liquidation heat maps be used as trading signals?
Liquidation heat maps are generally used to observe potential areas of concentrated liquidations estimated by models and do not mean that prices will inevitably reach these levels. Their data coverage and estimation methods may also differ, so they should be used together with actual market trading and liquidity data.