Looking back over nearly a century of history, U.S. stocks have experienced the Great Depression in 1929, Black Monday in 1987, the bursting of the dot-com bubble in 2000, the global financial crisis in 2008, and the COVID-19 market shock in 2020. Although all of these events involved rapid declines in asset prices, they differed significantly in their causes, the extent of their declines, and their recovery periods. Some markets returned to their previous highs within months, while others underwent prolonged adjustments lasting more than a decade.
Understanding these historical events not only helps investors recognize market cycles, but also helps them analyze the relationships among valuation, liquidity, corporate earnings, and the macroeconomy.
Key Takeaways
- The 1929 stock market crash was one of the most severe long-term crashes in U.S. stock market history. The Dow Jones Industrial Average declined by approximately 89% from its peak to its low.
- During Black Monday in 1987, the Dow fell approximately 22.6% in a single day, prompting the U.S. market to further improve its circuit breaker mechanisms.
- After the dot-com bubble burst in 2000, the Nasdaq Composite fell approximately 78% overall and did not break above its previous closing high again until 2015.
- The 2008 financial crisis affected not only stock valuations, but also bank credit, the real estate market, and liquidity across the financial system.
- Although the 2020 pandemic market crash was rapid, the S&P 500 broke above its previous high again in August of the same year.
- The 2026 technology stock correction reflected a market repricing of AI investment returns and valuations, but it cannot currently be directly equated with a historical financial crisis.
1. What Major Stock Market Crashes Have Occurred in U.S. History?
A stock market crash generally refers to a large-scale, sustained, or systemic decline in stock prices over a relatively short period. Compared with ordinary market volatility, a crash is often accompanied by concentrated selling, declining market liquidity, rapidly contracting valuations, and even disruptions to financial institutions or the real economy.
However, there is no single official definition of a stock market crash. Markets generally refer to a decline of more than 10% from a recent high in a major stock index as a correction, and a decline of more than 20% as a bear market. A single-day plunge, a prolonged bear market, and a financial crisis may occur at the same time, but they are not exactly the same concept.
The following events are among the most historically representative episodes in the U.S. stock market.
| Historical Event |
Representative Index |
Main Decline |
Main Background |
| Great Depression, 1929–1932 |
Dow Jones Index |
Approximately -89% |
Speculative bubble, banking crisis, economic depression |
| Black Monday, 1987 |
Dow Jones Index |
-22.6% in a single day |
Program trading, liquidity shock |
| Dot-Com Bubble, 2000–2002 |
Nasdaq Composite |
Approximately -78% |
Bursting of the technology stock valuation bubble |
| Financial Crisis, 2007–2009 |
S&P 500 |
Approximately -57% |
Subprime mortgage crisis, contraction of the credit system |
| 2020 Pandemic Market Crash |
S&P 500 |
Approximately -34% |
Global pandemic, sudden halt in economic activity |
| 2022 Rate-Hike Bear Market |
S&P 500 |
Approximately -25% |
High inflation, monetary policy tightening |
| November 5, 2026 Correction |
Nasdaq Composite |
-5.52% in a single day |
Changes in expectations for AI investment and regulation |
Note: The table includes both single-day declines and maximum drawdowns over specific periods. They should not be directly compared based on their numerical values. The 2026 data reflects market performance through November 5 and does not represent the full extent of a bear market.
These events show that declines in U.S. stocks may be triggered by economic recessions and financial system risks, or by excessive asset valuations, imbalances in market trading mechanisms, or unexpected public events. Different types of risk often determine how quickly the market subsequently recovers.
2. Why Did the 1929 Stock Market Crash Trigger a Prolonged Market Downturn?
The 1929 U.S. stock market crash was one of the most representative market crises in modern financial history. In the years leading up to it, the U.S. economy grew rapidly, enthusiasm for stock investing continued to rise, and many investors expanded their positions through borrowing and margin trading.
As market valuations continued to increase, stock prices gradually moved away from the actual earnings capacity of some companies. When expectations for economic growth began to weaken and credit conditions changed, highly leveraged investors faced margin calls and forced liquidation, further amplifying the market decline.
On October 28, 1929, the Dow Jones Industrial Average fell approximately 12.8% in a single day, followed by a decline of approximately 11.7% the next day. However, the most severe losses did not end there. The Dow continued to fall until it reached a periodic low in July 1932, representing an overall drawdown of approximately 89% from its 1929 peak.
The stock market crash interacted with subsequent bank failures, credit tightening, corporate bankruptcies, and rising unemployment, pushing the U.S. economy into a prolonged recession. For the stock market, continued deterioration in economic fundamentals meant that corporate earnings were unlikely to recover quickly. Even after stock prices had fallen sharply, they could not necessarily rebound rapidly.
The Dow did not return to its 1929 nominal price high until 1954, nearly 25 years later. Note that this comparison does not account for dividend reinvestment or inflation and cannot be directly equated with the actual returns of all long-term investors.
The key lesson from the 1929 crash is that when a market decline occurs alongside problems in the banking system, credit expansion, and the real economy, the recovery period may be much longer than that of an ordinary valuation adjustment.
3. Why Did Black Monday in 1987 Produce a Single-Day Decline of More Than 20%?
On October 19, 1987, the U.S. stock market experienced a historic decline known as Black Monday. The Dow Jones Industrial Average fell approximately 22.6% that day, making it one of the most severe single-day percentage declines in the index's history.
Unlike in 1929, the 1987 stock market crash did not directly develop into an economic depression of comparable scale. Its occurrence was closely related to market valuations, changes in interest rates, the international financial environment, and the trading mechanisms in use at the time.
Program trading and portfolio insurance were considered important factors that amplified the decline. Some institutions used dynamic trading strategies that increased selling when stock prices fell in order to reduce portfolio risk. When many investors used similar strategies, a market decline could trigger additional selling, creating a cycle between falling prices and concentrated selling.
At the same time, insufficient market liquidity intensified price volatility. When buyers were unable to absorb large numbers of sell orders in a timely manner, stock prices could fall rapidly over a short period.
The 1987 stock market crash prompted the U.S. market to further improve cross-market coordination mechanisms and ultimately establish and develop circuit breaker systems based on declines in major indexes.
This event showed that even when corporate earnings and economic fundamentals have not deteriorated to the same extent, market structure, liquidity, and automated trading strategies can still trigger severe price volatility.
4. Why Did the Nasdaq Take Approximately 15 Years to Recover After the Dot-Com Bubble Burst in 2000?
In the late 1990s, internet technology spread rapidly, and a large number of internet companies entered the capital markets. Investors generally believed that the internet would transform traditional business models and were therefore willing to assign high valuations to technology companies, even when some had not yet established stable revenue or earnings.
In 1999, the Nasdaq Composite rose approximately 86%. On March 10, 2000, the index closed at a record high of 5,048.62. The market then began reassessing the earnings prospects of internet companies, and some businesses that relied on continuous financing to remain operational began facing cash flow pressure.
As technology stock valuations contracted, companies failed, and the initial public offering market cooled, the Nasdaq continued to decline. It reached a low in October 2002, representing an overall decline of approximately 78% from its previous high.
The most notable aspect of the dot-com bubble was not its single-day decline, but its prolonged recovery period. It was not until April 23, 2015, that the Nasdaq Composite closed at 5,056.06 and broke above its 2000 closing high again—approximately 15 years later.
Why was the recovery so slow?
- At the peak of the bubble, technology stock valuations had already priced in highly optimistic growth expectations for many years ahead. When the market again required companies to demonstrate their ability to generate earnings, valuations needed to undergo a prolonged adjustment.
- Although the internet industry continued to develop, not every publicly traded company from the bubble era survived. Long-term industry growth and the recovery of individual stock prices are clearly different matters. Even if internet technology ultimately transforms the global economy, that does not mean every stock purchased at a high valuation will return to its previous price.
- The 2008 financial crisis delivered another major shock to U.S. stocks, extending the time required for the Nasdaq to recover its historical high.
The dot-com bubble showed that a long-term positive view of an industry trend does not necessarily support stock valuations at any price. For technology stock investors, the outlook for technological development, a company's earnings capacity, and its purchase valuation need to be assessed separately.
5. How Did the 2008 Financial Crisis Spread from the Banking System to U.S. Stocks?
The 2008 global financial crisis differed significantly from the bursting of the dot-com bubble. The dot-com bubble primarily involved excessive valuations for technology stocks, while the core problem in the 2008 crisis was the spread of real estate credit risk to banks and the broader financial system.
Before the crisis, the U.S. real estate market had experienced a prolonged period of growth. Financial institutions used instruments such as mortgage-backed securities (MBS) and collateralized debt obligations (CDOs) to transfer and redistribute the risks of large amounts of residential mortgage debt. When housing prices began to fall and default rates on subprime mortgages rose, the value of these financial assets came under pressure.
Because some financial institutions held large amounts of related assets and relied on short-term financing to maintain operations, falling asset prices gradually developed into financing difficulties and credit contraction. In September 2008, Lehman Brothers filed for bankruptcy protection, further intensifying the global financial market's crisis of confidence.
After the financial system came under pressure, banks reduced lending, corporate financing costs increased, and household consumption and business investment were restrained. The stock market had to reassess not only the value of financial institutions' assets, but also the impact of the economic recession on the earnings capacity of other industries.
From its October 2007 high to its March 2009 low, the S&P 500 fell approximately 57% overall. The index did not break above its pre-financial-crisis nominal closing high again until March 2013.
The 2008 crisis showed that when a stock market decline is interconnected with the solvency of financial institutions, the credit system, and an economic recession, market recovery depends not only on improving investor sentiment, but also on repairing the financial system, restoring credit, and returning corporate earnings to growth.
6. Why Did the 2020 Pandemic Market Crash Happen So Quickly, and Why Was the Recovery Relatively Fast?
At the beginning of 2020, COVID-19 spread globally, and multiple countries introduced travel restrictions, business closures, and controls on the movement of people. The market quickly recognized that the pandemic could simultaneously disrupt global supply chains, corporate revenue, and consumer spending.
Unlike the dot-com bubble or the real estate credit crisis, the pandemic initially appeared as an interruption to economic activity caused by a sudden public health event. Investors found it difficult to determine how long work stoppages and production shutdowns would last, prompting them to rapidly reduce their exposure to risk assets.
From February 19 to March 23, 2020, the S&P 500 fell approximately 34% from its high to its low. During this period, U.S. stocks triggered market circuit breakers multiple times, reflecting significant investor concerns about the economic outlook and liquidity.
The semiconductor sector also came under considerable pressure. On March 16, 2020, the PHLX Semiconductor Index fell approximately 15.9% in a single day, showing that even industries with long-term growth prospects cannot completely avoid sudden systemic risks.
However, U.S. stocks recovered significantly faster in 2020 than during some earlier crises. The Federal Reserve quickly introduced interest-rate cuts, asset purchases, and liquidity support measures, while fiscal policy also provided support to businesses and households. At the same time, growing demand for remote work, e-commerce, and cloud computing improved the earnings expectations of some large technology companies. A recovery in the stock market does not mean that the real economy has fully recovered. An index may rise ahead of an improvement in future earnings expectations, while employment, consumption, and business activity may still require more time to recover.
The 2020 pandemic market crash showed that the speed of market recovery depends not only on the severity of the economic shock, but also on the policy response, the structure of corporate earnings, and investors' expectations for the future.
7. How Did the 2022 Rate-Hike Bear Market Differ from a Traditional Financial Crisis?
In 2022, U.S. stocks experienced another significant adjustment. However, its primary drivers were not the concentrated collapse of major banks or a sudden public health event, but persistent high inflation and rapid monetary policy tightening.
As inflationary pressure increased in the United States, the Federal Reserve began a series of interest-rate hikes and gradually tightened the previously accommodative financial environment. Changes in interest rates directly affect corporate financing costs and also change how investors value future cash flows.
This impact was particularly significant for technology stocks. The valuations of some growth companies were based on expectations of rapid revenue and profit growth over many years. When the risk-free interest rate rises, the present value of future cash flows declines, and high-valuation stocks may face greater valuation compression.
From January through October 2022, the S&P 500 fell approximately 25% from its high to its low, while the Nasdaq Composite experienced a more pronounced drawdown. U.S. stocks gradually recovered afterward as inflation expectations, corporate earnings, and market expectations for the interest-rate path changed. The S&P 500 broke above its previous closing high in early 2024.
Compared with 2008, the 2022 bear market more clearly demonstrated the relationship between interest rates and valuations. Even if a company's business has not deteriorated severely, its stock valuation may still decline as long as the market demands a higher rate of return.
This means that analyzing U.S. stocks requires more than observing whether corporate revenue is growing. Investors must also consider the interest-rate environment, earnings quality, and valuation levels to determine whether current prices have already fully reflected future growth expectations.
8. What Similarities and Differences Exist Between the 2026 Technology Stock Correction and the Dot-Com Bubble of 2000?
In 2026, artificial intelligence infrastructure continued to be an important investment focus for the U.S. technology industry. Chip manufacturers, cloud computing companies, data center operators, and related power and equipment suppliers all attracted attention from the market due to expectations for growth in demand for AI computing capacity.
However, as investment continued to expand, the market began paying greater attention to the actual returns from AI infrastructure, including data center construction costs, capital expenditures, the sustainability of customer demand, and corporate cash flow performance.
On November 5, U.S. technology stocks experienced significant selling pressure. The Nasdaq Composite fell 5.52% in a single day, the PHLX Semiconductor Index declined by more than 12%, and Nvidia's stock price fell by more than 9%. Concerns that AI regulation could become more stringent and that the pace of data center expansion could be restricted formed important background factors for this correction.
This was somewhat similar to the dot-com bubble in 2000: Both periods involved new technologies prompting capital markets to reassess companies' long-term growth potential, and investors in both periods needed to determine whether technology investment could translate into sustainable earnings. However, the two periods cannot be equated directly.
During the dot-com bubble in 2000, many publicly traded companies had not yet established mature business models, and some lacked stable revenue altogether. By comparison, in 2026, some large AI infrastructure companies already have mature products, established customer bases, and actual operating cash flow. Their risks are more related to whether high capital expenditures can continue to generate sufficient returns.
There are also significant differences within the AI industry itself. The business models, capital intensity, and customer structures of chip design, cloud computing services, data center construction, and power infrastructure are not the same. They should not be treated as identical investments simply because they are all part of the AI industry chain.
Therefore, the 2026 technology stock correction can serve as an opportunity to reassess valuation and capital expenditure risks. However, a single-day plunge is not sufficient to prove that a new internet bubble has burst, nor can it be used to determine that the market will experience the same recovery period as it did after 2000.
9. How Long Does It Take U.S. Stocks to Recover After a Sharp Decline? What Determines the Speed of Recovery?
Historical experience shows that the time required for U.S. stocks to break above their previous highs again varies widely. After the 2020 pandemic market crash, the S&P 500 recovered in approximately six months. After the 2008 financial crisis, recovery took more than five years. After the dot-com bubble burst, the Nasdaq Composite took approximately 15 years to break above its 2000 closing high again.
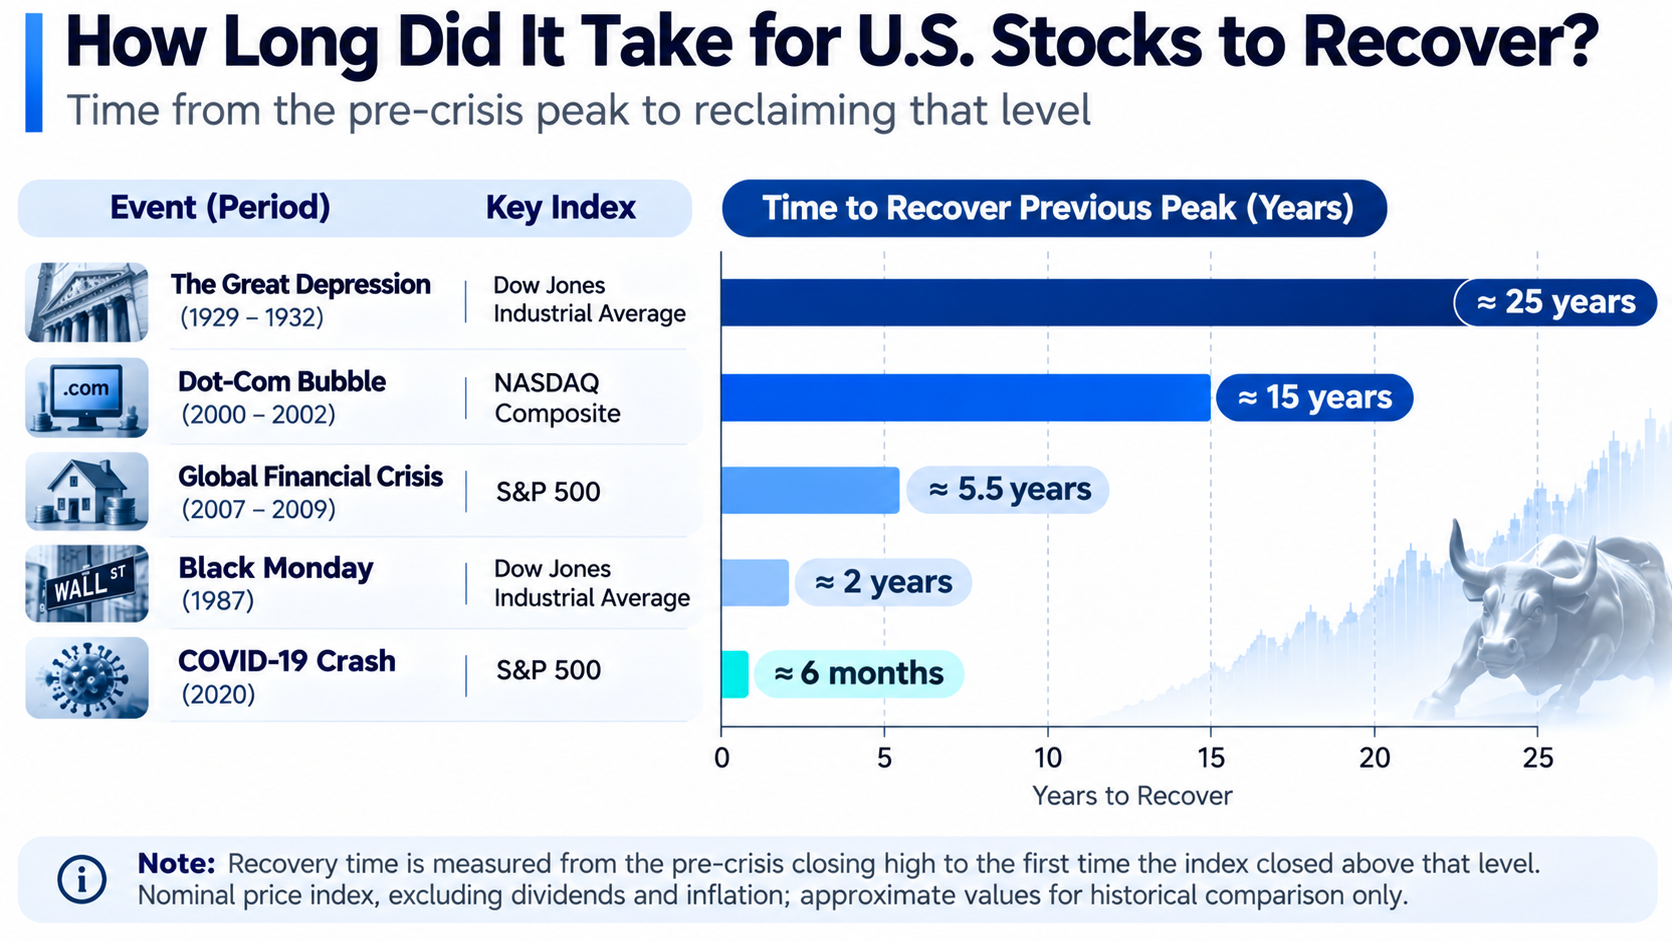
The main factors determining the recovery period include market valuations, corporate earnings, the health of the financial system, monetary policy, and industry structure.
- Valuation determines how much of the market's previous optimism must be absorbed. If stock prices have already reflected many years of rapid future growth during an upswing, the market may need to adjust valuations through a prolonged period of sideways trading or price declines, even if business operations have not immediately deteriorated.
- Corporate earnings determine whether a stock price recovery has fundamental support. Although the stock market can anticipate future expectations, revenue growth, profit margins, and free cash flow remain important factors supporting corporate value over the long term.
- The stability of the financial system affects the speed of economic recovery. When bank credit, corporate financing, and market liquidity are severely disrupted, companies may need more time to resume investment and operations.
- Index constituents also change over time. The Nasdaq of the past was not composed of exactly the same companies as the Nasdaq today. Therefore, an index returning to its previous high does not mean that all stocks from that period have recovered their losses.
For investors, assessing whether the market has recovered should involve more than observing whether major indexes have risen. Investors should also consider corporate fundamentals, valuation levels, and the macro-financial environment.
10. How Should Ordinary Investors Understand Valuation, Liquidity, and Risk During a Market Crash?
Although historical market crashes have had different causes, they all show that market prices can deviate from investors' previous expectations over a short period. For ordinary investors, understanding this risk is more important than trying to accurately predict every market bottom.
It is important to distinguish between business operating risk and market valuation risk. Even if a company continues to grow its revenue, its stock price may decline because of excessive valuation or rising market interest rates. Conversely, a sharp decline in a stock price does not necessarily mean that the company has become an attractive investment, because its earnings capacity and debt situation may be deteriorating at the same time.
Investors should pay attention to market liquidity. Under normal trading conditions, investors can generally complete transactions at prices close to market quotes. During periods of severe volatility, however, bid-ask spreads may widen, and the actual execution prices of some stocks or derivatives may deviate significantly from expectations.
Leverage should be used cautiously. Margin trading and leveraged products can amplify the impact of price movements on a portfolio. When the market experiences consecutive declines, investors may be forced to liquidate positions because of insufficient margin. Even if the relevant assets subsequently rebound, investors may not be able to recover their previous losses.
Diversification can reduce the risk associated with a single company or industry, but it cannot completely eliminate systemic market risk. The 2008 financial crisis and the 2020 pandemic market crash both showed that assets across different industries may decline at the same time when market liquidity is under pressure.
Investors focused on technology stocks and the semiconductor sector should also further analyze companies' capital expenditures, customer concentration, industry cycles, and cash flow. AI, cloud computing, and the chip industry have long-term development potential, but that does not mean related stocks can avoid cyclical adjustments.
Historical experience cannot guarantee that future markets will follow the same path, but it can help investors recognize that there is no simple fixed relationship among the size of a market decline, the quality of a company's operations, and the time required for recovery.
11. How Can You Trade U.S. Stocks on Gate?
As the relationship between digital assets and traditional financial markets continues to deepen, the ways investors participate in the U.S. stock market are also changing. Gate has launched a Stock Trading service that allows eligible users to trade U.S. stocks and ETFs using USDT without opening a separate traditional brokerage account. Unlike stock tokens or price derivatives, Gate's stock spot service connects to the actual stock market through securities trading infrastructure and provides users with stock trading, position management, and transaction record lookup functions.
In practice, users can log in to their Gate accounts and complete the required identity verification, enter the trading page through "TradFi—Stocks" in the App or the stocks section on the Web platform, and transfer USDT from their spot account or Unified Account to their stock account. They can then search for the target company's stock ticker or ETF name. After confirming the trading instrument, quote, order quantity, and applicable fees, users can submit an order using the order types supported on the page. After execution, users can view their positions, cost basis, and profit and loss in their stock accounts.
In addition to stock spot trading, Gate also offers stock CFDs, perpetual contracts, and other U.S. stock-related trading products. These products differ in terms of asset ownership, trading hours, leverage mechanisms, and settlement rules. For example, stock spot trading is primarily used to buy and sell the corresponding securities, while CFDs and perpetual contracts are price derivatives that may involve margin, funding fees, and liquidation risks. Gate's stock services also provide extended trading hours for certain instruments, but liquidity and pricing conditions may differ across time periods. Refer to the actual trading page for details.
For investors who follow historical market crashes and market cycles, the availability of additional trading channels does not eliminate the inherent risks of the stock market. Regardless of the product used to participate in U.S. stock trading, investors should consider corporate fundamentals, market valuations, position sizes, and liquidity, and should be especially careful not to overlook the impact of leverage and trading costs during periods of severe volatility.
Conclusion
From the Great Depression in 1929 to the 2026 technology stock correction, major declines in U.S. stocks have reflected different types of market risk. The crises of 1929 and 2008 were deeply connected to the financial system and the real economy. Black Monday in 1987 highlighted the impact of market trading mechanisms and liquidity, while the dot-com bubble of 2000 showed that long-term industry growth driven by new technologies does not necessarily support excessively high stock valuations.
The 2020 pandemic market crash and the 2022 rate-hike bear market further showed that the speed of market recovery is also affected by policy responses, the interest-rate environment, and corporate earnings expectations. Some markets can rebound quickly, while others may take years to break above their previous highs again.
The technology stock correction in November 2026 once again reminded investors that technological innovation, capital investment, and stock investment returns are not the same thing. For U.S. stock investors, rather than focusing solely on the single-day decline of an index, it is more useful to consider valuation, earnings, cash flow, and market liquidity to understand how different risks affect asset prices and the long-term recovery process.
FAQ
What Was the Most Severe Stock Market Crash in U.S. History?
Based on the long-term cumulative decline of major indexes, the Great Depression of 1929–1932 was one of the most severe crashes in U.S. stock market history. The Dow Jones Industrial Average fell approximately 89% from its high to its low.
How Much Did U.S. Stocks Fall on Black Monday in 1987?
On October 19, 1987, the Dow Jones Industrial Average fell approximately 22.6% in a single day. The event prompted the U.S. market to further improve its circuit breaker mechanisms and cross-market risk management systems.
How Long Did the Nasdaq Take to Recover After the Dot-Com Bubble Burst in 2000?
The Nasdaq Composite reached its then-record closing high in March 2000 and did not break above that level again until April 2015, approximately 15 years later.
How Much Did the S&P 500 Fall During the 2008 Financial Crisis?
From its October 2007 high to its March 2009 low, the S&P 500 fell approximately 57% overall. It subsequently broke above its previous nominal closing high again in March 2013.
Why Did the 2020 Pandemic Market Crash Recover Relatively Quickly?
The main factors included the rapid introduction of monetary and fiscal policies, improved market liquidity, and the relatively quick recovery of earnings expectations for some large technology companies. However, a rebound in stock indexes does not mean that the real economy recovered at the same time.
Does the 2026 Technology Stock Correction Mean the Dot-Com Bubble Is Repeating?
No such conclusion can currently be drawn. Both periods involved technological innovation and expectations for high growth, but their earnings foundations, industry structures, and market environments differ. A single-day plunge does not prove that the entire technology industry has entered a long-term bear market like the one in 2000.
Will U.S. Stocks Always Rise Again After a Sharp Decline?
Major U.S. stock indexes have broken above previous highs multiple times after prolonged adjustments, but this does not guarantee that the same pattern will repeat in the future or that all individual stocks will recover. Companies may be delisted, go bankrupt, or underperform for an extended period. Investors should continue to pay attention to asset quality and risk management.