The price-to-earnings ratio (PE) is one of the most common valuation metrics in the stock market. It measures how much investors are willing to pay for each unit of a company's earnings. In the U.S. stock market, investors often use PE to compare the valuations of different companies and assess whether stock prices are reasonable. However, a company with a lower PE does not necessarily offer greater investment value, and a company with a higher PE does not necessarily mean that its stock is overpriced.
This difference is related to how the stock market prices assets. Stock prices reflect not only the profits a company has already generated, but also market expectations for future earnings growth, operating risk, and the cost of capital. For example, a mature company may have stable profits but receive a lower valuation because its growth potential is limited. Another technology company may have a high current PE but receive a market premium because investors expect its earnings to continue growing.
Therefore, understanding PE requires further analysis of the relationship between earnings growth and valuation. The PEG ratio (price/earnings to growth ratio) is widely used in this context. This article starts with how PE and PEG are calculated, explains the differences between various PE definitions, examines how growth expectations affect stock valuations, and discusses how investors can identify potential risks behind low valuations.
Key Takeaways
-
The price-to-earnings ratio (PE) measures the relationship between a stock's price and its earnings per share. A low PE does not necessarily mean that a stock is undervalued. It may also reflect declining earnings, operating risks, or weak market growth expectations.
-
Static PE, trailing PE (TTM PE), and forward PE use earnings data from different periods. They are suitable for different analytical scenarios and should not be treated as interchangeable.
-
PEG combines PE with expected earnings growth and helps compare companies with different growth rates. However, the result depends heavily on the accuracy of growth forecasts.
-
Stock valuations depend not only on current earnings, but also on future growth, earnings quality, the cost of capital, industry cycles, and market risk appetite.
-
Low-PE stocks may be value traps, while high-PE stocks may receive valuation premiums because of long-term growth expectations.
-
PE and PEG should be used together with free cash flow, the balance sheet, the competitive landscape, and a company's long-term earnings potential.
What Is the Price-to-Earnings Ratio (PE)? Why Does Stock Valuation Require a Focus on Earnings?
The price-to-earnings ratio measures the relationship between a stock's price and a company's earnings. It is usually calculated by dividing the stock price per share by earnings per share (EPS). It can also be calculated by dividing a company's total market capitalization by net income attributable to common shareholders.
For example, if a publicly traded company's stock price is $100 and its EPS for the past 12 months is $5, its trailing PE is 20x. This means that, based on the current stock price, investors are effectively paying $20 for each $1 of the company's historical annual earnings per share.
The basic PE calculation is:
PE = Stock Price Per Share ÷ Earnings Per Share (EPS)
The advantage of PE is that it is easy to calculate and connects a stock price with a company's earnings. Compared with simply comparing stock prices, PE helps investors understand the relative valuations of different companies. For example, a stock priced at $200 is not necessarily more expensive than a stock priced at $50 because the two companies may have significantly different EPS levels.
However, PE does not directly reflect the quality of a company's assets, its cash flow position, or future earnings growth. Company profits may also be affected by one-time gains, accounting adjustments, and industry cycles. Therefore, PE is better used as a starting point for stock valuation analysis rather than as the sole basis for an investment decision.
Why Isn't a Low-PE Stock Necessarily Cheap?
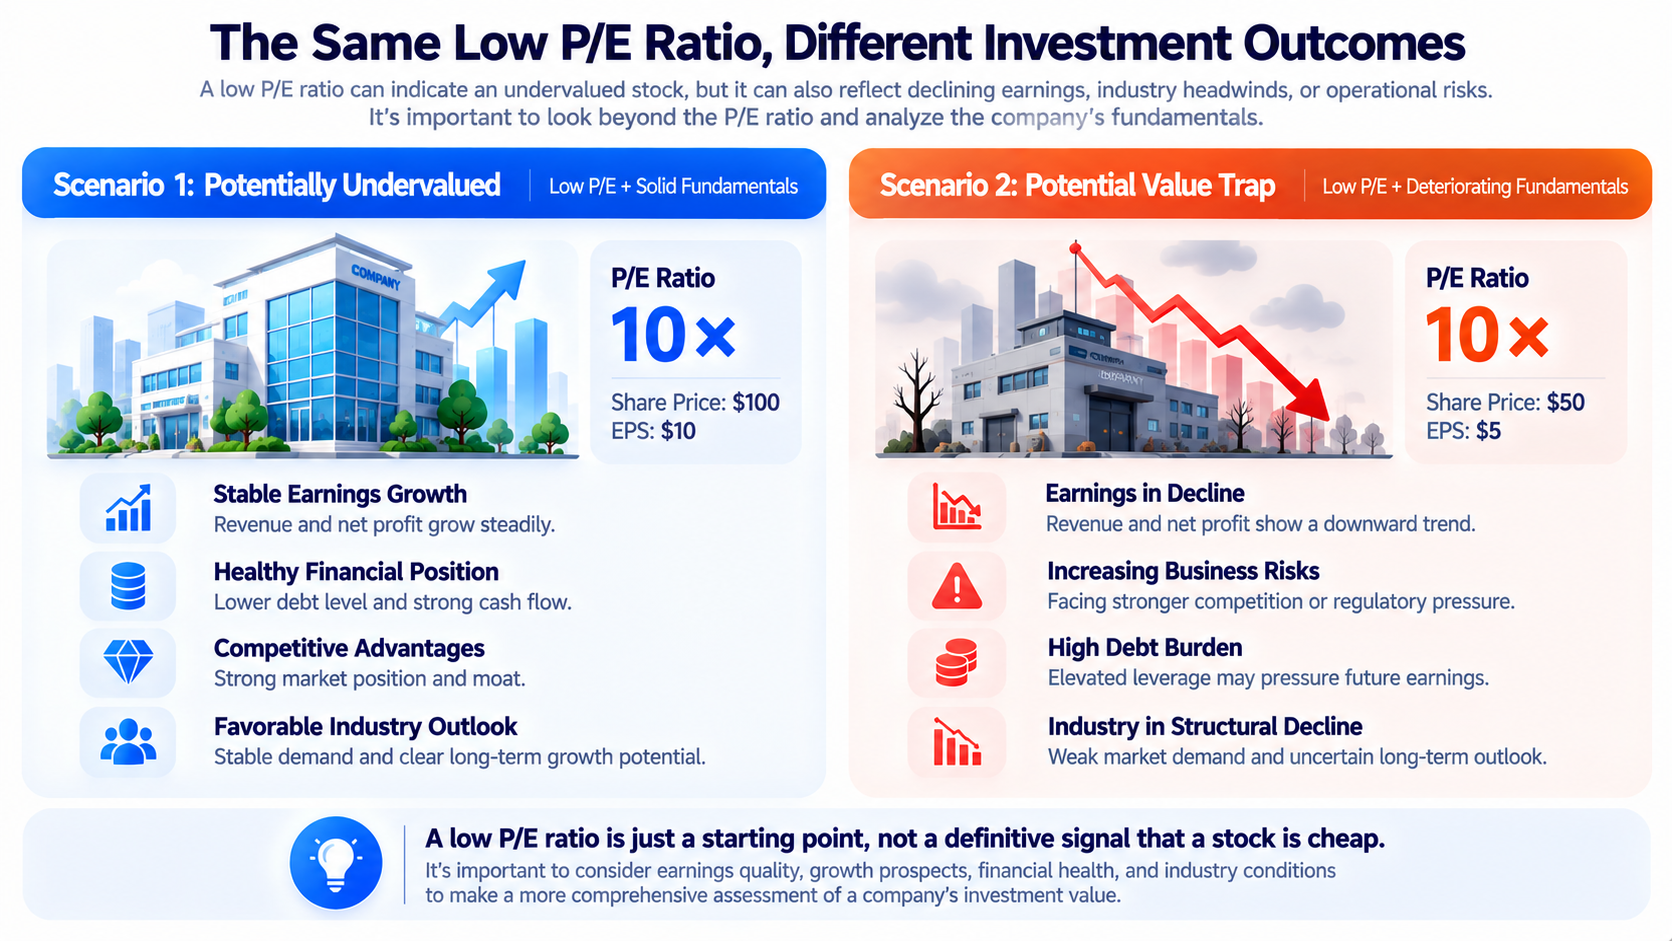
A low PE usually means that a stock's price is low relative to its current or historical earnings. However, the market may assign a low valuation for several reasons.
-
The company's future earnings may face a risk of decline. For example, if a company currently has EPS of $10 and a stock price of $100, its PE is 10x. If EPS falls to $5 the following year while the stock price remains unchanged, its forward PE will rise to 20x. The valuation that initially appeared low may simply reflect the market pricing in the risk of declining earnings in advance.
-
The company may be at the peak of its industry cycle. Cyclical companies can usually generate higher profits when demand is strong, making their PE appear low. However, earnings may fall rapidly when product prices decline, inventories increase, or market demand weakens.
-
A low PE may also reflect issues such as high debt, declining market share, technological substitution, or regulatory changes. These risks can affect the stability of future earnings and make investors unwilling to assign a higher valuation multiple.
Therefore, determining whether a low-PE stock is cheap requires more than looking at its current valuation. Investors also need to analyze whether the company's earnings are sustainable and why the market has assigned it a low price.
What Are the Differences Between Static PE, Trailing PE, and Forward PE?
In stock analysis, PE is not a single metric. Depending on the period covered by the earnings data, PE is generally divided into static PE, trailing PE, and forward PE.
| Type |
Calculation Basis |
Primary Use |
Limitation |
| Static PE |
EPS for the most recent complete fiscal year |
Evaluating historical annual valuation |
Data may be outdated |
| Trailing PE (TTM) |
EPS for the most recent consecutive 12 months |
Reflecting more recent actual earnings |
Still based on historical data |
| Forward PE |
Forecast EPS for the next 12 months or the next fiscal year |
Measuring future earnings expectations |
Depends on analyst forecasts |
Static PE is useful for understanding the relationship between a company's earnings and stock price during the most recent complete fiscal year. However, if the company's operating conditions have changed significantly in recent months, static PE may not reflect those changes in a timely manner.
Trailing PE uses actual earnings from the most recent four quarters. It reduces the lag caused by different fiscal year-end dates and is therefore commonly used in U.S. stock analysis. However, trailing PE is still based on historical profits and cannot guarantee that future earnings will remain at the same level.
Forward PE uses forecasts of future earnings. If the market expects a company's earnings to grow significantly, its forward PE may be lower than its trailing PE. For example, if a company's current stock price is $120, its EPS for the past 12 months is $4, and its forecast EPS for the next 12 months is $6, its trailing PE is 30x and its forward PE is 20x.
Note that different data platforms may use different definitions when calculating forward PE. Some use forecast EPS for the next fiscal year, while others use forecast EPS for the next 12 months. Therefore, investors should use consistent data definitions whenever possible when comparing stock valuations.
What Is PEG? How Does It Incorporate Earnings Growth Into Stock Valuation?
PEG combines PE with a company's earnings growth rate and is primarily used to analyze the relative valuations of companies with different growth rates.
Traditional PE focuses on the relationship between a stock's price and its earnings, while PEG also considers the company's expected future earnings growth rate. For example, two companies may both have a PE of 30x, but one is expected to grow its earnings by 10% annually while the other is expected to grow by 30%. If other conditions are similar, the higher growth expectations for the latter may make its current valuation easier to justify.
A common PEG calculation is:
PEG = PE ÷ Expected Annual EPS Growth Rate (expressed as a percentage value)
For example, if a company has a PE of 30x and its expected annual EPS growth rate is 20%, its PEG is 1.5. The calculation uses 20, not 0.20. In traditional valuation analysis, a PEG below 1 is sometimes viewed as a relatively low valuation compared with the company's growth rate, while a PEG above 1 may indicate that investors are paying a higher price for growth. However, this interpretation is not a universally applicable investment rule.
The main issue with PEG is that the growth rate is based on forecasts. Different analysts may use growth expectations for the next year, three years, or five years, resulting in different calculations. If a company's actual growth falls below expectations, a PEG that initially appeared low may rise rapidly.
In addition, PEG is generally more suitable for companies with positive earnings and relatively predictable growth. For loss-making companies, highly cyclical companies with volatile earnings, or companies with growth rates close to zero, PEG may have limited interpretive value.
How Are PE and PEG Calculated? Understanding Valuation Differences Through an Example
To understand the difference between PE and PEG, assume that three publicly traded companies are at different stages of growth.
| Metric |
Company A |
Company B |
Company C |
| Stock Price |
$100 |
$150 |
$80 |
| Earnings Per Share (EPS) |
$10 |
$5 |
$4 |
| PE |
10x |
30x |
20x |
| Expected Annual EPS Growth Rate |
5% |
30% |
10% |
| PEG |
2 |
1 |
2 |
The figures above are hypothetical and are provided only to illustrate how valuation is calculated. They do not represent actual publicly traded companies. Based on PE, Company A has the lowest PE and appears to have the lowest valuation. However, when growth expectations are considered, Company A's earnings growth rate is only 5%, giving it a PEG of 2.0. Company B has a PE of 30x, but its expected earnings growth rate is 30%, resulting in a PEG of 1.0.
This shows that a higher PE may be related to higher growth expectations, while a lower PE does not necessarily indicate a more attractive valuation. If Company B's actual earnings growth rate is only 10%, rather than the initially expected 30%, its PEG would rise from 1.0 to 3.0 based on the same PE. This means that PEG is highly sensitive to earnings growth expectations.
Therefore, PE and PEG comparisons should be based on reasonable earnings forecasts and similar risk conditions rather than on simply selecting the stock with the lowest value.
Why Can't PE and PEG Be Compared Directly Across Different Industries?
Different industries have different business models, capital requirements, earnings stability, and growth potential. As a result, reasonable PE and PEG ranges may vary significantly. For example, utility companies generally have relatively stable operating demand, but their growth rates may be slower. Investors may pay more attention to their cash flow stability, debt levels, and ability to pay dividends.
Technology companies may achieve high growth through software, cloud computing, or digital platforms. However, their valuations are also more sensitive to changes in expectations for future market size, technological competition, and growth. Cyclical industries are even more complex. The profits of automakers, steel producers, energy companies, and some semiconductor companies may fluctuate significantly with changes in industry supply and demand. At the peak of a cycle, companies may have high profits and low PE. At the bottom of a cycle, profits may decline and PE may rise instead.
This means that the low PE of a cyclical company may sometimes occur when earnings are near a peak, while a higher PE may occur when earnings are near a trough. For financial companies such as banks, investors also need to consider metrics such as return on equity (ROE), price-to-book ratio (PB), asset quality, and capital adequacy. For real estate investment trusts (REITs), metrics such as FFO and AFFO are generally more appropriate for the industry.
Therefore, when comparing PE and PEG, it is generally more useful to prioritize companies with similar business models, industry cycles, and earnings structures rather than making direct comparisons across industries.
How Do Growth Expectations Affect Stock Prices and Valuation Multiples?
Stock prices reflect market expectations for a company's future earnings and cash flow, not just its realized operating results. When investors expect a company to continue increasing revenue, improving profit margins, and generating more free cash flow, they may be willing to pay a higher price for its current earnings, resulting in a higher PE.
For example, some companies in industries such as artificial intelligence, cloud computing, and semiconductors may receive high valuations because the market expects future demand to expand. However, if actual growth fails to meet expectations, the stock price may decline even if the company continues to grow its earnings.
This is because stock prices are affected not only by changes in earnings, but also by changes in valuation multiples. A stock price can be understood as the result of two factors working together: earnings per share and the PE multiple the market is willing to assign.
Assume that a company has current EPS of $5 and a PE of 30x, resulting in a stock price of $150. If EPS grows to $6 the following year but the market reduces the PE from 30x to 20x, the corresponding stock price will be $120. In this example, the company's earnings grew by 20%, but its stock price fell by 20% because its valuation multiple declined.
This shows that stock investing requires investors to assess not only whether a company can grow, but also whether its current price already reflects overly high growth expectations. In addition, changes in interest rates may affect valuations. When the market requires a higher rate of return, the present value of future earnings and cash flow may decline, putting pressure on the valuation multiples of growth companies.
Therefore, the key to understanding growth expectations is distinguishing between a company's actual operating growth and the growth expectations that the market has already priced into the stock.
What Is a Value Trap? How Can Investors Identify the Potential Risks of Low-PE Stocks?
A value trap is a stock that appears to have a low valuation but is not truly undervalued because the company's fundamentals continue to deteriorate or its earnings quality is inadequate.
One reason a low-PE stock may become a value trap is that its current profits are not sustainable. For example, a company may generate a one-time gain by selling assets, significantly increasing its net income for the period and thereby lowering its PE. However, if its core business has not improved, future earnings may decline again.
Another possibility is that the industry's structure has changed. A company may once have had a stable market share, but its long-term earnings potential may gradually weaken as a result of technological substitution, shifts in consumer demand, or the entry of new competitors. Even if its current PE is low, it may reflect the market's assessment of future operating risks.
Highly leveraged companies may also have low valuations. When financing costs rise or operating cash flow declines, debt repayment pressures may limit the company's ability to invest and generate returns for shareholders.
When identifying value traps, investors can focus on the following questions:
-
Have the company's revenue and EPS remained stable over the past several years, or have they depended on one-time gains?
-
Does operating cash flow support the company's reported profits?
-
Is the company facing a sustained decline in market share or profitability?
-
Are debt levels and interest expenses affecting financial stability?
-
Is the current low PE mainly the result of unusually high profits at the peak of an industry cycle?
Note that a low valuation does not necessarily indicate a value trap. Some companies may receive low valuations because of short-term market sentiment, an industry adjustment, or temporary operating difficulties. The key is to distinguish short-term pressure from a decline in long-term competitiveness.
How Can Investors Evaluate Stocks Using PE, PEG, Cash Flow, and Industry Cycles?
PE and PEG can help investors form an initial valuation assessment, but a more complete analysis requires consideration of earnings quality, cash flow, financial structure, and the industry environment.
-
PE can be used to understand the valuation multiple the market assigns to current or future earnings and to compare it with the company's historical range and peer companies in the same industry. If PE is significantly lower, investors should further analyze the operating reasons behind it.
-
PEG can be used to incorporate growth expectations into the comparison, but investors should examine the time period and reasonableness of the forecast growth rate. For companies with highly volatile earnings, investors should also consider how valuations change under different growth scenarios.
-
Investors can examine operating cash flow and free cash flow. If a company's net income continues to grow but its operating cash flow fails to improve over the long term, its earnings quality may require further analysis. For capital-intensive companies, investors also need to consider the capital expenditures required to maintain existing operations.
-
Investors should analyze the balance sheet, including debt levels, cash reserves, financing costs, and potential equity dilution risks. These factors may affect the company's future profits and shareholders' equity.
Finally, investors should consider the industry cycle to determine whether current earnings are representative. For cyclical companies, it may be more appropriate to consider average earnings over several years, changes in industry supply and demand, and capacity utilization rather than relying only on the PE for a single quarter or year.
| Analytical Dimension |
Key Metrics |
Core Question |
| Current Valuation |
PE, Forward PE |
How much is the market paying for earnings? |
| Earnings Growth |
PEG, EPS Growth Rate |
Does the valuation match growth expectations? |
| Earnings Quality |
Operating Cash Flow, Profit Margin |
Can reported profits be converted into cash? |
| Capital Efficiency |
ROE, ROIC |
Can the company use invested capital effectively? |
| Financial Risk |
Debt Ratio, Interest Coverage Ratio |
Can the company withstand financing and debt repayment pressure? |
| Industry Environment |
Supply and Demand Cycle, Competitive Landscape |
Are current earnings sustainable? |
For investors, the goal of valuation analysis is not to find the stock with the lowest PE or PEG. It is to understand the earnings growth and risk expectations implied by the current price and determine whether those expectations are reasonable.
Summary
PE is an important stock valuation tool, but a low PE does not mean that a stock is necessarily cheap. Declining future earnings, changes in industry cycles, financial risks, and limited growth potential can all cause the market to assign a lower valuation.
PEG adds earnings growth to the analysis and provides an additional perspective for PE. It helps explain why companies with different growth rates may have different valuation multiples. However, PEG depends heavily on forecast data and cannot independently prove that a stock is undervalued or overvalued.
In practice, investors need to combine PE, PEG, free cash flow, the balance sheet, and the industry's competitive environment to assess whether a company's earnings are sustainable and whether its current stock price reasonably reflects future growth and risks. Whether a stock is cheap ultimately depends on the relationship between its price and the company's long-term value, not simply on the level of its valuation multiple.
FAQ
Is a Lower PE Always a Reason to Buy a Stock?
Not necessarily. A low PE may indicate that a stock has a low valuation, but it may also mean that the company's earnings are declining, its industry outlook is unfavorable, or its operating risks are high. Investors need to analyze earnings quality and future growth together.
Which Is Cheaper: a PE of 10x or 30x?
If all other conditions are exactly the same, a PE of 10x means that investors are paying less for each unit of earnings. In practice, however, companies may differ in their growth rates, financial risks, and business models. Therefore, investment value cannot be determined based on PE alone.
Does a PEG Below 1 Mean That a Stock Is Undervalued?
Not necessarily. A PEG below 1 only means that PE is relatively low compared with the growth rate under a specific set of growth assumptions. If the earnings growth forecast is overly optimistic, PEG may not accurately reflect the stock's actual valuation.
How Should Investors Evaluate PE and PEG for Loss-Making Companies?
When a company's net income is negative, traditional PE generally has limited explanatory value, and PEG is also difficult to use effectively. Depending on the company, investors may consider metrics such as the price-to-sales ratio (PS), cash flow, unit economics, and future earnings potential. However, these metrics also have limitations.
Why Do Some High-PE Stocks Still Attract Investor Attention?
The market may expect these companies to achieve high earnings growth, maintain a competitive advantage, or generate more free cash flow in the future. However, a high PE also means that the stock price may already reflect high expectations. If actual growth falls short of expectations, the stock may face a valuation adjustment.