In early November 2026, BTC Price declined sharply again. Lower risk appetite and the liquidation of leveraged long positions compounded each other, bringing renewed attention to the way leveraged trading can amplify price volatility. From November 5 to 6, crypto assets and U.S. technology stocks came under pressure simultaneously, and BTC briefly fell below $76,000. During the market volatility on November 5, crypto derivatives liquidations exceeded $1 billion within 24 hours. Later, on the evening of November 8, BTC briefly reached approximately $73,708, its lowest level in more than two months.
These developments show that short-term declines in the crypto market depend not only on investors' active buying and selling, but may also be jointly affected by margin systems, automatic liquidation mechanisms, and market liquidity. Against the backdrop of the recent sharp decline in BTC, this article examines how leveraged liquidations can create a cascading effect and which risk indicators investors should monitor.
Key Takeaways
-
Leveraged trading allows investors to control larger notional positions with less margin, but it also magnifies potential gains and losses.
-
A decline in the BTC price may cause highly leveraged long positions to fall below maintenance margin requirements, triggering forced liquidation.
-
When large numbers of positions are concentrated within similar price ranges, liquidation orders may intensify selling pressure and create a liquidation cascade.
-
ETF outflows, declining market depth, and changes in risk appetite may affect the BTC price alongside leveraged liquidations, but their individual effects should not be treated as equivalent.
-
Monitoring open interest, funding rates, liquidation data, and order book depth can help identify market leverage risks, but these indicators cannot accurately predict short-term price movements.
Why Can BTC Decline Sharply Within a Short Period?
The BTC price is continuously determined by buyers and sellers in the market. When selling demand significantly exceeds buying demand over a short period, or when buyers are unwilling or unable to provide sufficient liquidity, the price may fall rapidly.
Unlike some traditional financial assets, crypto markets generally operate around the clock. Spot, perpetual futures, delivery futures, and other derivatives markets are closely connected. Price changes across different trading venues can quickly spread through arbitrage and risk management activities. As a result, selling pressure in a local market may sometimes extend to a broader trading environment.
The BTC decline in early November 2026 had multiple contributing factors. U.S. technology stocks underwent a significant correction, while concerns grew about investment in AI infrastructure, policy changes, and the future performance of risk assets. At the same time, U.S. spot BTC ETFs experienced net outflows, and some investors reduced their exposure to crypto assets.
On November 5, U.S. spot BTC ETFs recorded net outflows of more than $400 million in a single day. BTC subsequently fell below $75,000 on November 6. During the same period, the market saw large-scale liquidations of leveraged positions, further increasing short-term volatility.
However, it is important to distinguish between the initial drivers of a price decline and the factors that amplify the decline as it unfolds. Macroeconomic expectations, institutional fund flows, or unexpected events may change market participants' willingness to buy or sell. Leveraged liquidations, by contrast, may accelerate the decline after prices have already begun to fall. Therefore, BTC's entire decline cannot be simply attributed to a single large sell order, nor can the market bottom be determined based solely on liquidation amounts.
What Is Leveraged Trading, and Why Does It Amplify Gains and Losses?
Leveraged trading refers to establishing a larger market exposure by borrowing funds or using the margin mechanism of derivatives with a relatively small amount of initial capital. For example, a trader with 1,000 USDT could establish a BTC position worth approximately 1,000 USDT without using leverage. With 10x leverage, the trader could establish a position with a notional value of approximately 10,000 USDT.
Assume that the BTC price rises by 5%. The theoretical profit on that position would be approximately 500 USDT, equivalent to 50% of the initial margin. However, if BTC falls by 5%, the theoretical loss would likewise be approximately 500 USDT, equivalent to half of the initial margin.
| BTC Price Change |
Profit or Loss at 1x Exposure |
Profit or Loss at 5x Leverage |
Profit or Loss at 10x Leverage |
| Up 5% |
0.05 |
0.25 |
0.5 |
| Down 5% |
-5% |
-25% |
-50% |
| Down 8% |
-8% |
-40% |
-80% |
The examples above are simplified calculations based on initial margin and do not account for trading fees, funding rates, slippage, or forced liquidation. An actual position may be liquidated before reaching the loss percentages shown in the table.
Leverage does not change the magnitude of BTC's underlying price movements, but it amplifies changes in a trader's account equity relative to the initial margin. This means that even a short-term adjustment of only a few percentage points in BTC may result in significant losses for highly leveraged traders. For positions with limited margin and no timely additional funds, a forced liquidation may be triggered without an extreme market decline.
In addition, higher leverage generally means that a position can withstand less adverse price movement. Traders must assess not only the market direction but also whether short-term volatility could close a position prematurely.
How Does Forced Liquidation Occur?
Forced liquidation (Liquidation) is an important risk control mechanism in leveraged trading. When a position's margin is insufficient to meet the platform's maintenance margin requirement, the trading system may automatically reduce or close the position to limit further risk.
Consider a BTC perpetual futures long position. The trader expects BTC to rise and therefore establishes a long contract position. If the BTC price falls, the position incurs unrealized losses, reducing the account equity available to support it. When the equity falls to the specified risk threshold, the platform may trigger forced liquidation.
This process generally involves three key concepts.
-
Initial Margin is the funds a trader must provide when establishing a leveraged position. With all other conditions equal, higher leverage generally requires less initial margin.
-
Maintenance Margin is the minimum margin required to keep a position open. When the position's equity is insufficient to meet this requirement, it may enter the liquidation process.
-
Mark Price is a reference price used by some derivatives trading systems to calculate unrealized profit and loss and assess liquidation risk. It may differ from the latest market transaction price to reduce the impact of abnormal transactions in a single market on liquidation decisions.
For example, a trader establishes a 10x BTC long position when BTC is priced at $80,000. If the price continues to fall, the trader's margin equity will continue to decline. The actual liquidation price must be calculated based on the position size, margin mode, maintenance margin rate, fees, and platform rules. A 10% decline in price should not be treated as a fixed liquidation condition. Different platforms may also use partial liquidation, tiered position reductions, and risk limit systems. As a result, the actual liquidation process is not identical across platforms.
Why Can Forced Liquidation Trigger a Liquidation Cascade?
A liquidation cascade occurs when a price movement triggers the forced liquidation of an initial group of leveraged positions, and the resulting closing trades further affect the price, causing more positions to reach their liquidation thresholds. During a market decline, the forced closure of large numbers of long positions may increase selling pressure. If buying liquidity in the order book is insufficient, these orders may push the price down further.
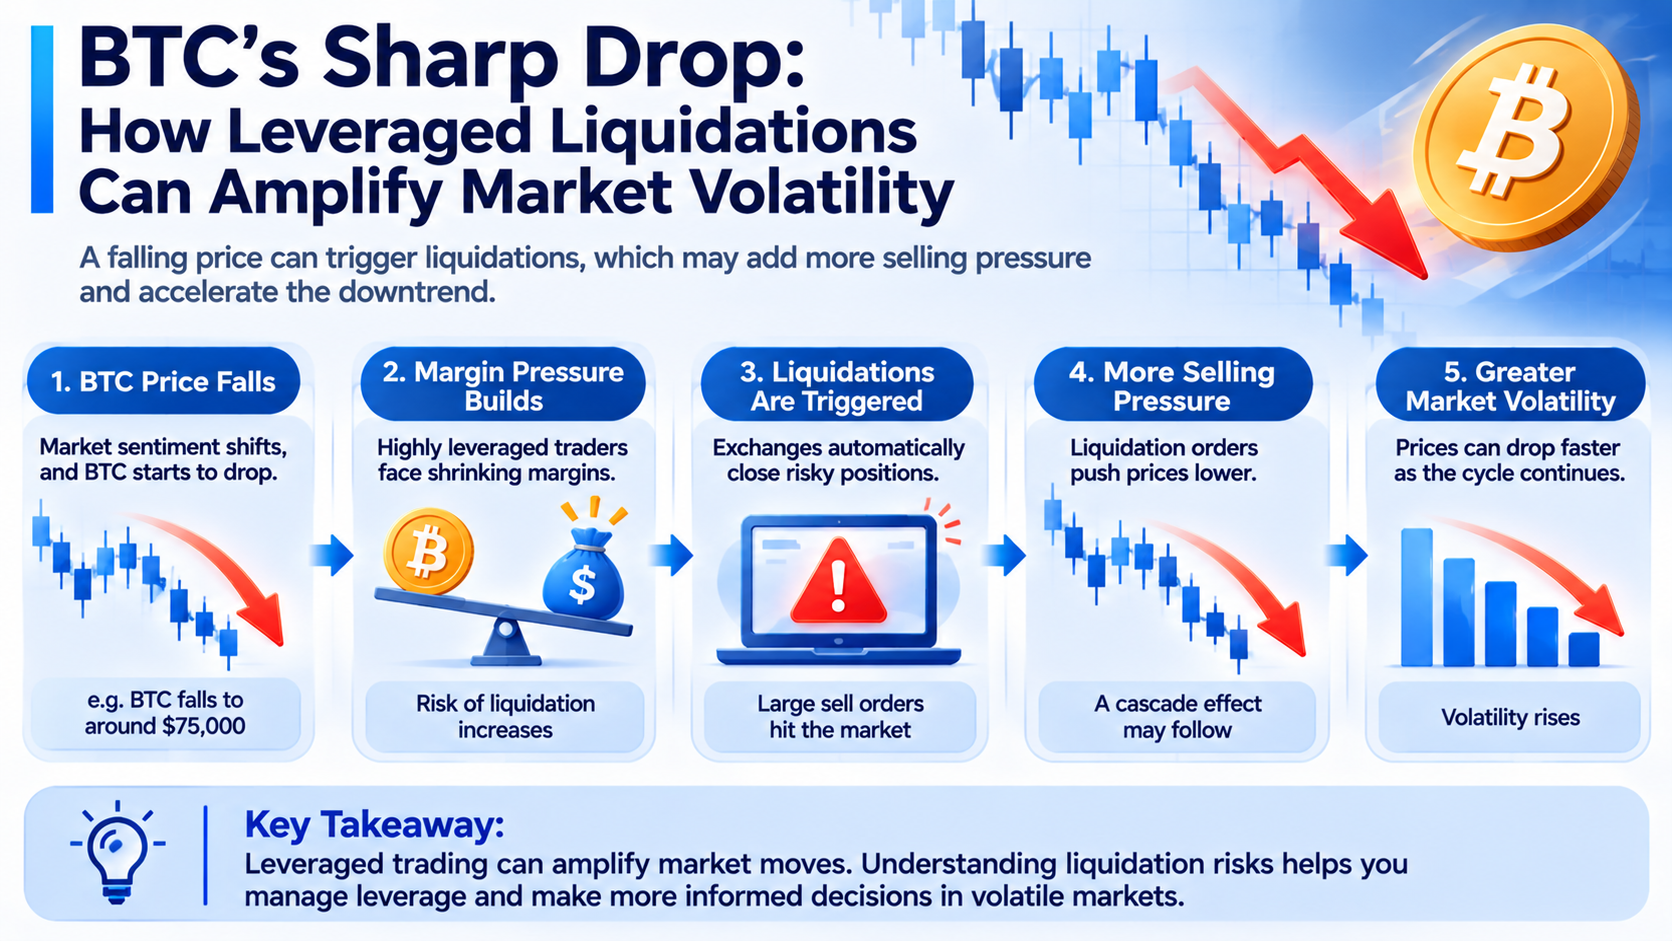
As the price continues to fall, other long positions that had not yet reached their liquidation thresholds may also be liquidated, creating a continuing release of risk. However, not every liquidation event leads to a sustained cascade. If the market has sufficient buying liquidity, or if new buying demand can absorb closing orders, the price impact may be relatively limited.
In addition, the notional liquidation amounts disclosed by exchanges cannot be directly equated with new spot-market selling. Some liquidations occur in derivatives markets, and their specific price impact also depends on the platform's execution methods, counterparty liquidity, and cross-market arbitrage activity.
Why Does Market Liquidity Affect the Scale of BTC Liquidations?
Market liquidity refers to the ability to buy or sell an asset without significantly affecting its price. For BTC, liquidity depends not only on trading volume but also on order book depth, bid-ask spreads, and traders' risk tolerance. When liquidity is sufficient, large sell orders may be gradually absorbed by buy orders at different price levels, resulting in a relatively limited price impact. However, if market participants collectively withdraw their buy orders and order book depth declines, sell orders of the same size may cause a larger price movement.
For example, assume that BTC is currently priced at $75,000 and that a trading market has ample buy orders near that price. Even if a relatively large sell order appears, the price may change only to a limited extent. If buying demand suddenly declines, forced liquidation orders may need to execute at lower prices, increasing slippage. In this situation, the market may enter a self-reinforcing process: falling prices cause liquidity providers to reduce their risk exposure, while reduced buying demand increases the price impact of subsequent liquidation orders.
However, BTC spot and derivatives trading is distributed across multiple venues, so the liquidity of the entire market cannot be assessed based solely on the order book depth of one platform. Investors should also note that increased trading volume does not necessarily indicate improved liquidity. During periods of extreme volatility, bid-ask spreads may widen and actual trading costs may increase even when trading volume rises significantly.
What Is the Relationship Between Spot BTC ETF Outflows and Leveraged Liquidations?
U.S. spot BTC ETFs provide investors with a way to gain exposure to the price of Bitcoin through securities markets. ETF creations and redemptions involve fund assets, authorized participants, and related market transactions. As a result, ETF fund flows may affect the supply and demand dynamics of the BTC market.
In early November 2026, U.S. spot BTC ETFs experienced significant net outflows. On November 5, several major BTC ETF products recorded substantial redemptions, while BTC and technology stocks declined simultaneously.
However, ETF outflows and forced liquidation in derivatives are different mechanisms. ETF net outflows reflect changes in fund share flows and may be accompanied by transactions in the underlying assets. Leveraged liquidation, by contrast, is a risk control action triggered when a derivatives position has insufficient margin. The two may occur at the same time during a market decline, but ETF net outflows and liquidation amounts cannot be added together directly and treated as the market's actual selling pressure.
ETF outflows may change expectations regarding institutional demand, and derivatives traders may adjust their positions accordingly. If the price continues to fall and reaches the liquidation thresholds of highly leveraged long positions, forced closing in the derivatives market may further amplify volatility. Therefore, when analyzing a sharp BTC decline, investors should monitor both spot fund flows and changes in derivatives leverage. However, the simultaneous occurrence of the two does not by itself establish a direct causal relationship.
How Can Open Interest and Funding Rates Be Used to Assess Leverage Risk?
Open interest (OI) refers to the size of derivatives contracts that have not yet been closed or settled in the market. It can help investors observe how much contract exposure remains in the market, but it cannot directly distinguish the net long or short direction of all participants. When the BTC price rises and open interest continues to increase, this may indicate that more funds are entering the derivatives market. If funding rates are also high, it may indicate that some traders are willing to pay a higher cost to maintain long positions, potentially reflecting crowded bullish trades.
The funding rate is one of the mechanisms used in perpetual futures to align the contract price with the spot price. Under normal circumstances, a positive funding rate means that longs pay fees to shorts, while a negative funding rate means that shorts pay fees to longs. However, the specific calculation and settlement rules depend on the trading platform.
Investors can monitor market risk using the following indicators:
| Indicator |
What to Monitor |
Potential Risk Indicated |
| Open Interest (OI) |
Whether contract size is increasing rapidly |
Leverage exposure may be expanding |
| Funding Rate |
Whether the cost of long or short positions is significantly elevated |
Trading in one direction may be crowded |
| Liquidation Amount |
Whether concentrated liquidations are occurring |
Leveraged positions are being rapidly cleared |
| Order Book Depth |
Whether buy and sell orders are declining significantly |
The price impact of large trades may increase |
| Spot Trading Volume |
Whether sustained aggressive selling is occurring |
Demand in the spot market may be weakening |
| ETF Fund Flows |
Changes in funds flowing through institutional investment channels |
Risk appetite may be changing |
These indicators should be analyzed together with price trends.
For example, a decline in the BTC price accompanied by a sharp decrease in open interest may indicate that some leveraged positions are being closed or liquidated. However, a decline in open interest may also result from traders voluntarily reducing their positions. This change alone cannot confirm that large-scale forced liquidation has occurred. If the BTC price falls while open interest increases, new short positions may be opening, or other hedging trades may be involved. Further analysis of funding rates, trading data, and market structure is required.
Likewise, a shift in the funding rate from positive to negative does not necessarily mean that the market has bottomed. It may reflect a change in trading direction, while the price may continue to fall. These indicators are therefore better suited to monitoring risk than serving as independent buy or sell signals.
Will BTC Rebound After Large-Scale Liquidations?
Large-scale liquidations generally mean that some highly leveraged positions have been forced out of the market. Once these positions have been closed, short-term passive selling pressure may ease, giving the market an opportunity to establish a new balance between buyers and sellers. However, a large liquidation amount does not mean that the price will necessarily rebound immediately.
-
Leveraged liquidations reflect changes in only some derivatives positions. If sustained selling pressure remains in the spot market, or if the macroeconomic environment continues to deteriorate, BTC may remain under pressure.
-
Liquidation data varies by time window. Different data platforms may differ in their exchange coverage, contract types, and methods for calculating notional amounts. Therefore, the liquidation amount during a given period cannot simply be interpreted as evidence that the market has fully deleveraged.
-
Some traders may establish new highly leveraged positions after a price decline. If the new positions become concentrated within similar price ranges, the market may experience another round of liquidations.
In addition, a short-term rebound after a sharp decline may result from short covering rather than a recovery in long-term buying demand. Short covering can drive the price higher quickly, but its sustainability still depends on subsequent market funds and trading demand. Therefore, assessing whether the market is gradually stabilizing requires considering price volatility, spot demand, open interest, and the recovery of liquidity rather than focusing only on the day's liquidation amount.
How Can Retail Investors Reduce the Risk of Leveraged Liquidation?
For retail investors, one of the greatest risks of leveraged trading is that a position may be forcibly closed by short-term volatility before the long-term price outlook has been validated.
It is important to understand the relationship between leverage and margin risk. Higher leverage can improve capital efficiency, but it also reduces the amount of adverse price movement a position can withstand. Even if BTC's long-term trend aligns with expectations, a sharp short-term decline may cause a highly leveraged long position to be closed prematurely.
Investors should understand the difference between isolated margin and cross margin. Isolated margin generally allocates a specific amount of margin to an individual position, helping limit that position's direct impact on other funds in the account. Cross margin may use more of the account's available margin to support a position, but it may also increase overall account risk. The specific scope of risk depends on the platform's rules.
Slippage and execution risk during extreme market conditions should also be considered. Stop-loss orders can help manage trading risk, but they do not guarantee execution at the preset price during periods of severe volatility. Some orders may experience significant slippage because of insufficient liquidity.
Investors should not treat the liquidation price as their only risk control indicator. Even if a position remains some distance from its estimated liquidation price, it may still be affected by funding rates, changes in margin requirements, losses on other positions in the account, and declining market liquidity.
For users who are unfamiliar with margin requirements and the mechanics of contract trading, reducing or avoiding leverage exposure is generally more effective for controlling risk than trying to predict every sharp market decline.
Summary
The sharp BTC decline in early November 2026 once again demonstrated the complex relationship between leveraged trading and market liquidity. A price decline may initially result from changing macro risk appetite, fund outflows, or active selling. However, when large numbers of leveraged long positions are concentrated within similar price ranges, forced liquidation may add to selling pressure and turn an otherwise limited market adjustment into more severe short-term volatility.
Leveraged liquidation is not the only cause of a BTC price decline, nor does the end of liquidations mean that the market will necessarily rebound. Its impact depends on position size, margin levels, trade execution methods, and market liquidity.
For investors, understanding open interest, funding rates, maintenance margin, and order book depth is more useful for identifying risk than focusing solely on liquidation amounts. Particularly when market sentiment changes rapidly, controlling leverage and managing positions appropriately are important foundations for avoiding forced exits caused by short-term volatility.
FAQ
What Does BTC Liquidation Mean?
BTC liquidation generally refers to a leveraged position being forcibly closed by a trading platform because of insufficient margin. In contract trading, a trader may be liquidated by the system as a result of market price movements even without actively selling the position.
Why Can a 5% Decline in BTC Cause a Highly Leveraged Position to Lose Most of Its Margin?
Leverage increases the ratio between a position's notional value and its initial margin. With 10x leverage, a 5% decline in BTC corresponds to a theoretical loss of approximately 50% of the initial margin, before trading fees and other factors are taken into account.
Will Large-Scale BTC Liquidations Necessarily Cause the Price to Continue Falling?
Not necessarily. Liquidations may increase short-term selling pressure, but the ultimate price movement also depends on buying liquidity, spot demand, and the trading activity of other market participants.
Does a Decline in Open Interest Mean That Market Risk Has Been Released?
Not necessarily. A decline in OI may reflect voluntary position reductions or forced liquidations, but it does not prove that all leverage risk has disappeared. New position concentrations and liquidity changes may still occur.
Will Spot BTC ETF Outflows Directly Trigger Contract Liquidations?
No. ETF outflows and contract liquidations are different mechanisms. However, changes in ETF flows may affect prices and market expectations, which can indirectly affect the risk of leveraged positions.
How Can Investors Assess the Potential for a BTC Liquidation Cascade?
Investors can monitor open interest, funding rates, market liquidity, and recent liquidation data to assess potential risks. However, because actual position distributions and trading activity are difficult to fully observe, the timing and scale of a liquidation cascade cannot be accurately predicted.