Square
Following
Hot
News
Notifications
Profile
Share your thoughts
placeholder
Article
Crypto Market Morning Updates..
live-cover
LIVE1,762
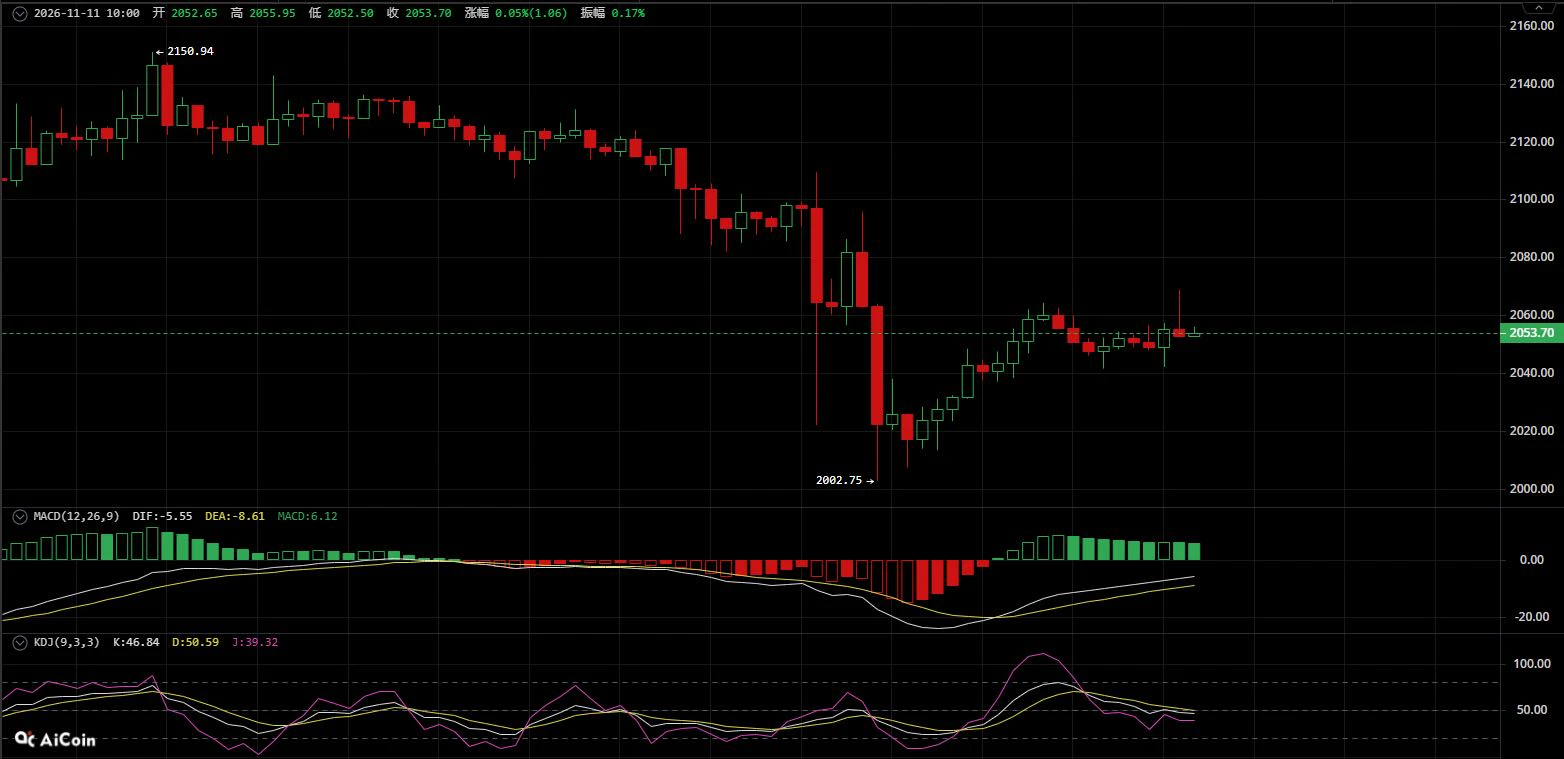
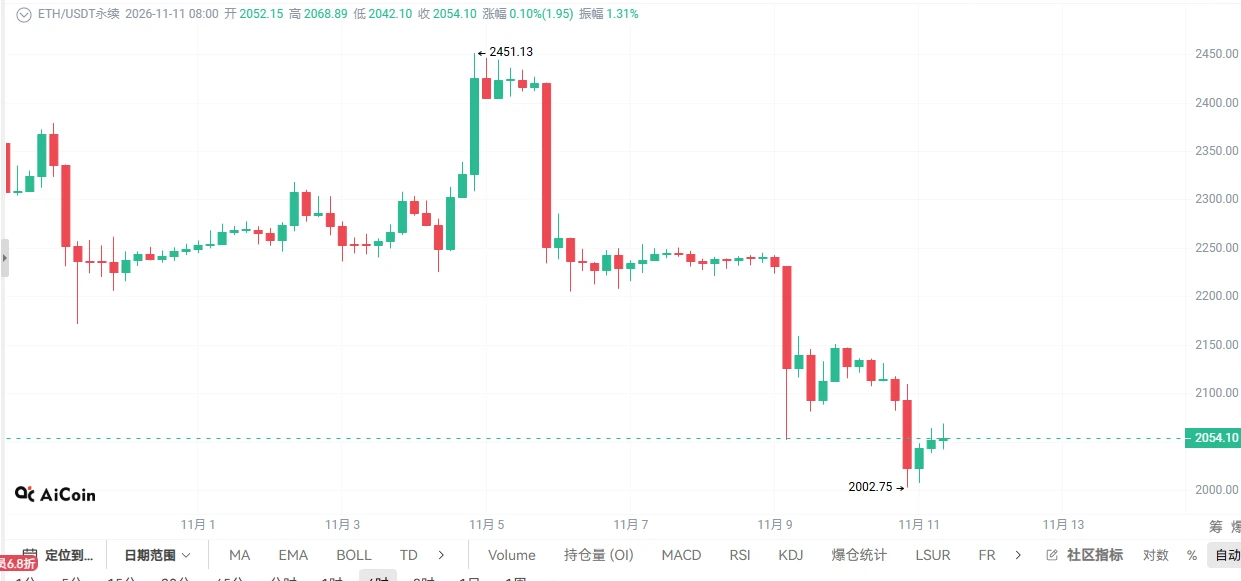
November 11 $ETH : The short-dominated market structure remains unchanged; rebounds under pressure remain opportunities to short.

【Today's Strategy】
Short entry range: Enter on a rebound to 2070—2090
Stop-loss: Above 2110
Take-profit: Target 2020—2000

【Core Rationale】
After probing a new low for this phase at 2002.75, the 30-minute chart began a weak rebound. The overall descending channel remains intact, and there are no signs of a shift in the short-dominated market structure. The MACD lines continue to run below the zero line. Although red histogram bars have appeared, their momentum is we
post-image
ETH-1.26%
  • 2
Trenches
mihao
m
bade
b
mihao
4Cxj...pump
Market Cap
$.
Change
.
24h Vol
$.
Holders
.
PIEVERSE
P
bade
b
PIEVERSE
0x0e...25a9
Market Cap
$.
Change
.
24h Vol
$.
Holders
.
X
X
bade
b
X
9VZe...pump
Market Cap
$.
Change
.
24h Vol
$.
Holders
.
DacityCoin
D
bade
b
DacityCoin
DKYc...pump
Market Cap
$.
Change
.
24h Vol
$.
Holders
.
Dacity
D
bade
b
Dacity
nxPq...pump
Market Cap
$.
Change
.
24h Vol
$.
Holders
.
Crypto liquidity is terrible right now—it keeps falling, and I keep buying the dip.

Look at U.S. stocks: this rebound has still paid off. I think those of us who opened long positions near the bottom in U.S. stocks can keep holding, then close out once the rebound runs its course and the market starts moving sideways.
But these past two months have also been a good time to gradually build long positions in BTC and ETH. No need to keep studying candlestick charts—if you're bearish, don't short. Gradually buy the dip and build positions, then wait for a small bull market toward the end of the y
BTC-0.67%
ETH-1.26%
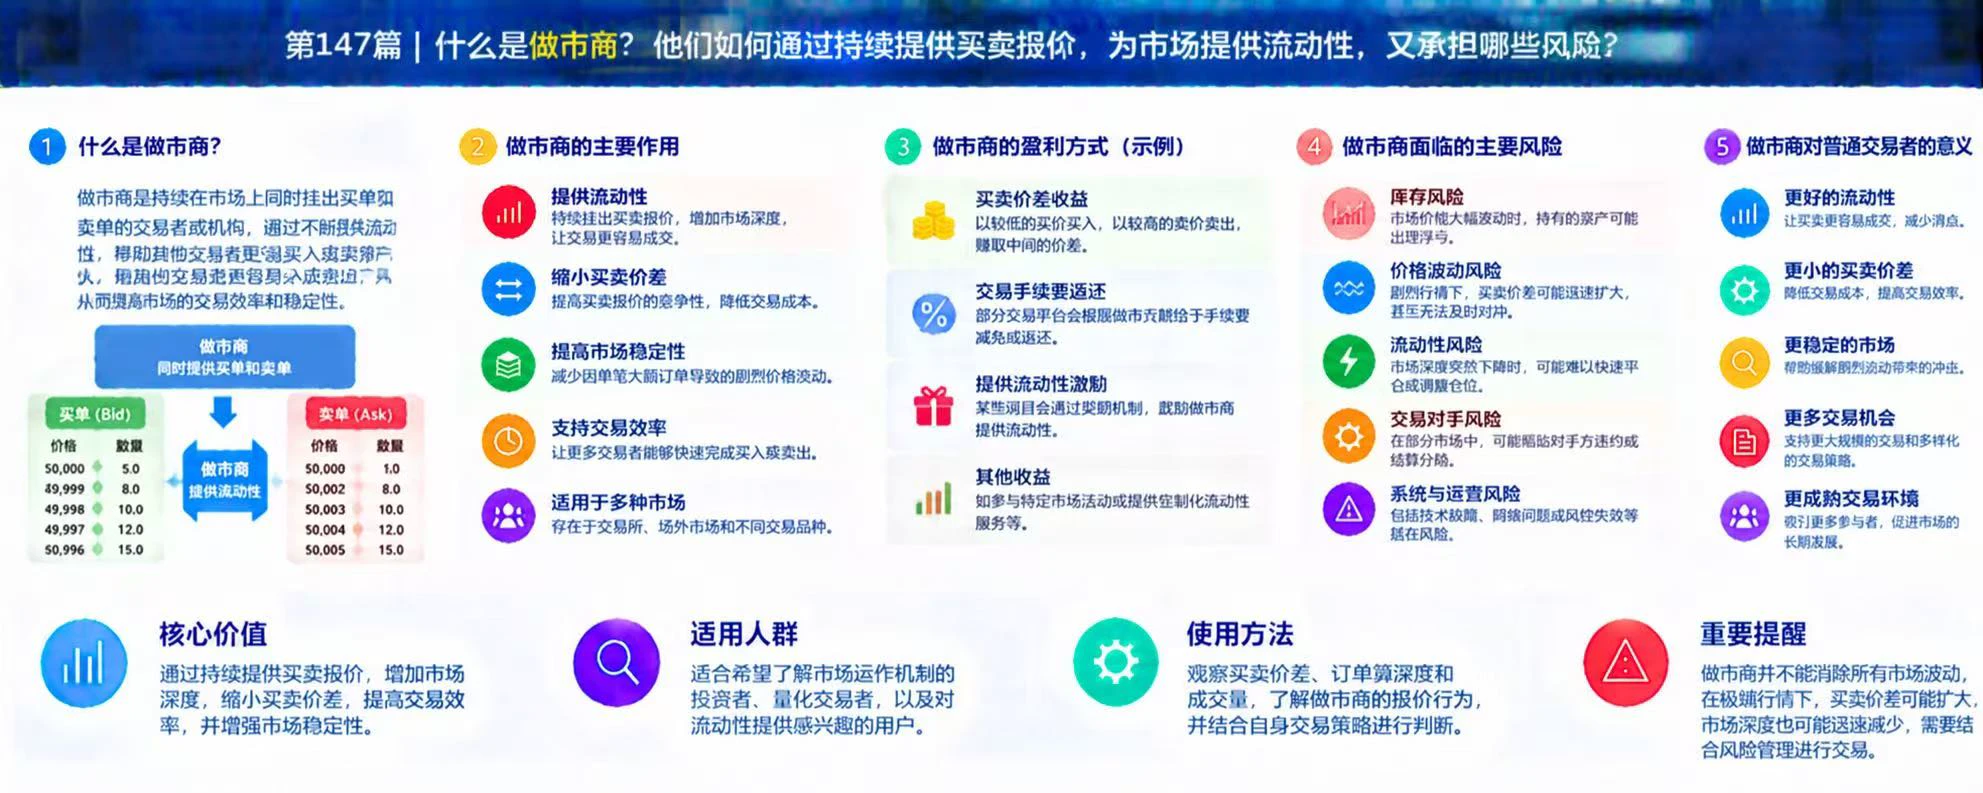
What is a market maker? How do they provide liquidity to the market by continuously offering buy and sell quotes, and what risks do they take on?

In the cryptocurrency market, traders need someone to sell when they want to buy and someone to buy when they want to sell. By continuously offering bid and ask prices, market makers help create more continuous quotes, reduce waiting times for some trades, and improve market liquidity.

First, what is a market maker?

Market makers typically place buy and sell orders in the market at the same time. For example, if an asset has a bid quote of 100 USD
post-image
Intraday trades
② Entered short at 4046, stopped out at 4051, -473 dollars
③ Entered short at 4047, exited at 4043, gained 420 dollars
A sharp morning surge is driving a strong uptrend. Wait for market conditions to stabilize before adding to the position!$XAU #AVAX利好短时上涨6.4% #黄金 ‌
XAU+0.38%
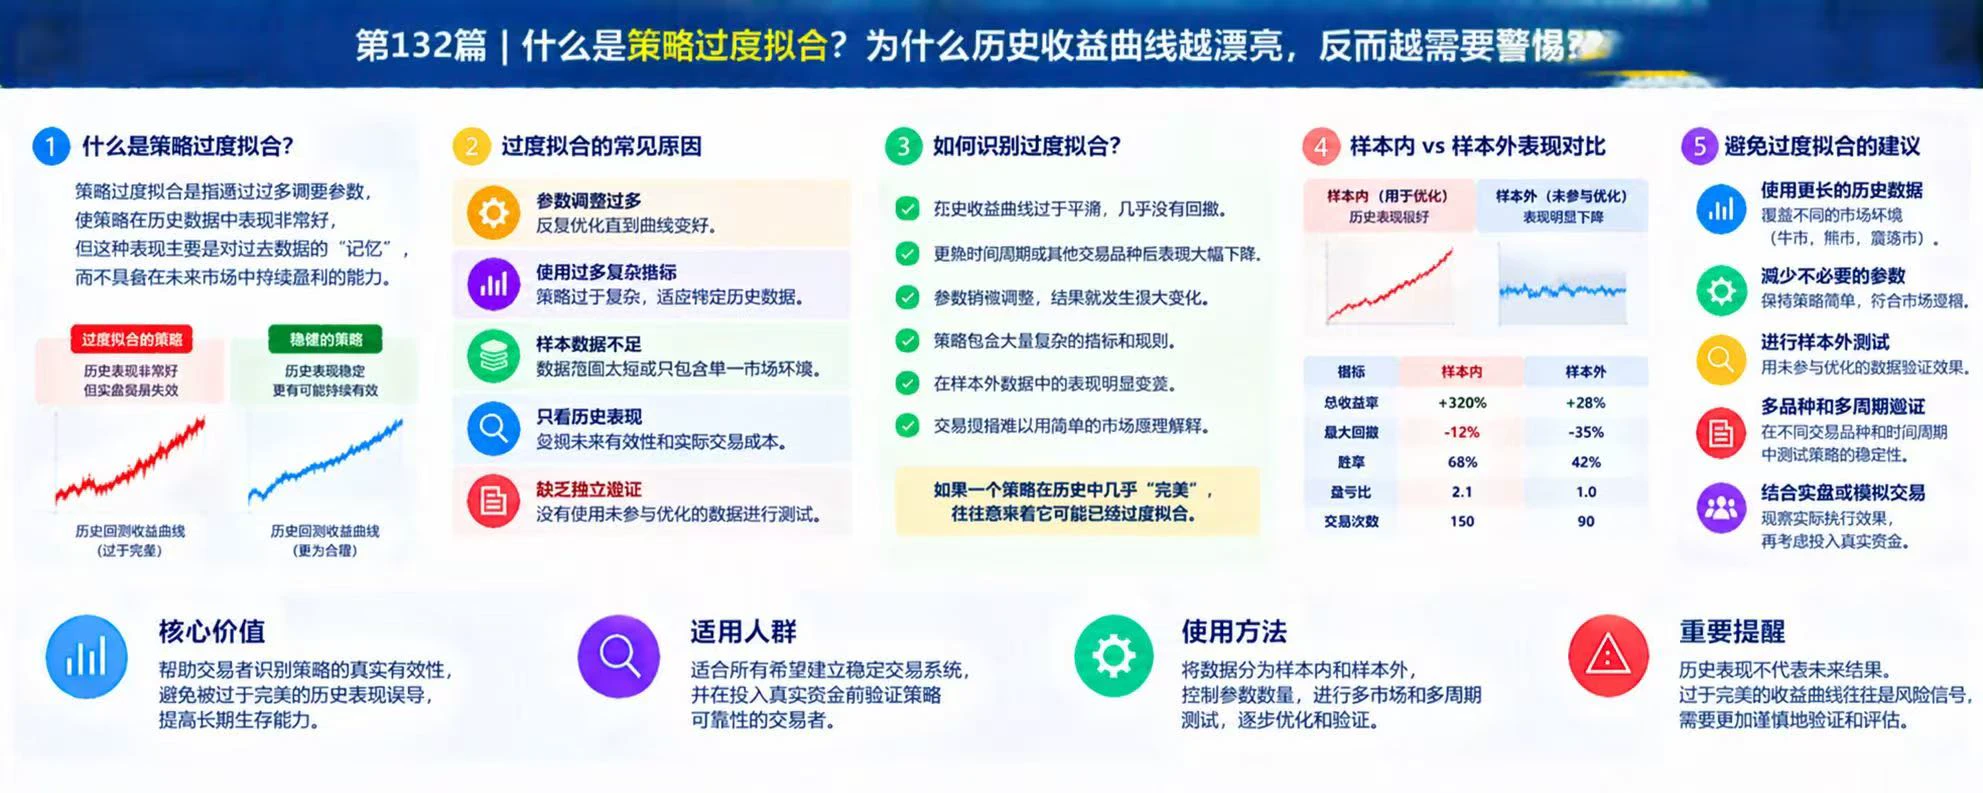
What Is Strategy Overfitting? Why Should We Be More Cautious When the Historical Return Curve Looks Better?

In cryptocurrency trading, some strategies have their parameters adjusted repeatedly until their historical return curves become very smooth and their win rates are high. But once they enter the live market, their performance drops noticeably. This may be strategy overfitting: the strategy has adapted too closely to specific patterns in historical data without learning how to handle future market changes.

First, how does overfitting happen?

Common causes include repeatedly adjusting p
post-image
Why Do False Breakouts Happen So Often? Understanding the Liquidity Dynamics Behind Them

In the cryptocurrency market, many traders have had this experience: the price has just broken through a resistance level, so they immediately go long, only for the market to suddenly reverse and the price to fall back into its previous range. They thought they had caught an opportunity to ride the rally, but ended up buying near the top. This is a common phenomenon in trading known as a false breakout.

Why do false breakouts keep happening?

First, when the market breaks through a key price level, stop-
post-image
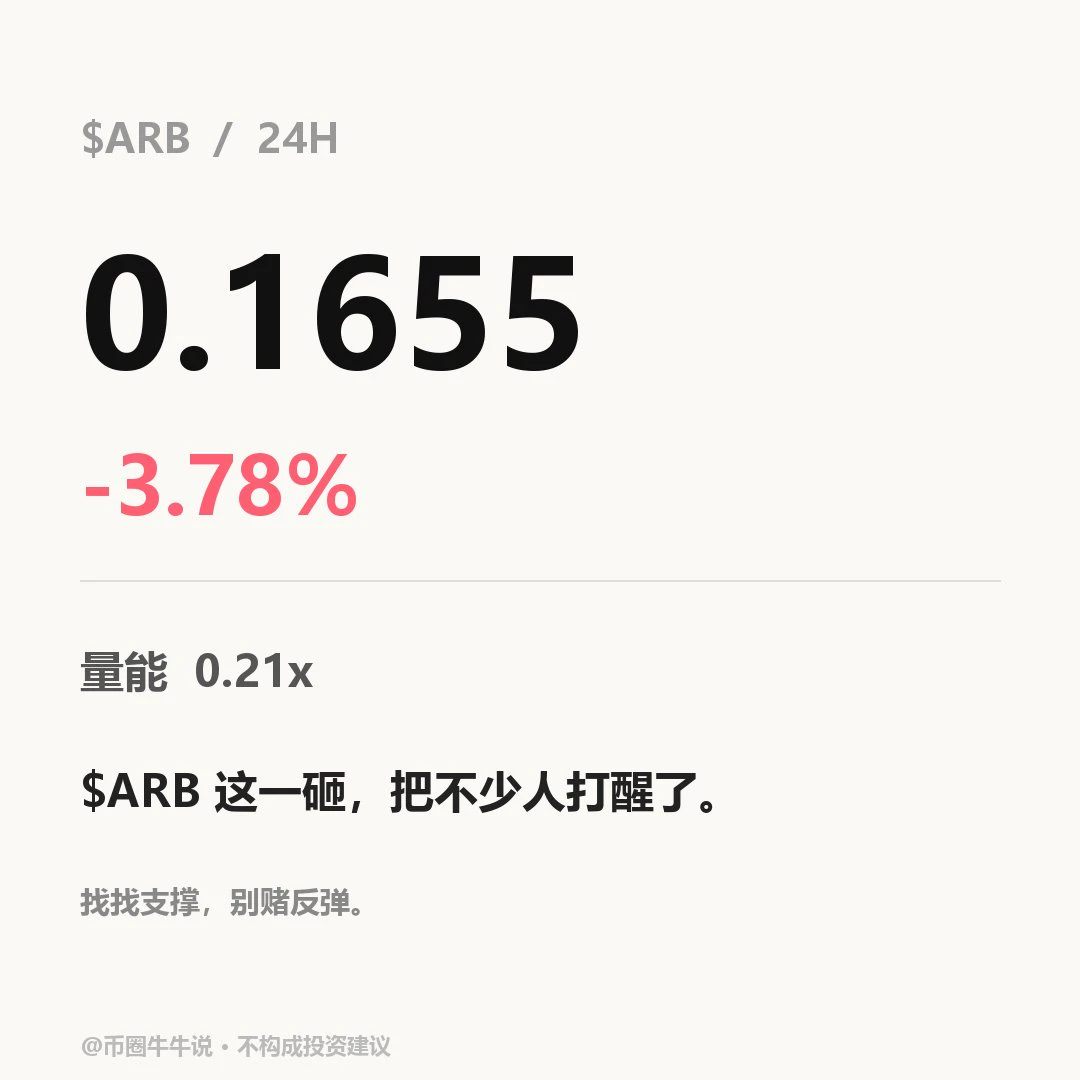
$ARB Currently at 0.1655, 24H -3.78% (range: 0.1558–0.1732). The 1H trend is strong, with an RSI of 53; the 4H trend is weak, with an RSI of 49. If it breaks above 0.1732 convincingly, watch for further upside; if it falls below support at 0.1558, the short-term structure may weaken. Markets are highly volatile; for observation only.
post-image
ARB+1.17%
the face that marked the bottom of the market
post-image
To keep me trapped, the market’s KPIs are maxed out: exchange hacks, an election gone wrong, U.S. stock market circuit breakers, Old Huang rumors, MicroStrategy getting kicked out, and 2.8 billion in selling pressure waiting in the wings. On my side: a salary I can’t hold on to, housing prices I can’t catch up with, ready-made meals that won’t cook through, and a hairline that won’t come back. Where’s the bull? Did the bull get laid off too? $NVDA
post-image
NVDA-5.47%
  • 3
🔹Anthropic IPO Valuation Surges Toward $1.5 Trillion! As AI stocks tumble, the mega IPO keeps getti
live-cover
LIVE1,209
Today’s Gospel Luke 17:7-10 Is a stark reminder that the good works we do, are obliged to do
The point Jesus is making is simple. You have an obligation to follow his commandments and do good works.
Good works don’t earn your place in heaven but failing to fulfill your obligations means you forfeit
heaven.
Jesus repeatedly warns against failing to do the Father’s will.
✝️Matthew 7:21: “Not everyone who says to me, ‘Lord, Lord,’ will enter the kingdom of heaven, but the one who does the will of my Father.”
✝️Luke 6:46: “Why do you call me ‘Lord, Lord,’ and not do what I tell you?”
The New Te
post-image
Despite the broader market's overall decline, $NEAR NEAR has still held its ground over the past few days. It could very well rebound from here.
post-image
NEAR+1.17%
$CRWV Up 15 points in a day, with the 24h low of 46.58 shooting straight to 57.1. This candle isn’t a rebound—it’s a short squeeze. It’s currently at 56.8, just 0.3 below the intraday high. A close above 57 would confirm a breakout above the previous high structure, so I’m turning bullish.

Three technical signals stand out: First, the body of this bullish candle from 46.58 to 57.1 covers the losses of the previous three days—a classic bullish engulfing reversal. Volume at 131M is clearly elevated, so this isn’t a low-volume bounce. Second, 56.8 sits right at the upper edge of a previous high-
  • 7
  • 3
Bad Boy Watch: SPCX Update 11.11

Big Rocket closed at 143.09 in Tuesday’s U.S. stock market, up 0.72%, with an intraday high of 144.89 and a low of 139.16.

Musk has been making moves nonstop lately. As long as the AI narrative continues, SPCX can stay on an upward channel line.

Looking at the candlestick chart, the U.S. stock closed at the 20-day moving average. Any new purchases should wait for the 5-day moving average below to catch up and form a golden triangle with the 10- and 20-day moving averages. This will provide strong support for SPCX’s share price and set it up to reach new high
SPCX+0.72%
Short $NVDA!
Culper Research, a short-selling firm with a historical win rate of up to 65%, publicly disclosed a short position in Nvidia, citing China’s contribution of over 20% of Nvidia’s revenue. If its China business goes to zero, future results will plunge.
post-image
NVDA-5.47%
11.11 XAUUSD Asia-Europe Session Outlook$XAUUSD

Last night's CPI data was bearish, triggering a plunge of dozens of points. For today, first look for an oversold rebound intraday, then consider shorts. Traders focused on the daily and weekly timeframes can consider opening positions here.

Support: around 4015-4028 (4h), 3952-3975 (1day),

Resistance: around 4075 (1h, 4h), 4105-4111 (4h), 4142-4150 (1h, 4h), 4190-4217 (4h), 4256-4280 (1day, 1week)
post-image
XAUUSD+0.39%
$CAKE Major short now, then sell entry at $1.2530: short at $1.8225 $CAKE 🔥
post-image
CAKE+0.58%
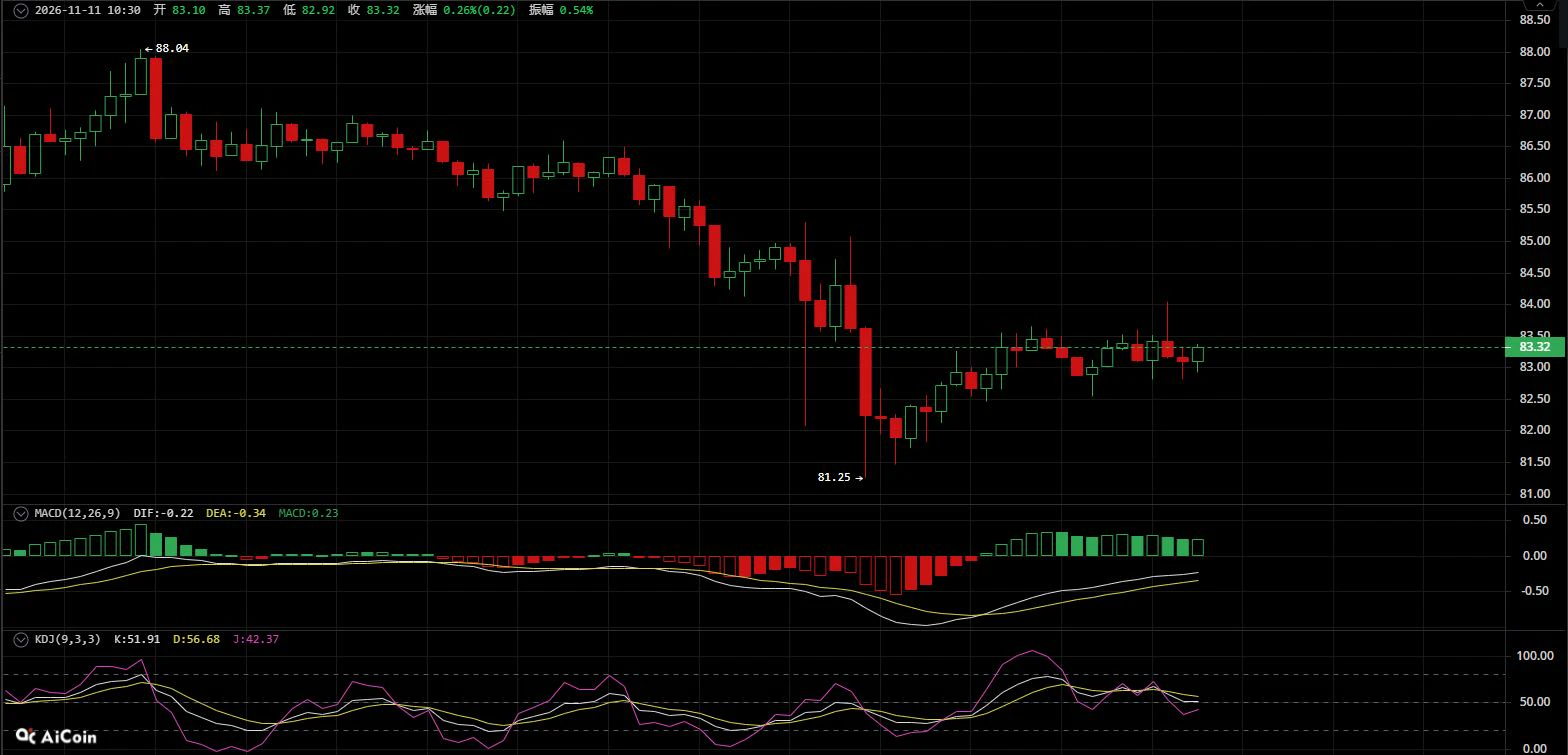
November 11 $SOL : The stair-step downtrend remains intact, and the weak rebound offers an opportunity to short into strength.

【Today's Strategy】
Short entry zone: Position on a rebound to 84.0—84.5
Stop-loss: Above 85.3
Take-profit: Target 82.0—81.5

【Core Rationale】
On the 30-minute chart, a clear stair-step downtrend has formed. After setting a new local low of 81.25, the price managed only a weak rebound, leaving the overall downward momentum intact. The MACD lines have remained in bearish territory below the zero line for an extended period. The red histogram bars associated with this reb
post-image
SOL-0.77%
November 11: ETH's oversold rebound lacks momentum; short with the trend at resistance
Today's outlook
Entry: If the price rebounds to the 2070-2085 range
Stop-loss: 2110
First target: 2040-2030
Second target: 2000-1990.
Key takeaways
Saudi official media outlet Al Arabiya TV reported that the US and Iran reached an initial consensus on uranium enrichment: the US will allow Iran to enrich uranium domestically to a concentration of 3.67%, and Iran has accepted. The two sides will also advance plans for International Atomic Energy Agency inspectors to return to Iran. Expectations of easing geopo
post-image
ETH-1.26%
Load More

Join 40 M users in our growing community

⚡️ Join 40 M users in the crypto craze discussion

💬 Engage with your favorite top creators

👍 See what interests you

Trending Topics

GateGlobalComplianceExpansion

12.05k Views300 Discussing

Gate continues to expand its global compliance footprint, now covering 81 regulated jurisdictions across Europe, North America, Asia, and Oceania. From MiCA and U.S. state-level MTLs to Japan’s FSA, Dubai, and Australia-related regulatory approvals, global exchanges are entering a new stage of compliance competition. Do you think regulatory strength will become as important as products and liquidity for exchanges in the future?

USOctoberCPIBeatsExpectations

78.43k Views2.49k Discussing

AnthropicIPOValuationCouldReach1.4T

9.22k Views1.55k Discussing

View More