






Square
Following
Hot
News
Profile
Share your thoughts
placeholder
Article
#KOSPIJumps3.3% #ShareWeekly
KOSPI Rebounds After a 7.6% Crash: Is the Semiconductor Sell-Off Over, or Is More Volatility Ahead?
The Asian stock market experienced a dramatic shift on October 15–16, 2026, as semiconductor stocks came under heavy selling pressure before staging a partial recovery. South Korea’s KOSPI index suffered a sharp 7.6% decline on October 15, dropping to 5,554 points and triggering a circuit breaker. The index touched its lowest level since April, highlighting how quickly market sentiment can change when inflation concerns, interest-rate expectations, and uncertainty s
SK Hynix+0.79%
JPN225+0.29%
NAS100-0.53%
CXMT-1.78%
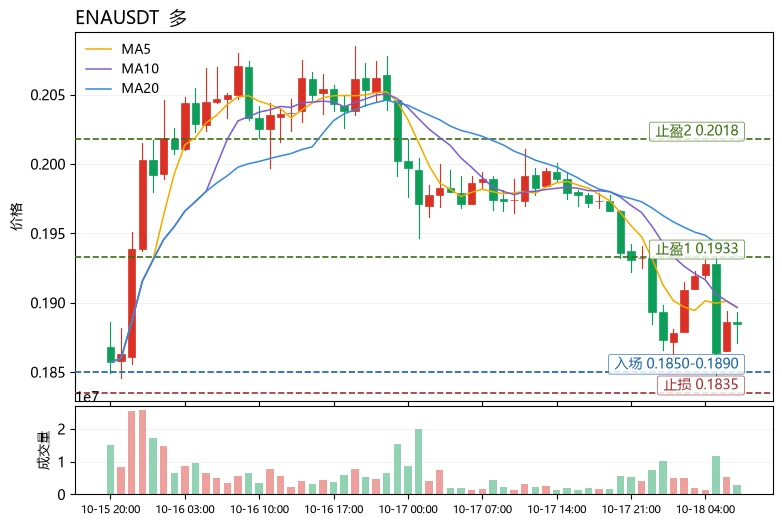
The most unusual detail in today’s market action isn’t the declines themselves, but relative strength: $STRK fell 12.04%, $BAT fell 9.28%, while $ENA
in the same sector fell just 5.23%. Its RSI of 37.4 is also higher than STRK’s 31.3 and BAT’s 36.7. The smaller decline and higher indicator suggest selling pressure has been released more gradually, with funds not rushing for the exits.
But relative resilience doesn’t mean a reversal is underway. ENA is currently at 0.1885, still below MA5=0.18964 and MA20=0.193345, with the bearish moving-average alignment yet to recover. The MACD histogram
post-image
STRK-11.68%
BAT-9.24%
ENA-5.20%
Trenches
AGT
A
bade
b
AGT
0x5d...e274
Market Cap
$.
Change
.
24h Vol
$.
Holders
.
CNPY
C
bade
b
CNPY
0xc6...ddd2
Market Cap
$.
Change
.
24h Vol
$.
Holders
.
COVENANT
C
bade
b
COVENANT
0xcd...de79
Market Cap
$.
Change
.
24h Vol
$.
Holders
.
Q
Q
bade
b
Q
0xc0...0589
Market Cap
$.
Change
.
24h Vol
$.
Holders
.
Gato
G
bade
b
Gato
55A3...pump
Market Cap
$.
Change
.
24h Vol
$.
Holders
.
Strong rebound in the main FVG zone on the 1-hour chart, with a pullback expected to the main liquidity area around $0.255–$0.260. ‼️Long $GTC Entry price: 0.235 - current price Take profit: 0.257 Stop loss: 0.215 Trade here $GTC 👇
post-image
GTC
GTC芝麻币
Gate.Fun
MC:$0.1Holders:1
0%
#GateBTCAndETHFuturesVolumeRanksTop3
Gate BTC and ETH Futures Trading Volume: Can the Momentum Continue?
In my view, the momentum Gate is seeing in the derivatives market could persist; however, sustainable growth depends on whether this increased trading activity is driven by lasting demand rather than mere short-term speculation.
The reported figures are encouraging: with BTC and ETH in an uptrend, Gate ranks among the top three exchanges globally for futures trading volume in both assets, with BTC futures volume reaching approximately $7.18 billion over a 24-hour period.
Nevertheless, high
BTC-0.21%
ETH-0.88%
GT-3.58%
XTIUSD+2.67%
TSLA-2.17%
  • 4
#DOGE DOGE ETF switches from consecutive net inflows to redemptions! Can the $0.08 support hold?
Dogecoin fever cools! ETF funds flee, with $0.08 becoming a crucial line in the sand🐶
Once wildly popular Dogecoin (DOGE) is now facing a subdued market atmosphere. Dogecoin ETFs had previously seen three consecutive weeks of inflows, but the trend completely reversed in October as institutional funds began to pull out, putting considerable pressure on the price.
📉ETF funds see $540k in outflows over two days.
According to SoSoValue data, spot Dogecoin ETF flows were virtually flat from October 1
post-image
ThisIsTranslateContent:
#DOGE DOGE ETFs switch from consecutive net inflows to redemptions! Can the $0.08 support hold?
Dogecoin hype cools! ETF funds flee, with $0.08 becoming a make-or-break line🐶
Dogecoin DOGE, once hugely popular, is now facing a subdued market atmosphere. Dogecoin ETFs had previously seen three consecutive weeks of inflows, but the trend completely reversed in October as institutional funds began to pull out, putting significant pressure on the price.
📉ETF funds see $540,000 in outflows over two days.
According to SoSoValue data, from October 1 to 9, flows in and out of Dogecoin spot ETFs were virtually flat, with no funds entering or leaving. Instead of a turnaround, a wave of redemptions followed. Around $400,000 flowed out on October 12, followed by another $138,600 on the 13th, bringing total outflows to $540,000 in just two days.
Fund net assets also shrank from nearly $17 million at the start of the month to $14.44 million. The retreat of institutional funds is a major headwind DOGE must now face.
📊The price continues to weaken, with bearish technical indicators.
DOGE is down 14% overall this month. It was still holding at $0.095 at the start of the month, but slid steadily after October 7 and is now trading at around $0.0800.
Although it briefly rebounded to a high of $0.088 on the 12th, the recovery was short-lived, and the price quickly fell again, touching a low of $0.08. Technical indicators are also unpromising: the RSI has fallen below its signal line, while the CMF money flow indicator briefly dropped to near -0.90 and has now recovered to -0.30, indicating that the overall trend of capital outflows remains unchanged.
⚖️Futures market sees a tug-of-war between bulls and bears, with bullish positions weakening.
Signals from the derivatives market are mixed. DOGE open interest first surged to $652 million, then fell to $598 million before edging back up to $609 million. The funding rate remains positive at 0.0088%, indicating that the market still retains some long positions, with bulls continuing to pay fees to bears. However, the overall decline in open interest means bullish momentum in the futures market is weakening.
📌Market Summary and Key Points to Watch
$0.08 is a key short-term support level for DOGE. If it breaks decisively below this level, pressure on bulls will intensify sharply, and the price could fall further. The market is currently weak overall, and the rebound lacks strength, so it is unwise to blindly buy the dip. Watch closely to see whether the $0.08 support holds.#WCTCS9

repost-content-media
DOGE-1.74%
Fees paid to apps on Filecoin rose 68.34% in the past 30 days to $111,353. GLIF, the network's largest app by fees, took in $91,398 of it, up 47.76% over the same window.
@Filecoin
FIL-6.75%
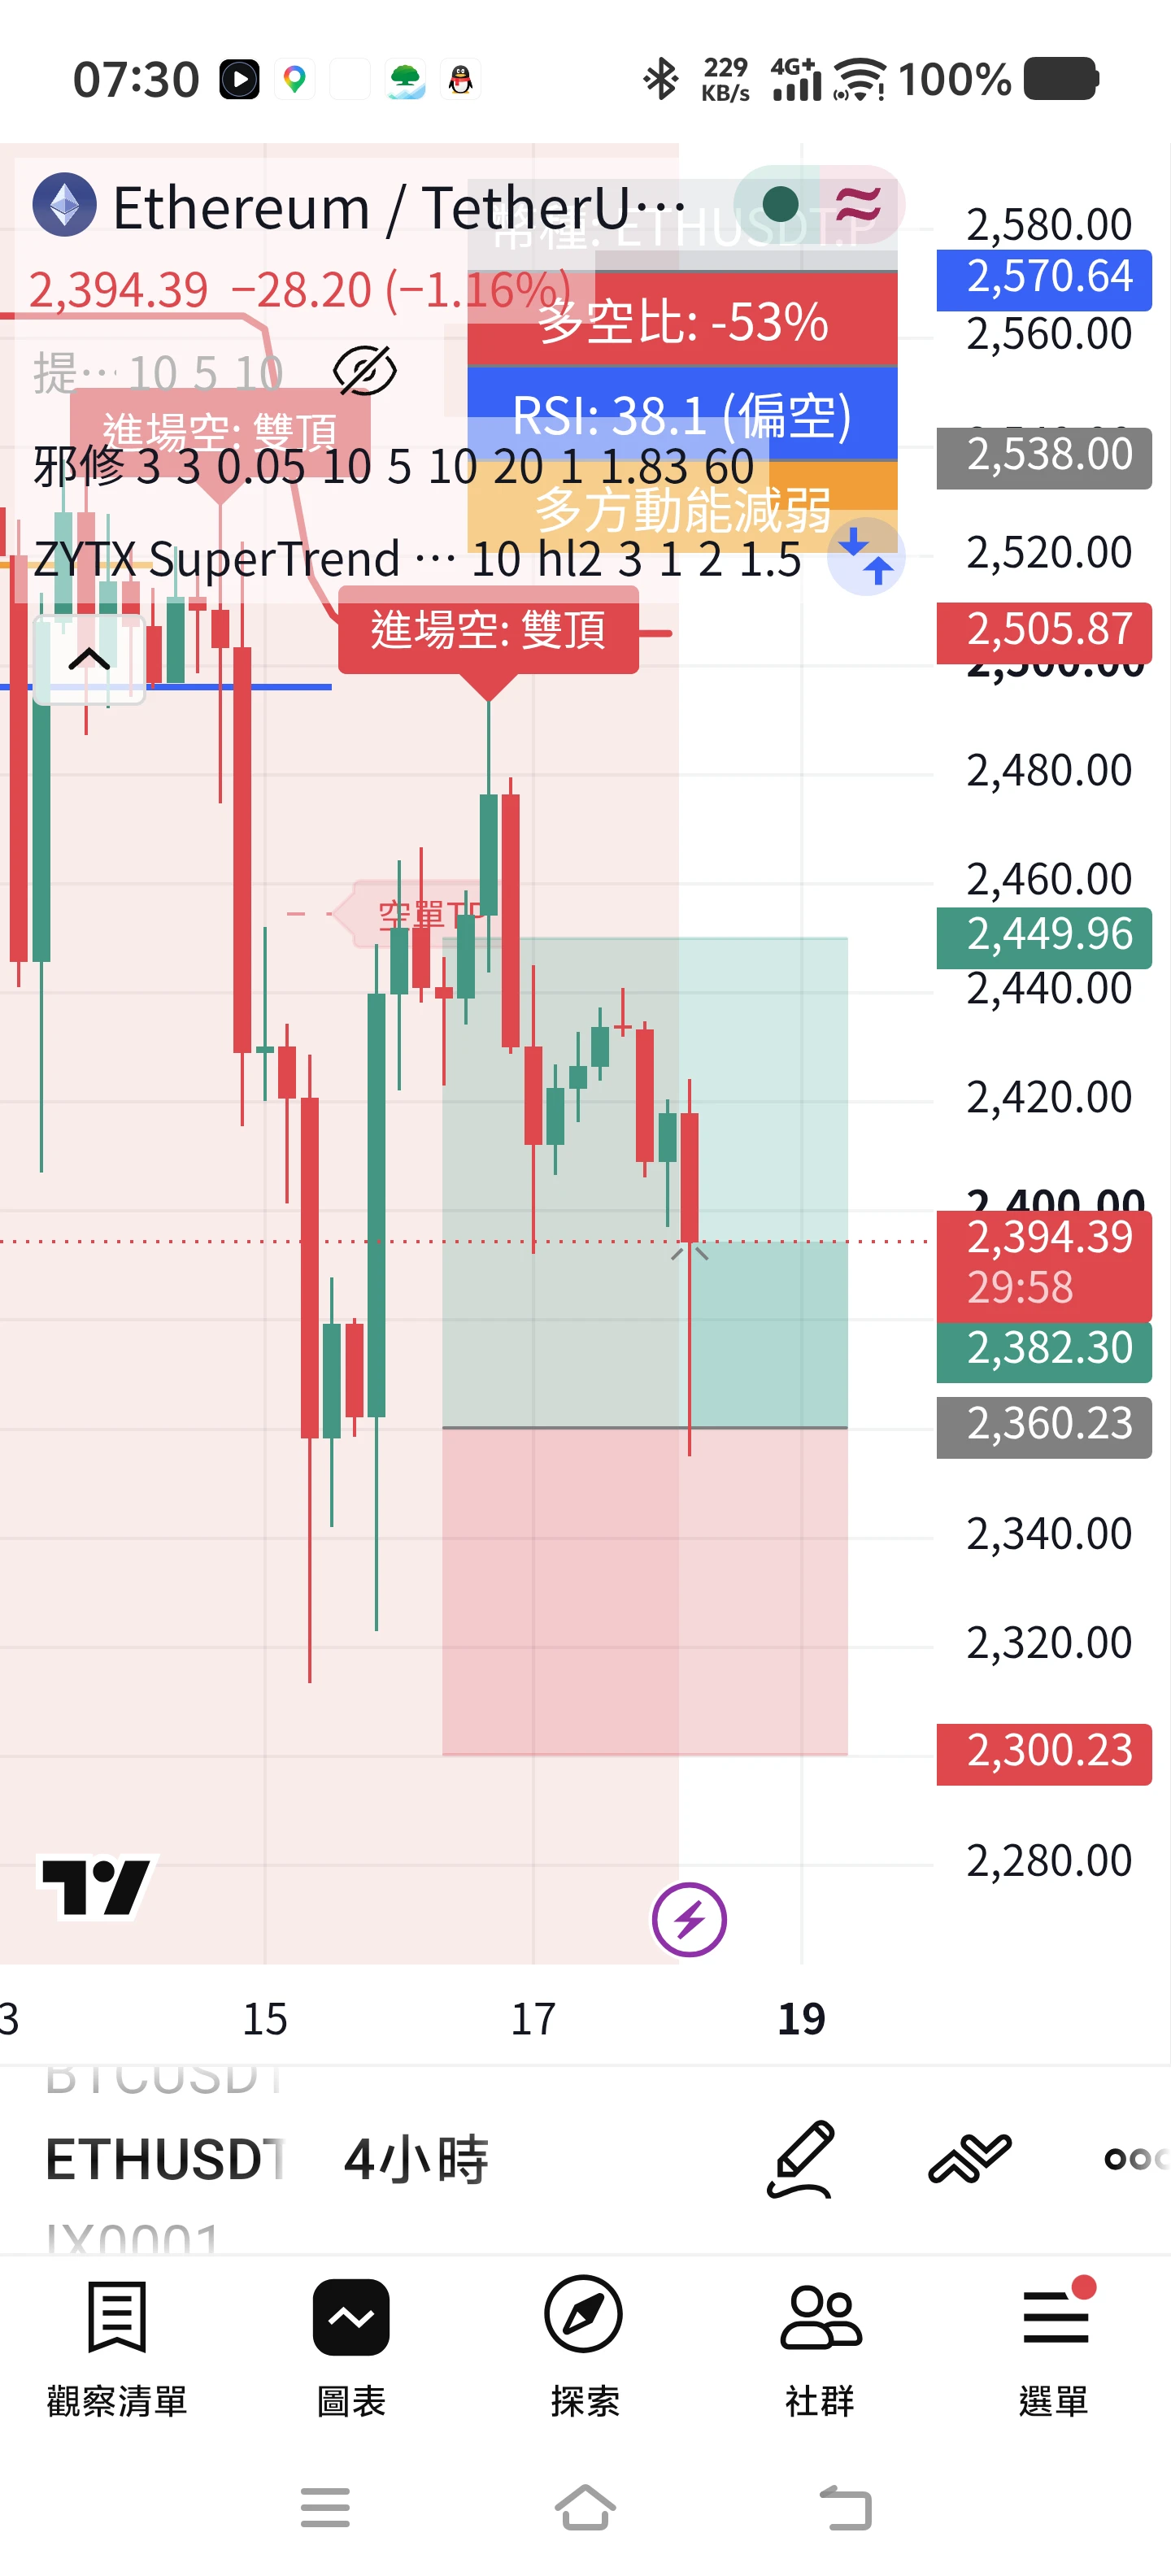
Planning to open the next trade at 2360 with a 1:1.5 risk-reward ratio
post-image
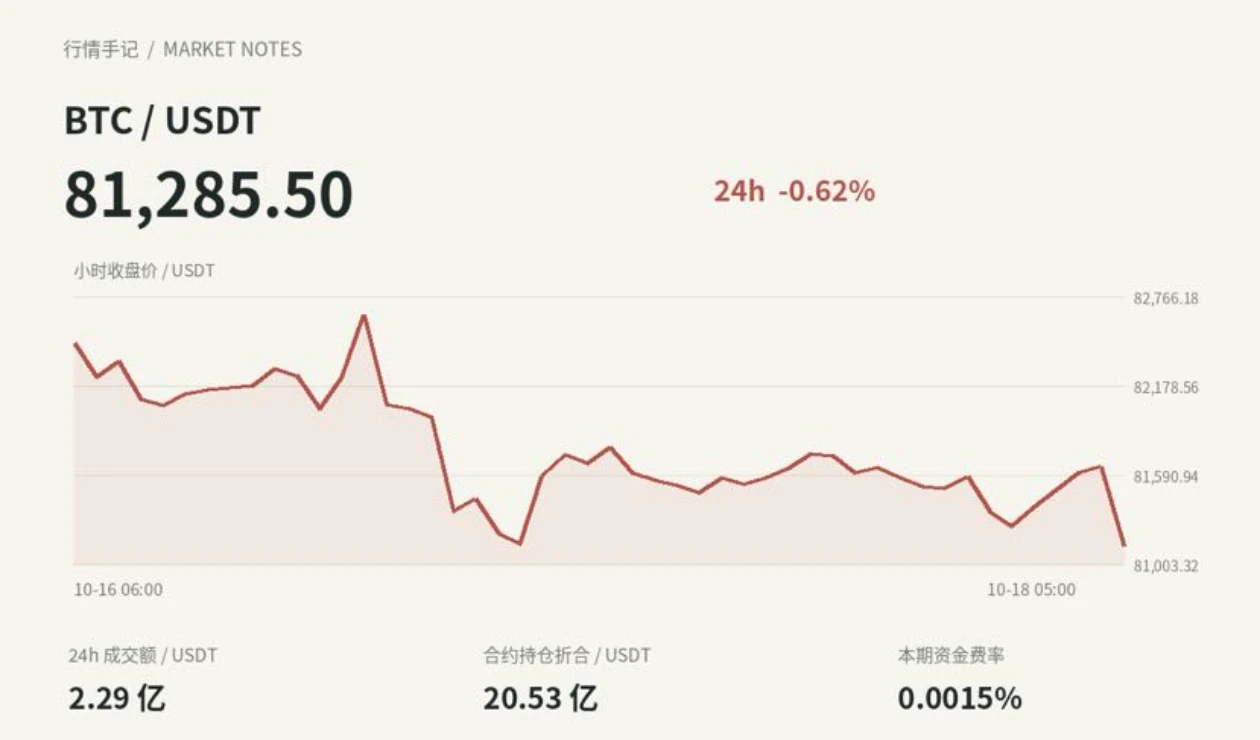
BTC down 0.62% in 24 hours, $31.89 million dumped in the final hour
Gate spot BTC/USDT is currently quoted at 81285.5 USDT, down 0.62% over 24 hours, with a high of 81818.4 and a low of 80817.0. That 0.62% is almost negligible on the daily chart, but the final hourly candle was different: it opened at 81647.1, plunged to a low of 80817.0, and closed at 81124.9, with 31.89 million USDT in single-hour trading volume—more than three times the previous hour’s roughly 8.71 million.
What concerns me more is whether this drop was backed by volume. Looking at the latest 48 hourly candles, the volume p
post-image
BTC-0.21%
$CT I took the full -12.73% hit on this move: entered at 0.385, cut at 0.34, down 11 points. The post-mortem is simple: greed. Before the Fed minutes, I clearly saw $CT 24h volume shrink to just over 20M and large on-chain transfers start flowing out, but I still fantasized that dovish minutes would spark a rally. Instead, the minutes were hawkish, and $CT plunged straight through 0.35, hitting a low of 0.3155. I set my stop at 0.34 and at least stuck to my discipline, but the entry thesis itself was wrong—loading up on a small-cap token ahead of a macro event; correlation is no excuse, I was
CT-14.32%
The morning sunlight shines on the flower’s center,
making it especially radiant.
May your mood bloom like a flower
🐷🐷🐷🐷
post-image
2015 — Buy
2016 — Hold
2017 — Sell
2018 — Bear market
Cycle 3 (2019-2022)
2019 — Buy
2020 — Hold
2021 — Sell
2022 — Bear market
Cycle 4 (2023-2026)
2023 — Buy
2024 — Hold
2025 — Sell
2026 — Bear market ← We are right here
Cycle 5 (2027-2030)
2027 — Buy
2028 — Hold
2029 — Sell
2030 — Bear market
post-image
  • 1
#DOGE #WCTCS9 Dogecoin May See Its First Major Daily Death Cross of 2026: Is a Potential Trend Reversal Coming?
A potential trend reversal could offset bearish pressure and invalidate the current pattern.
Dogecoin could see its first daily death cross of 2026 as moving averages suggest they will converge in the coming days. The daily 50-day moving average is currently trending downward, while the daily 200-day moving average is flattening, highlighting the potential for a death cross. Dogecoin saw its first daily golden cross since 2026 in October, but profit-taking in the crypto market drove
post-image
ThisIsTranslateContent:
#DOGE #WCTCS9 Dogecoin may see its first major daily death cross of 2026: Is a potential trend shift approaching?
A potential trend shift could counter bearish pressure and invalidate the current setup.
Dogecoin could see its first daily death cross of 2026, as moving averages point to convergence in the coming days. The daily 50-day moving average is currently sloping downward, while the daily 200-day moving average is flattening, highlighting the potential for a death cross. Dogecoin saw its first daily golden cross of 2026 in October, but profit-taking in the crypto market drove its price down to a low of $0.077. Bears seem to be making an aggressive effort to negate this bullish signal, with the possibility of a death cross drawing near.
The timing of a death cross remains uncertain, as a trend shift could counter the bears’ push and invalidate the current pattern. At the time of writing, Dogecoin was up 3.19% over the past 24 hours to $0.081, after briefly selling off as investors weighed higher-than-expected inflation data and the latest remarks on interest rates from Fed Chair Kevin Warsh.
Inflation data released this week was strong: the Producer Price Index released Thursday showed wholesale prices rose 6.3% year over year in September, the biggest increase since 2022. The Consumer Price Index also rose in data released Wednesday. Fed officials responded in September by approving the first rate hike in more than three years; markets expect the Fed to hold rates steady in October and hike again in December.
Could a trend shift be coming? The last time Dogecoin saw a death cross on the daily chart was in November 2025, followed by months of selling until a golden cross appeared recently. This has focused market attention on price action in case a death cross ultimately appears again.
Crypto analyst Ali recently posted a contrarian take on X, sharing three reasons to be bullish on Dogecoin.
First, the TD Sequential indicator has previously marked potential turning points for Dogecoin several times, and this time it issued a buy signal on the daily chart as the price neared $0.081.
Second, URPD data shows that about 36 billion DOGE previously traded near $0.081.
Third, whales appear to be buying near this support level, having accumulated 600 million DOGE since October 12.
If $0.081 holds and Dogecoin rebounds, Ali identifies the $0.16 to $0.17 range as a potential profit-taking zone. $DOGE
repost-content-media
DOGE-1.74%
#美股存储板块跌幅扩大 #ShareWeekly
U.S. Tech Selloff Deepens: Is the AI Boom Facing a Credit Reality Check?
The latest U.S. technology selloff is revealing a deeper problem than expensive stock valuations. Investors are increasingly questioning whether the enormous investment in artificial intelligence infrastructure can generate enough cash flow to justify its financing costs. This shift makes October’s correction fundamentally different from the July pullback.
1. July vs. October: Two Different Market Risks
In July, concerns centered on rising AI capital expenditure, crowded semiconductor positions,
QQQ-2.50%
SOXX-4.13%
SPX500-0.36%
US500-1.06%
CRWV-11.90%
Money is already piling in to assets pre-market, have they forgotten how these external markets operate? Its about to get very violent.
Hyperliquid, slaughter house edition.
post-image
HYPE-2.59%
EIA data determines the short-term direction of crude oil
live-cover
LIVE331
The bull market is coming, bro 🥹🥹 I relate so much ahhhh $HYP l $ASTER l $SUI holders
post-image
SUI-3.27%
  • 1
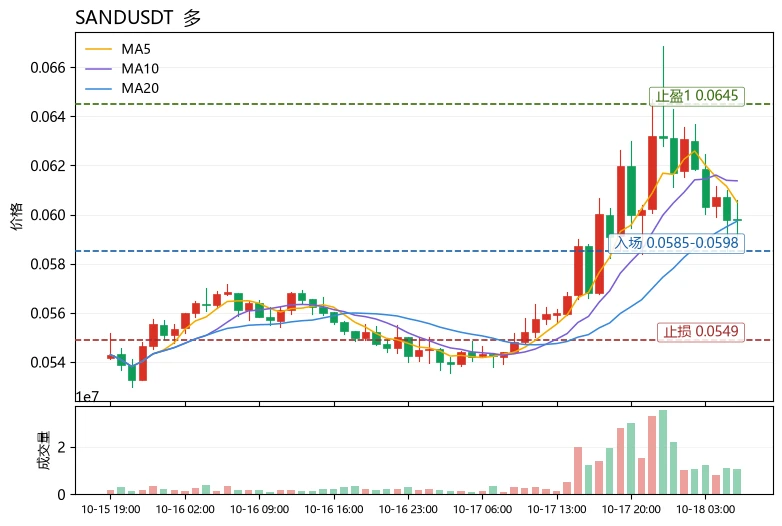
$SAND Bottom line: Short-term bias is bullish, but this is a short squeeze driven by crowded shorts, not a trend reversal. Wait for a pullback confirmation before chasing higher.
The funding picture is the key factor right now. The funding rate is -0.1930%, making it extremely costly to hold short positions, while the price has risen 9.97% over 24h to 0.05978, indicating that shorts are being squeezed and funding is being pushed toward the long side. But beware: the MACD histogram remains negative at -0.00023, and the RSI is only 52.7, so momentum is unconfirmed; the range over 30 candles is a
post-image
AVAX-1.67%
Load More

Join 40 M users in our growing community

⚡️ Join 40 M users in the crypto craze discussion

💬 Engage with your favorite top creators

👍 See what interests you

Trending Topics

USSeptemberPPIBeatsExpectations

91.35k Views1.93k Discussing

US September PPI came in at 6.3% YoY, well above the 5.3% market expectation, pointing to renewed producer-side inflation pressure. Weekly jobless claims were 199K, broadly in line with forecasts. Could hotter inflation further reduce room for rate cuts, and what does it mean for $BTC, US stocks, and gold?

GateWCTCS9GlobalTradingCompetition

37.87k Views6.68k Discussing

GateBTCAndETHFuturesVolumeRanksTop3

53.8k Views1.81k Discussing

View More