Square
Following
Hot
News
Notifications
Profile
Share your thoughts
placeholder
Article
Why Did Bitcoin Drop to $76,000 So Fast?
Bitcoin volatility surged tonight (November 5), swinging from $75,000 to $81,000 before retreating to $76,200 at the time of writing.
Think of this crypto market selloff like a chain reaction on a bridge. When a few heavy trucks start shaking and trigger the weight sensors, everyone bolts for the exit. That panic accelerates the price drop rapidly.
⚠️ Personal market analysis only. NFA — manage risk and DYOR.
Educational content, not investment advice or a recommendation to buy, sell, deposit, or withdraw any asset. No paid promotion or referral/affilia
post-image
BTC-0.67%
$BTC Testing The Neckline Of AKA Trigger Line Of The Head & Shoulder Reversal Pattern
A breakdown below will activate the target and lock it in.
NFA, DYOR ⚠️
#Crypto #Trading #BTC
post-image
BTC-0.67%
Trenches
ZIG
Z
bade
b
ZIG
0x8c...1145
Market Cap
$.
Change
.
24h Vol
$.
Holders
.
BTC
B
bade
b
BTC
C5xp...pump
Market Cap
$.
Change
.
24h Vol
$.
Holders
.
STONK
S
bade
b
STONK
6GmA...UNgx
Market Cap
$.
Change
.
24h Vol
$.
Holders
.
José
J
bade
b
José
87CQ...1UJT
Market Cap
$.
Change
.
24h Vol
$.
Holders
.
IDOL
I
bade
b
IDOL
0x3b...ab07
Market Cap
$.
Change
.
24h Vol
$.
Holders
.
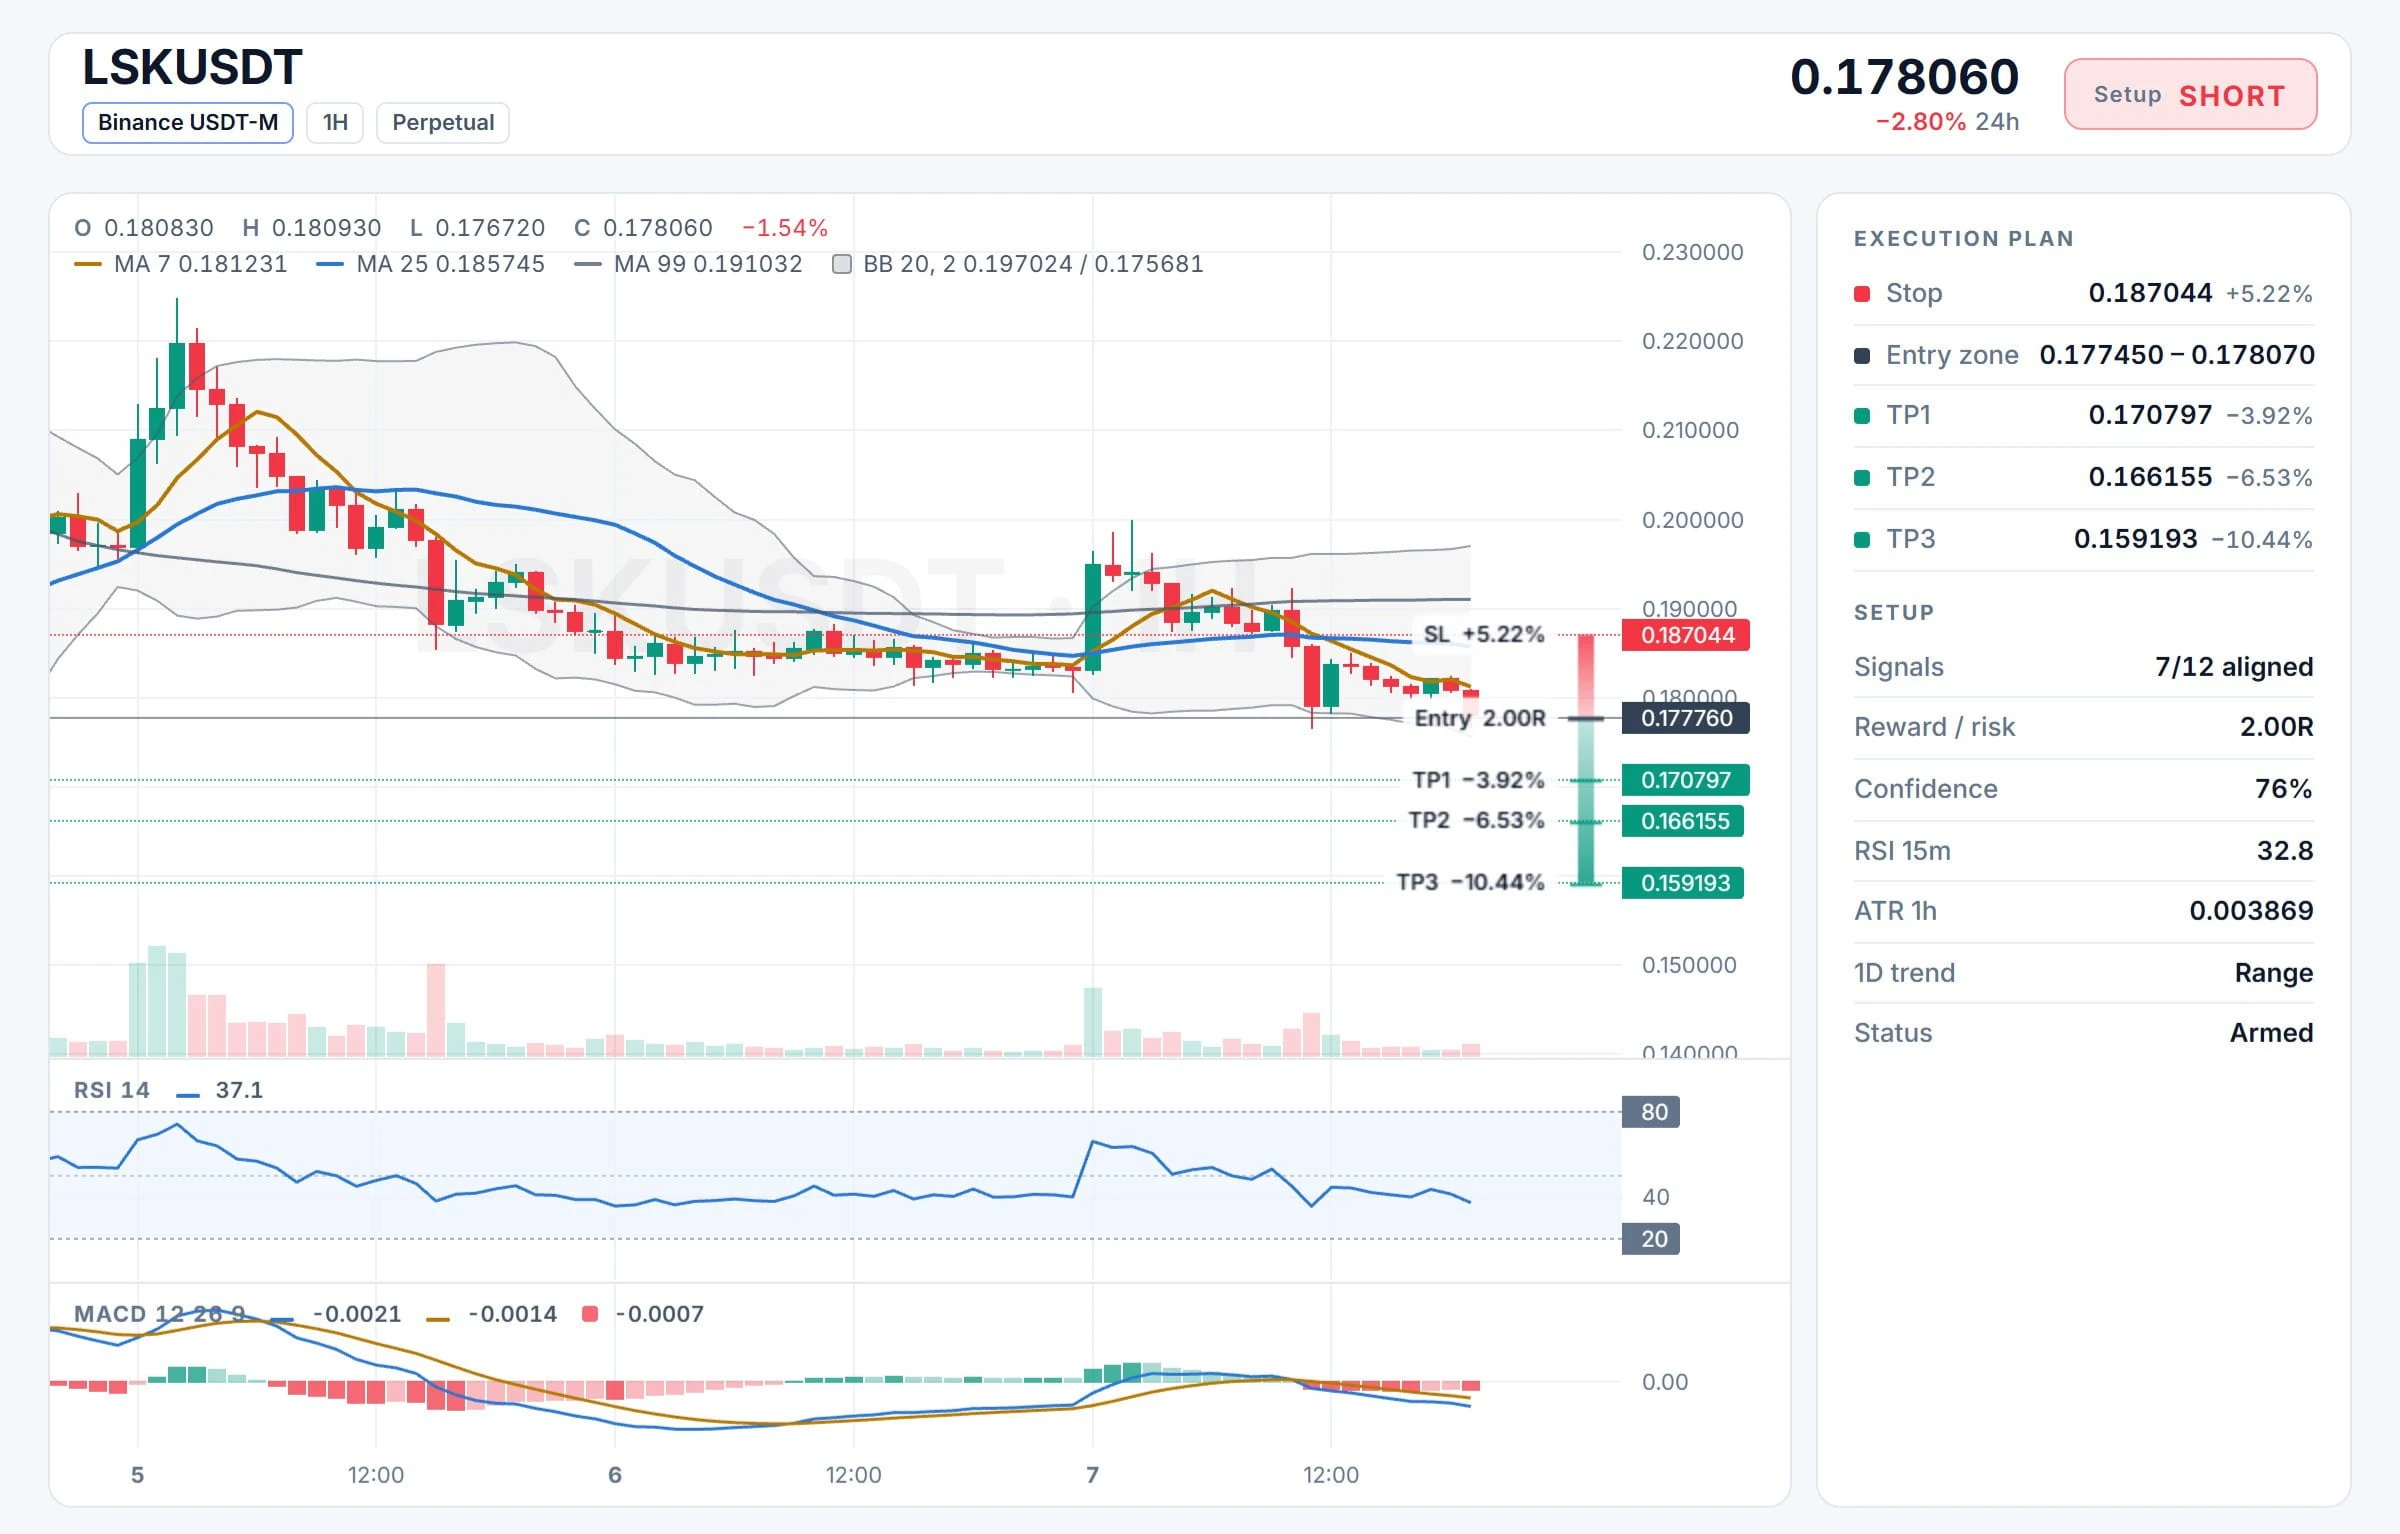
$LSK /USDT BREAKDOWN CONTINUES Clean Sell Signal

$LSK /USDT

Direction: SHORT

Entry Zone: 0.177450 – 0.178070

Stop Loss: 0.187044

Targets:
TP1: 0.170797
TP2: 0.166155
TP3: 0.159193

LSK rejected from the recent bounce high near 0.195 and is now trading below MA7 (0.18123), MA25 (0.18575) and MA99 (0.19103) a full bearish MA stack. Price just broke down sharply from the consolidation right at current levels, confirming sellers back in control.

$LSK ‌
post-image
LSK-5.22%
The real power brokers in the climate policy game have never been at the ballot box. The agenda laid out in 1985 has carried through to today, with NGOs as the capillaries, tax-exempt funding as the blood, and feedback loops growing ever tighter. Ordinary people see only the emissions figures, not who’s making the rules. No need to jump to conclusions just yet—let’s see how things unfold.
post-image
$LYN It surged to 0.0313 within 24 hours, then got slammed back to 0.0258. That spike has the accounts of anyone who chased the top smoking. The 9.98% gain looks cheerful, but the intraday range hit 41%. What does the 85.6M in trading volume tell us? The big players distributed some tokens above 0.03, and now the price is stuck in the middle, with both bulls and bears testing the waters.
I checked the on-chain data: open interest in futures surged before this rally—a classic leverage-driven move, not one built on spot buying. What is this structure most vulnerable to? Hawkish Fed minutes. Last
LYN-0.44%
BTC-0.67%
Crypto Market update
live-cover
LIVE68
DANGCEM
We hit a new ATH of ₦1,490/share and got a nice rejection. Right now, what I’m seeing looks like profit-taking.
What do I see on the chart? I’m watching two regions.
₦1,154.80–₦1,192.20/share. This is the first zone I’m watching. If it holds, I see it as a decent region to start building a position.
₦1,000/share. If the first zone fails to hold, the next bus stop I’m watching is the ₦1,000 psychological level. If we get there and the bulls defend it, that’s where I’ll bring out the bazookas.
Both zones look beautiful to me. After the run DANGCEM just had, I want to see where the buyers
post-image
  • 1
Crypto market: Long-term holder supply share—are old wallets accumulating or distributing? Bull-to-bear transition: old coins stay put, or even continue accumulating. Bear-to-bull transition: old coins start moving to exchanges in large amounts. When veterans distribute, newcomers are celebrating—this is what defines a cycle top. ③ Exchange balances: falling balances = coins being withdrawn (accumulation); rising balances = preparing to sell. Note: ETF/institutional custody can distort this metric, so compare like with like. ④ Stablecoin total market cap: the market’s “ammunition reserve.” Exp
post-image
BTC-0.65%
ETH-1.23%
Sort all market action into four scenarios, and naked-candlestick trading becomes simple. The market may change in a thousand ways, but fundamentally it follows only four patterns. Once you recognize which one is playing out, the right move becomes automatic. Scenario 1: Breakout (the start of a trend) Characteristics: Price breaks through a key level on high volume, with a large-bodied candle closing beyond it. Approach: Don’t chase the first candle; wait for a retest that holds, then enter. Stop-loss: Just inside the breakout level. Trap: A breakout on low volume is probably false. Scenario
post-image
BTC-0.65%
Price Action Essentials: How to Read One Candlestick and Align Three Timeframes 1. First, dissect a candlestick: four prices, four kinds of information. Open: the handoff point reflecting the result of yesterday’s battle between bulls and bears. High/low: who tested the waters and who pushed them back. Close: the verdict on who won the battle—the closing price is always the most important. Wick length: the degree of rejection. The longer the wick, the less conviction in that direction. The same large bullish candle: closes at the high → strong, likely to continue tomorrow; closes in the middle
post-image
BTC-0.65%
ETH-1.23%
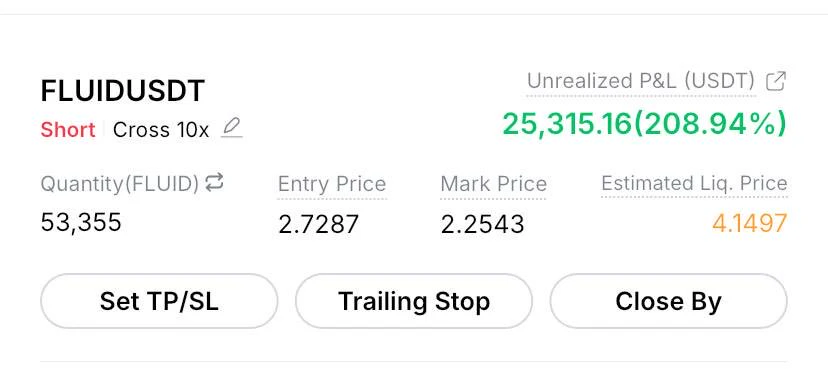
$FLUID approaching target now
Join our telegram channel for live trades
post-image
FLUID-1.92%
Is the era of dirt-cheap housing really about to arrive?
post-image
A bull market unfolds in three stages in chronological order, and the people fooling you are different at each stage. Stage 1: Recovery (the longest and most grueling). Prices move sideways near the lows for 3-6 months, with volatility narrowing until it drives you crazy. Every time the price rebounds to the same level, it gets slammed back down, forming a “ceiling.” Bad news comes out and prices no longer plunge—negative news losing its impact is the first real signal. On-chain: long-term holders start accumulating, and exchange balances slowly decline. This stage has no rush of excitement. M
post-image
BTC-0.65%
ETH-1.23%
Naked candlestick trading is not “ignoring indicators”; it’s trusting price itself. 1. Naked candlestick trading looks at only four things: Structure: Are highs and lows moving higher (uptrend) or lower (downtrend)? Location: Is price at support or resistance? If it’s in the middle of a range, stay out. Momentum: Candle body size, wick length, and continuity. Confirmation: After a signal appears, does the next candle confirm it? 2. First, recognize three single-candle patterns. Large body (almost no wicks): one side has won decisively; trade in the direction of the move. Long lower wick (hamme
post-image
BTC-0.65%
ETH-1.23%
High prices continue to erode purchasing power, and US consumer confidence remains weak.
live-cover
LIVE42
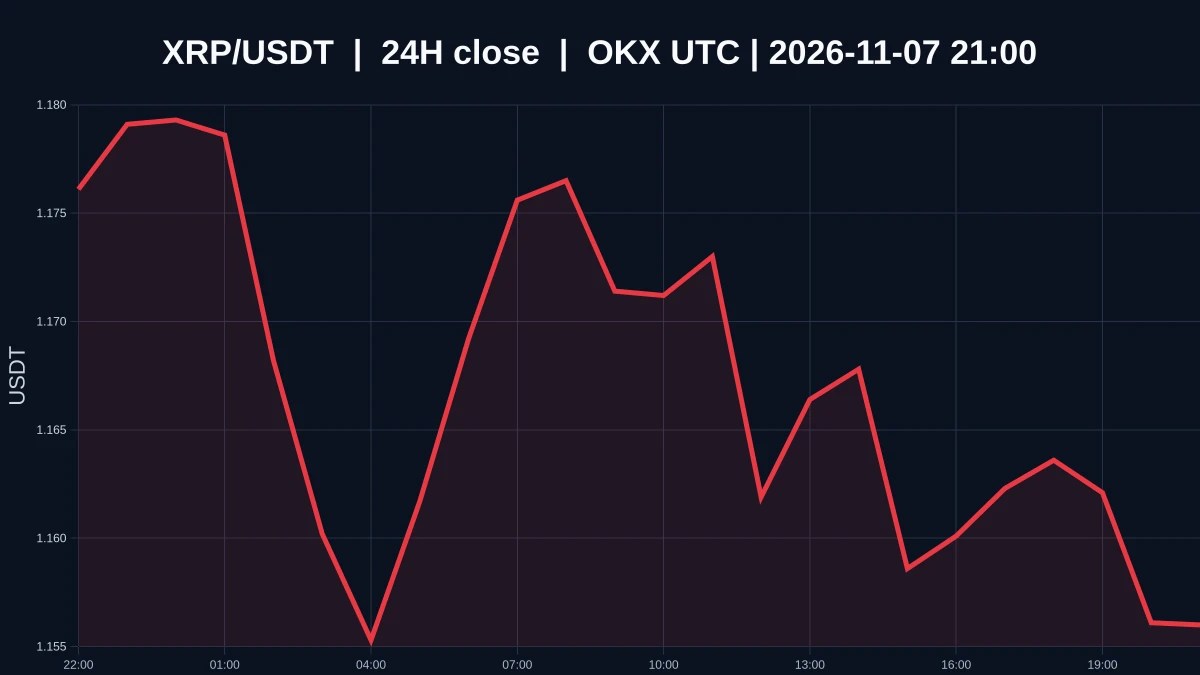
$XRP Is Weak on Low Volume at 1.1567. What’s Still Missing Between Oversold and a Bottom?
$XRP is currently priced at 1.1567, down about 1.44% over the past 24 hours, with an intraday low of 1.151 and high of 1.1853. The 1-hour and 4-hour trends are both weak, and the volume ratio is around 0.0429, indicating low market participation. Oversold describes a condition; a bottom is a confirmed outcome. A steep decline only shows that selling pressure has occurred. It does not automatically mean the price is cheap, much less prove that buyers are actually defending the area around 1.151. Demand for
post-image
XRP-1.15%
Why do you have to add “meow” to the end of everything you say? What are you even meowing about?!
post-image
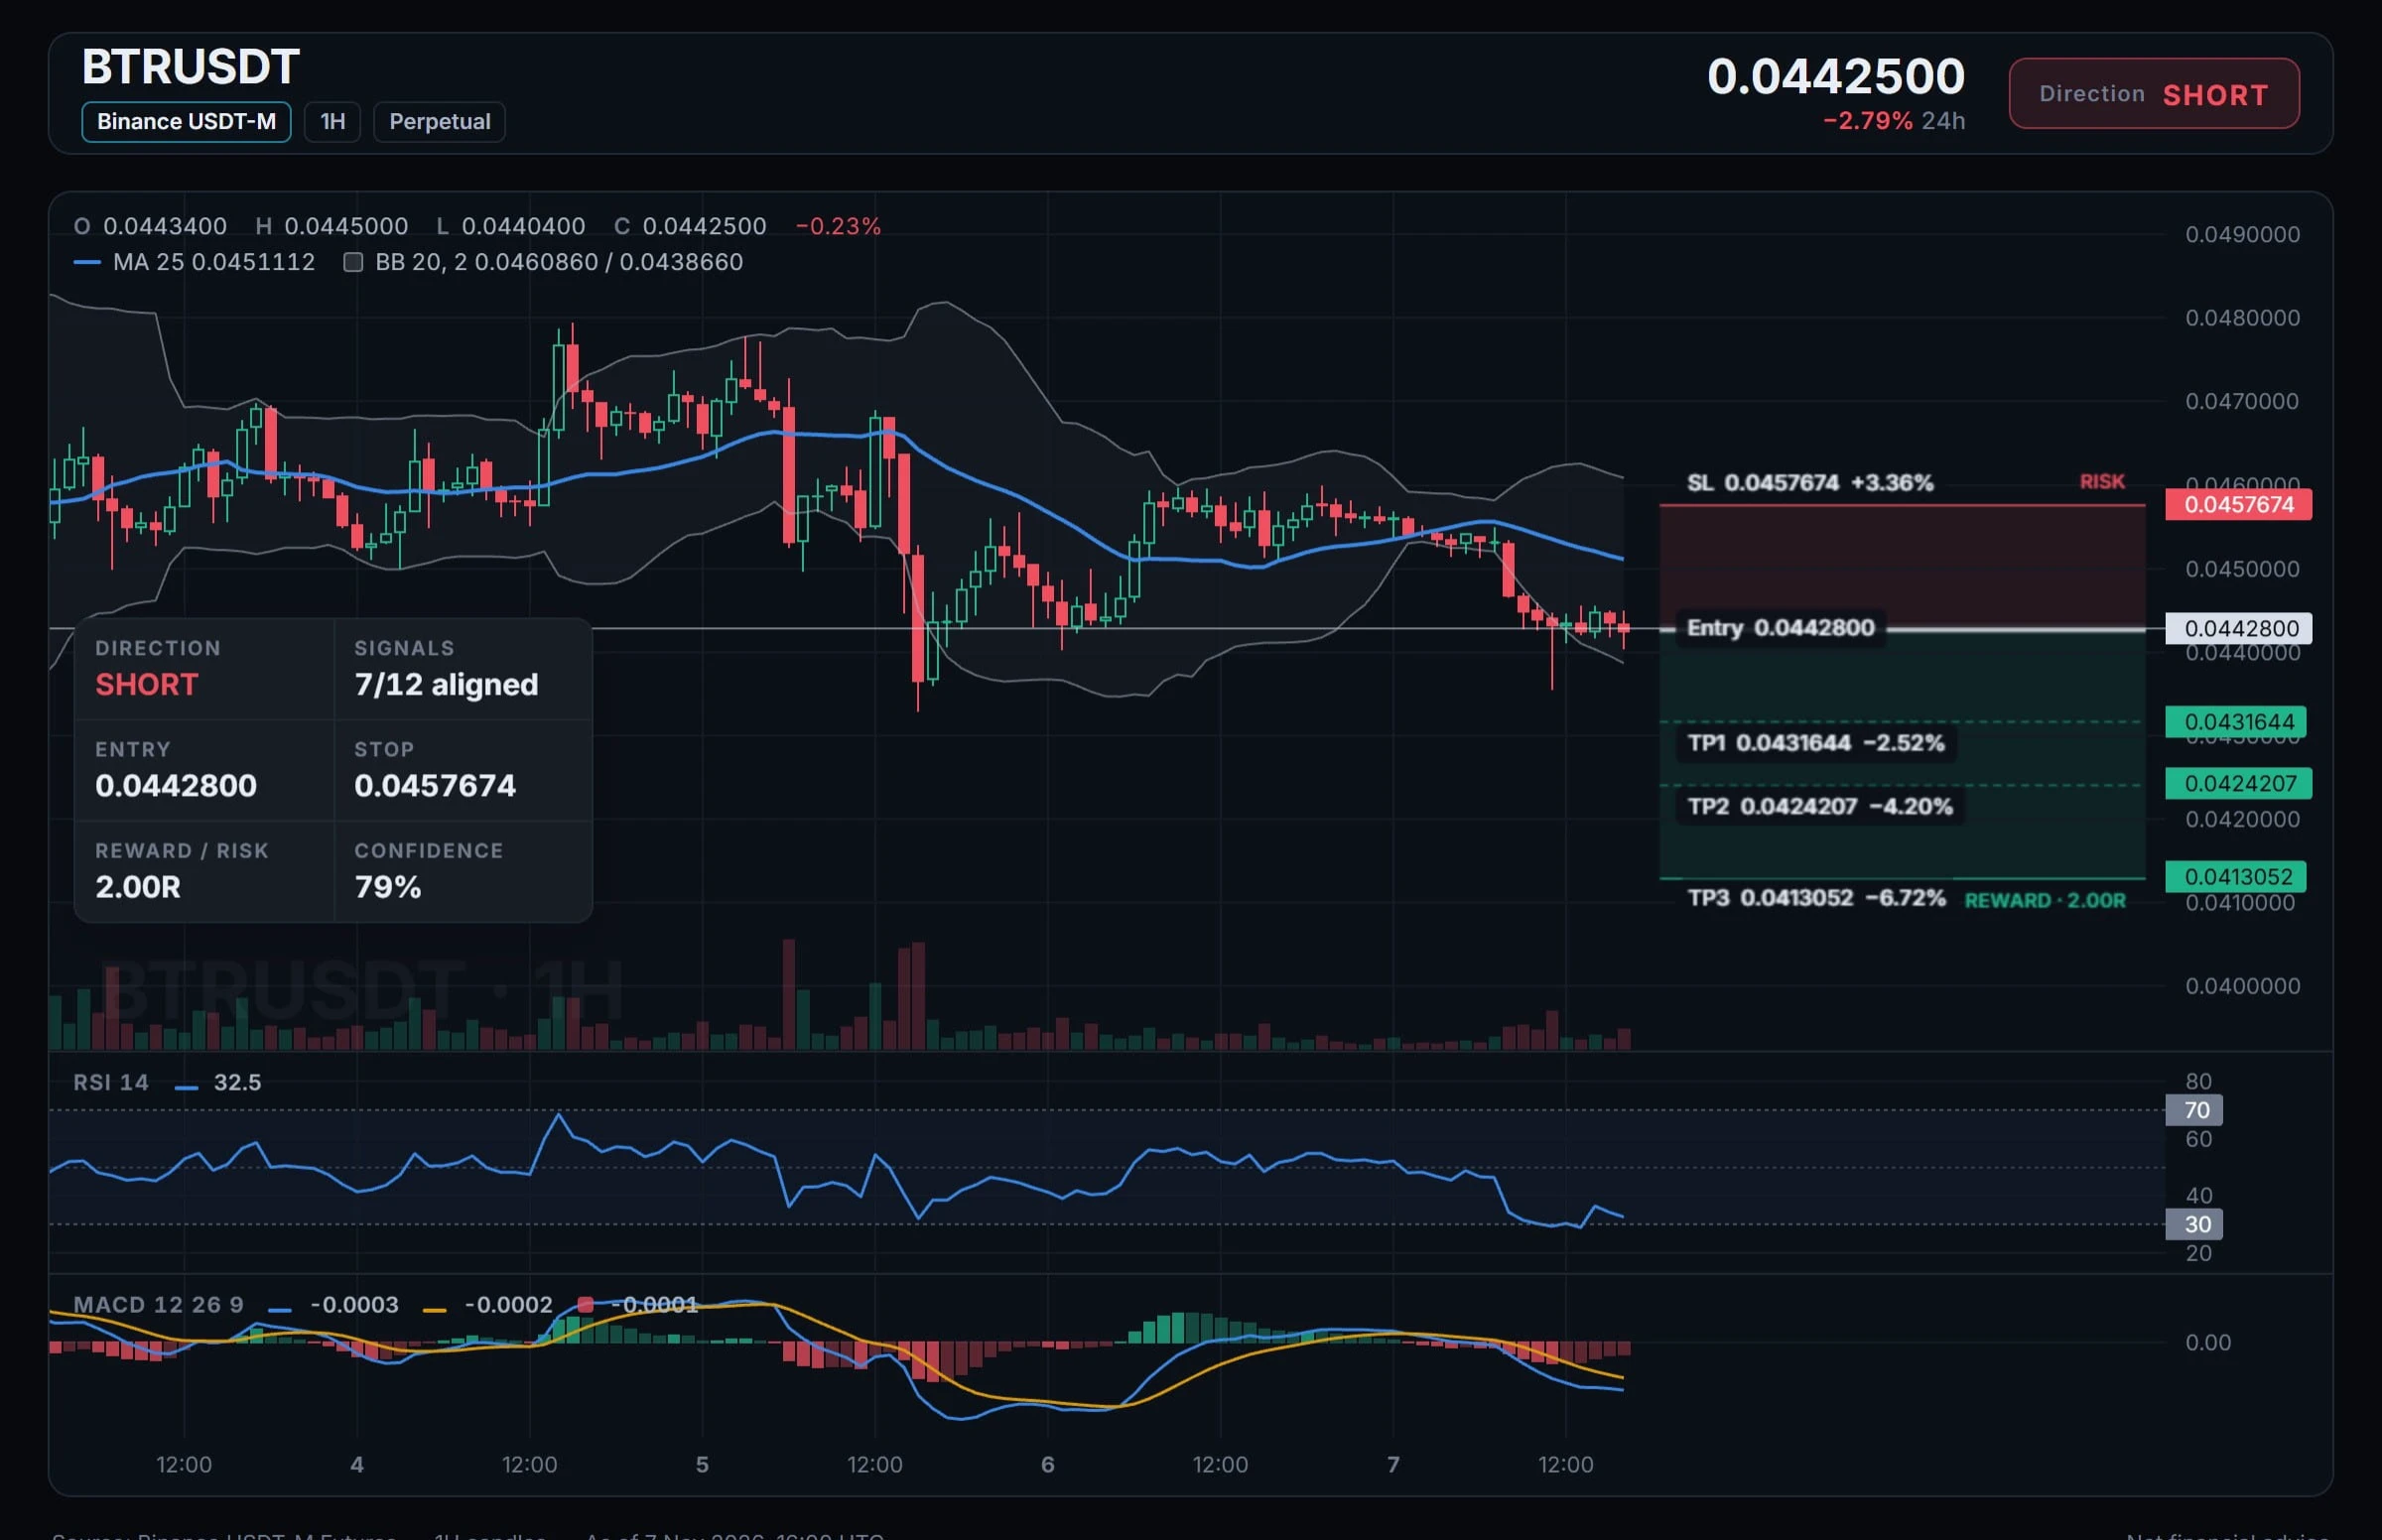
BULLS TRAPPED $BTR USDT Short Setup is Locked & Loaded

$BTR /USDT
Direction: SHORT

Entry Zone: 0.0442800

Take-Profit Targets:
🔹 TP1: 0.0431644
🔹 TP2: 0.0424207
🔹 TP3: 0.0413052

🛑 Stop-Loss: 0.0457674

$BTR ‌
post-image
BTR+1.32%
St-Irenaeus was the first to show how apostolic succession had been institutionalized in the line of bishops in every church and that his list of Popes, complied around 170AD is the earliest witness we have to the immediate successors of St-Peter.
@grok Am I right?
post-image
Not even the s&p can keep this floater down
post-image
SPX+0.33%
  • 1
Load More

Join 40 M users in our growing community

⚡️ Join 40 M users in the crypto craze discussion

💬 Engage with your favorite top creators

👍 See what interests you

Trending Topics

USAIStocksHitHard

21.44k Views3.68k Discussing

U.S. stocks sold off sharply on Thursday, November 5 (UTC). The Nasdaq closed down around 5.5%, entering correction territory, while the Philadelphia Semiconductor Index plunged roughly 12%, with chip stocks including $NVDA and $AMD posting steep losses. Beyond profit-taking, investors are growing concerned about the pace of AI data center construction, capital spending, and future returns on investment. The key question now is whether the AI sector’s lofty growth expectations need to be repriced. Where do you think the next opportunities will emerge: chip stocks, tech giants, or other sectors?

USNonfarmPayrolls

35.66k Views4.35k Discussing

StakeOnLaunchpoolToShare450KVLX

10.5k Views831 Discussing

View More