Share your thoughts
placeholder
Article
Robinhood utility coin named DOXA is up over 100% last 10 min following large whale buying
You aren't bullish enough
Doxa will go higher
CRYPTO MARKET UPDATES
live-cover
LIVE1,862
#BTCReclaims80K
Bitcoin’s Growing Twin: Why the Gold Correlation Just Hit 0.50
Here’s a development worth paying attention to: the 90-day correlation between Bitcoin and gold has surged to +0.50.
It’s the highest level we’ve seen since the COVID-19 crash of 2020. To put that into perspective, this metric has more than doubled since the start of the year. Back in 2022, during a relatively stable post-crash recovery, that same correlation peaked at a modest +0.30.
So, what changed?
The primary catalyst appears to be a specific policy shift from the U.S. Treasury. On August 19, they announced pl
post-image
BTC+0.18%
  • 3
Everyone’s long on the daily—but the 4h just whispered ZEC is lying to you.

$ZEC /USDT - SHORT

Trade Plan:
Entry: 1170.79 – 1184.37
SL: 1262.29
TP1: 1114.05
TP2: 1071.69
TP3: 1008.16

Why this setup?
Why now? The 1h ref sits at 1177.58, but RSI on the 15m is screaming 81.3—overbought before a 4h breakdown. My model says SHORT with 84% confidence, targeting 1114 first, then 1071. The daily trend is bullish, which makes this a high-probability pullback trap, not a reversal. ATR (27.15) is tight enough to reward patience.

Debate:
If the 1D stays bullish, do you fade this short at TP1 or wa
ZEC+15.37%
#Gate事件合约晒单挑战 Tokenized Stocks Are Growing in DeFi And UNI & KMNO Are Now in Focus
The latest September 6 data shows an important shift in the tokenized-stock DeFi market. Uniswap V4 is currently leading the category with $59.1M in TVL, followed by Kamino Lend at $41.7M and Uniswap V3 at $20.9M. Together, these three protocols represent approximately 63% of the category’s $192.6M total TVL. That concentration is significant because it shows where the largest amount of tokenized-stock liquidity is currently sitting.
THE BIGGER SIGNAL: $192.6M TVL
The most important number is not only the $59.1
UNI+12.76%
KMNO+0.16%
We need this right?
post-image
I originally wanted to cut losses and sacrifice it to the heavens, but the ritual didn't happen—the meat roasted itself.

The last thing I saw before bed was BTC oscillating around 76872.9. It should have broken but didn't, and there were buyers waiting below the whole time. Since the volume hadn't deteriorated, I left one long position open, set the stop-loss below the structure, and turned off the light.

When I checked the chart again in the morning, the price had already reached 79912, delivering a +687.54% return. This move was truly worth staying up for. I had already prepared for the
post-image
BTC+0.18%
ETH+1.76%
DOGE+6.46%
Everyone’s staring at the 4H, but the 15-minute RSI just screamed at 32.5—$LAB /USDT is leaking before your eyes.

$LAB /USDT - SHORT

Trade Plan:
Entry: 0.07312 – 0.07356
SL: 0.07549
TP1: 0.07173
TP2: 0.07066
TP3: 0.06905

Why this setup?
- 95% confidence SHORT isn’t a guess; it’s a statistical mugging.
- Price pinned at 0.07334, but the real story is the 1D bearish trend—gravity is already on.
- TP1 (0.07173) is a 2.2% drop; TP2 (0.07066) is the meat. The ATR (0.000894) says volatility is your friend, not your enemy.
- Why now? The 1H reference is the same as entry—no fake pump, jus
LAB-3.77%
Everyone’s watching HOME bounce—but the 4h tape is screaming something else entirely.

$HOME /USDT - SHORT

Trade Plan:
Entry: 0.00615 – 0.00617
SL: 0.00627
TP1: 0.00608
TP2: 0.00602
TP3: 0.00594

Why this setup?
- 1D trend is bearish, yet 15m RSI sits at 57.6—that’s a dead-cat wiggle, not a reversal.
- Price is pinned at 0.00616, right at the invalidation line. A rejection here fuels the short engine.
- With ATR at 0.000045, the path to TP1 (0.00608) is a 1.3% glide—low effort, high probability.
- Why now? The 4h structure is primed for a liquidity sweep below 0.00615 before the dail
HOME+0.98%
Next week’s BTC market analysis:
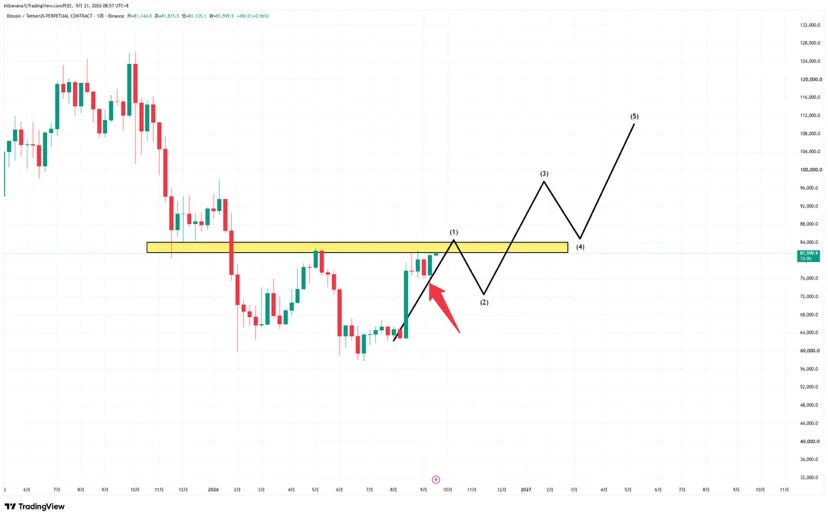
On the 6-hour timeframe, BTC has currently reached a high-level sideways range with divergence. If the upward momentum weakens in this move, it will most likely return to around $79,000–$76,000 for another adjustment and to build momentum. If the upward breakout continues to strengthen, I personally think it may produce an upward wick to around $90k on the weekly timeframe. This would be a weekly-level wick, not a small-timeframe one. Personally, I think the first few days of the coming week will return to a daily-level sideways trend, which should be favorable
post-image
BTC+0.18%
We’re seeing meme coin multiple like gains on lagging large caps as capital rotates into anything still perceived as underpriced.
Ahead of the curve this time.
post-image
MEME-1.37%
#Share My Holding Returns#BTCReclaims80K Hopefully we make a profit, bro. Small capital is fine; what matters is trading.
post-image
I originally wanted to sell at a loss to appease the heavens, but the ritual failed and the meat ended up cooking itself. As the price repeatedly swung around during the session, $ZEC was still hovering near 833.19. Watching that low-volume surge, I knew right away—the rebound was weak, support was insufficient, and there would be no one to catch it even if it pushed higher. This was clearly a bull trap with a strong whiff of deception.
At the time, I told the brothers to open longs without hesitation and not get lured in by that little rebound. Hold as long as the trend remains intact; run w
post-image
ZEC+15.37%
ETH+1.76%
DOGE+6.46%
#Gate60MillionUsers
#Gate60MillionUsers
Reaching 60 million users is not just another milestone. It is a powerful statement about how quickly a platform, community, product, or ecosystem can grow when innovation meets real user demand. Sixty million people represents millions of individual stories, experiences, ideas, interactions, and opportunities coming together under one global movement.
A number like 60 million can look simple on the surface, but behind that number is an enormous amount of effort. It represents the developers who continue building, the teams working behind the scenes, t
post-image
I originally wanted to cut my losses and sacrifice them to the heavens, but the sacrifice never happened—the meat cooked itself. 😂

As the price kept oscillating intraday, I kept watching 0.18850. Every rally fell just short, and the rebound had no volume. If that isn’t a lack of buying support, what is? The bull-trap vibes were way too strong, so I placed a short and entered without hesitation.

It has now been pushed to 0.12616, with a return of +653.05%. The earlier action was truly sluggish, but the outcome is truly sweet. Those who caught the rhythm should be waking up laughing.

I’m
post-image
ETH+1.76%
LAB-3.77%
Nobody’s watching LTC while it quietly builds a 4h trap—are you the exit liquidity?

$LTC /USDT - SHORT

Trade Plan:
Entry: 54.13 – 54.43
SL: 55.70
TP1: 53.22
TP2: 52.51
TP3: 51.44

Why this setup?
- 1D is range, but the 4h bias just flipped SHORT at 54.28 with 55.4% conviction.
- RSI on 15m is already at 44—momentum is fading before the daily open.
- ATR (1h) at 0.59 means we have room to bleed to TP2 (52.51) without panic.
- Why now? Price is hugging entry_low (54.13) and refusing to reclaim 54.43—that’s weakness, not accumulation.

Debate:
If LTC breaks 54.13, do you trust the sho
LTC-0.22%
i feel violated
post-image
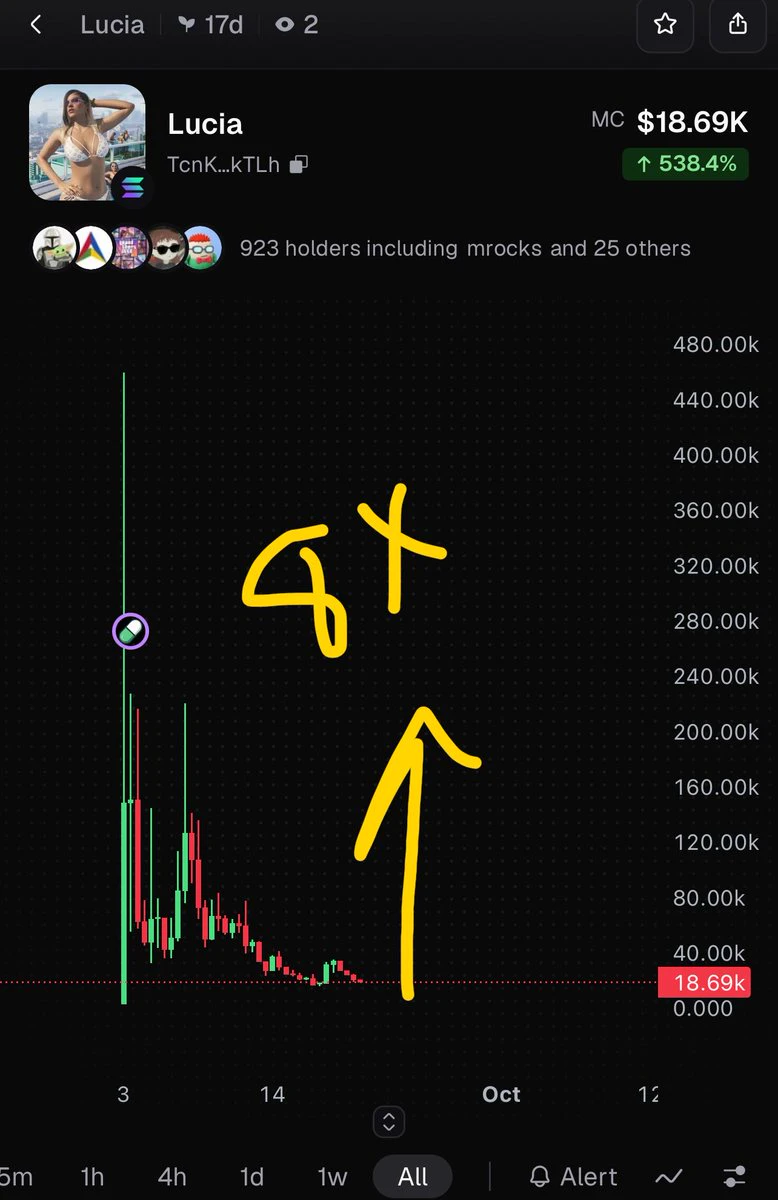
Next billion mcap #ticker ?
#memecoins
post-image
#HYPEBreaks88HitsNewAllTimeHigh
$HYPE
$HYPE is currently trading around **$86.56** after briefly breaking above the $88 level and printing a fresh all-time high.
Key Price Levels
- **New All-Time High**: **$88.06 – $88.15** (reached on September 3–4, 2026)
- Previous major high: ~$83.50 (late August 2026)
- Current price: **$86.56** (slight pullback from the peak)
- Distance from ATH: Approximately -1.7% to -1.8%**
Technical Snapshot
- Structure: Strong higher-highs sequence remains intact. The break above the prior $83.50 resistance confirmed continuation of the broader uptrend that began
post-image
Falcon_Official
#HYPEBreaks88HitsNewAllTimeHigh
$HYPE
THE BREAKOUT HAS COOLED BUT THE STORY IS NOT OVER
HYPE is currently trading around $83.98, after recently pushing through the $88 area and printing a fresh all-time high. The move has now entered a more interesting phase: instead of chasing the breakout candle, the market is testing whether HYPE can build a strong base after the record move. From the recent data, HYPE remains one of the strongest-performing large crypto assets, with 24-hour trading activity still around the $1.6B+ area, showing that participation remains substantial.
FROM BREAKOUT TO RETEST
The move above $88 was important because HYPE entered price-discovery territory. Once the previous high was broken, historical resistance above that level disappeared. But price discovery does not mean straight-line growth. HYPE has now pulled back toward $83.98, making the $88 region an important reference point. If buyers can eventually reclaim $88 and turn it into support, the market could start focusing on the next psychological levels rather than treating $88 as resistance.
THE TECHNICAL MAP
At $83.98, HYPE is sitting below its recent record, so I would focus on confirmation rather than simply chasing momentum. The first important support area is around $83.5–$84, almost exactly where the current price is trading. Holding this region would keep the immediate bullish structure alive. Below that, $80–$81 becomes the major breakout/retest zone. A deeper correction could bring $75–$76 into focus, but losing that region would represent a much larger deterioration in the short-term structure.
RESISTANCE IS CLEAR
On the upside, $88–$88.5 remains the first major resistance because this is where the recent record was established. Above that, $90 becomes the next psychological level, followed by $95 and the major $100 milestone. A clean break above $90 with strong volume would make the $95–$100 zone much more interesting. The important condition is that HYPE must demonstrate acceptance above resistance rather than simply creating another short-lived wick.
WHY HYPE STILL HAS ATTENTION
The strength behind HYPE is not based only on chart momentum. Hyperliquid has become a major on-chain derivatives venue, and the ecosystem's trading activity remains a central part of the HYPE narrative. The token also has a structural connection with protocol economics through fee-funded buybacks, giving traders another reason to monitor ecosystem activity alongside the chart. Recent market data continues to show substantial HYPE trading volume and a market capitalization around the high-$18B/low-$19B range.
BUT THERE IS A SUPPLY WARNING
The bullish structure comes with an important risk that traders should not ignore. HYPE has recurring token unlocks, and another significant unlock is scheduled for September 29, involving roughly 14.2M HYPE according to current unlock tracking. That represents approximately 1.4% of total supply and around 2.7% of market capitalization at the cited valuation. This does not automatically mean HYPE must fall, but additional supply can increase volatility and profit-taking pressure if demand weakens.
MY BULLISH SCENARIO
My preferred bullish sequence is:
$83.98 → $88 → $90 → $95 → $100
If $83.5–$84 continues to hold and buyers return with stronger volume, HYPE could make another attempt at $88. A confirmed break above $88–$88.5 would reopen price discovery, while a move through $90 could bring $95 and eventually $100 into focus.
The most convincing setup would not be another vertical candle. I would rather see HYPE break resistance, consolidate, and successfully defend the previous breakout area. That would show that buyers are actually absorbing supply instead of simply chasing momentum.
MY BEARISH SCENARIO
The first warning would be a decisive loss of $83.5. If that happens, I would watch $80–$81 very closely. That area is important because it can act as the major breakout/retest zone. If HYPE loses $80 with strong selling pressure, the short-term structure becomes significantly weaker and $75–$76 could become the next major area of interest.
A correction from the current level would not automatically destroy the bigger bullish trend. After a powerful rally and a new ATH, consolidation can actually be healthy. The real danger would be losing multiple major supports while volume expands on the downside.
THE REAL TRADING DECISION
At $83.98, my approach is bullish but selective. I would not treat the current price as an automatic buy simply because HYPE previously reached $88. The better confirmation would be either a strong reclaim of $88–$88.5 with expanding volume or a controlled pullback toward $83.5–$84 / $80–$81 followed by a clear bullish reaction.
The difference between a good breakout and a dangerous chase is confirmation.
HYPE has already proved that buyers can push the token into new territory. Now the market has a different job: proving that the breakout can survive its first serious test.
For me, the map is simple:
Above $88.5 with volume → bullish continuation
$83.5–$84 holds → buyers remain in control
$80–$81 holds → major retest opportunity
Below $80 → caution increases
$90 breaks → $95/$100 becomes the next focus
The $88 breakout created the headline. $83.98 is where the market is now testing the foundation.
If buyers defend this area and return with volume, HYPE could get another shot at $88, $90, $95 and eventually $100.
But I am not chasing the candle.
I want HYPE to prove that $88 was a breakout not just a temporary liquidity sweep. @Gate_Square
repost-content-media
HYPE+2.10%
Load More

Join 40 M users in our growing community

⚡️ Join 40 M users in the crypto craze discussion

💬 Engage with your favorite top creators

👍 See what interests you

View More