






#CPI数据前瞻 #作手分析
🔥 U.S. October CPI is coming up! Has all the bad news already been priced in? Can this inflation report still trigger a selloff?
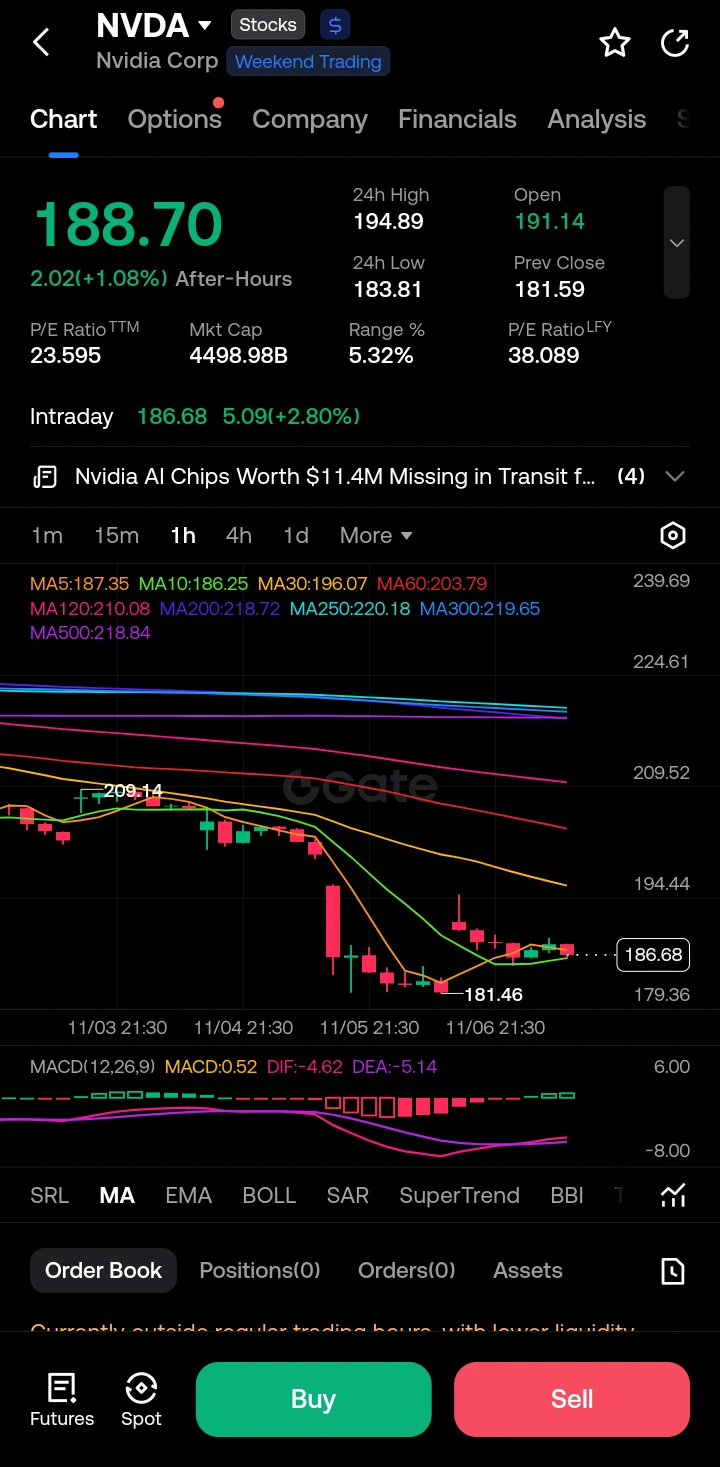
Trading watchlist: $BTC $ETH $NVDA $GOOGL $XAU
At 21:30 Beijing time on November 10, the U.S. will release its October CPI data.
September CPI rose 3.7% year over year. The market expects headline CPI to rise about 0.24% month over month in October, and core CPI to rise about 0.2%.
I have a view on this CPI report that differs from the market consensus: If inflation comes in below expectations, the market could see a rebound; even if inflation runs hot, U.S. stocks may not plunge again.
Why? Let’s first review what has happened recently.
I. Bad news has hit all at once, but the market hasn’t continued falling
On November 3, in the U.S. midterm elections, Democrats won control of both chambers of Congress, and the market grew concerned about AI data center construction and tighter regulation of the tech industry.
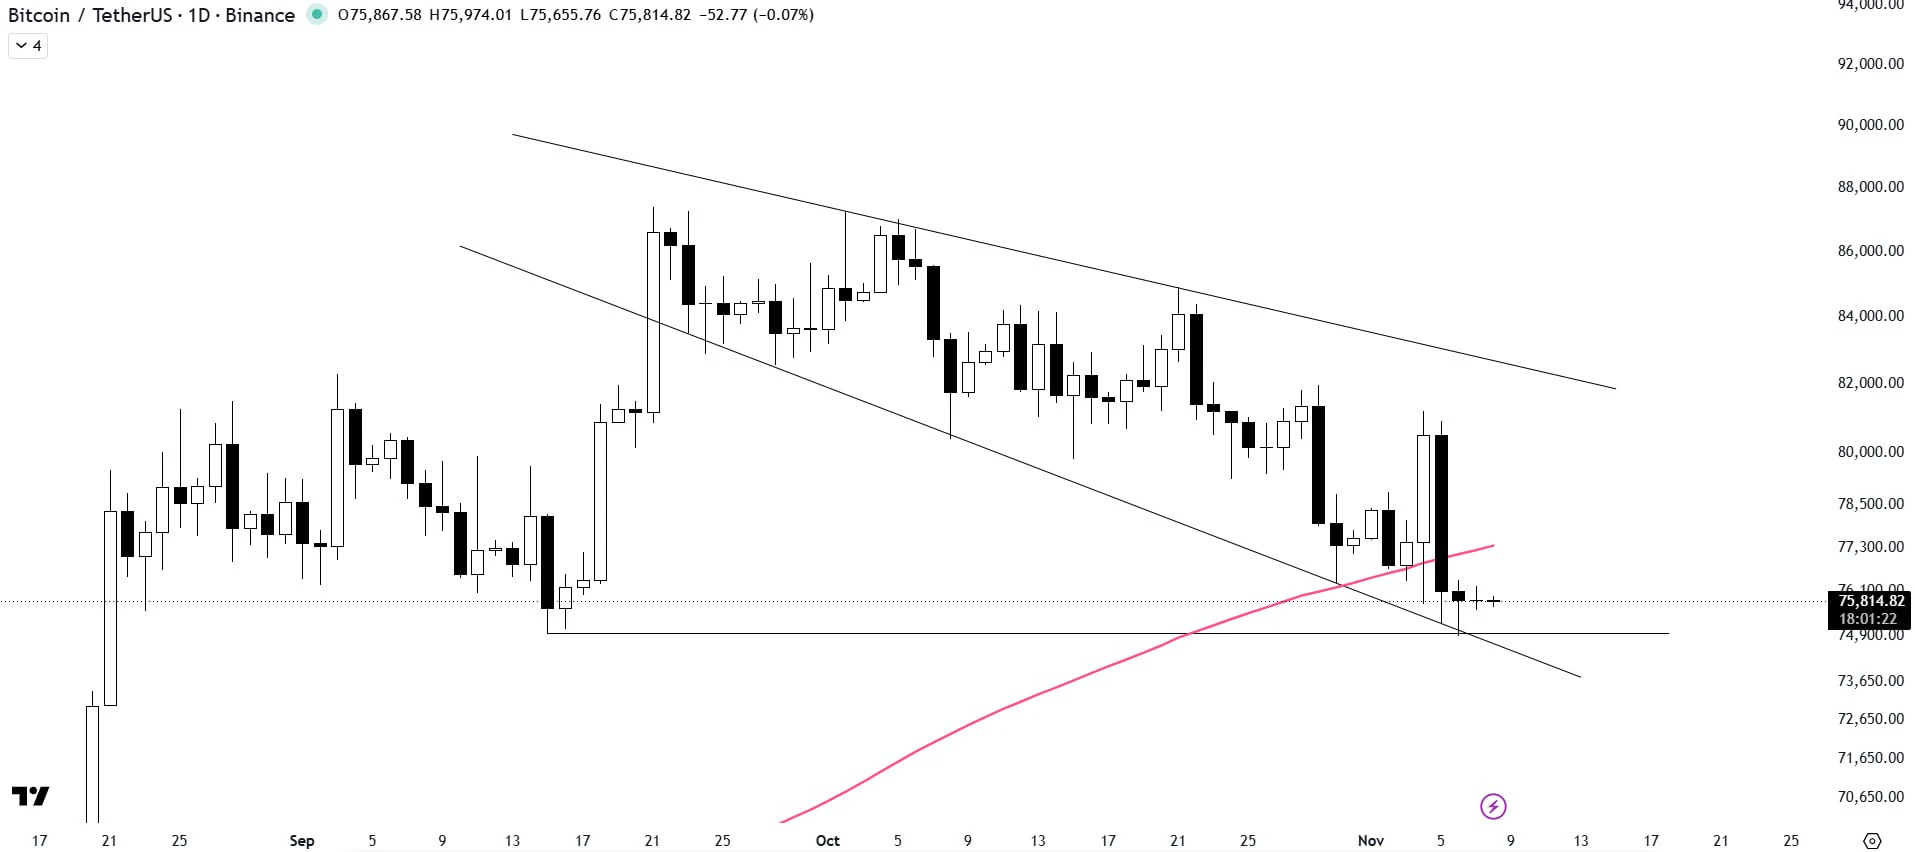
On November 5, U.S. tech and semiconductor stocks suffered heavy losses, and BTC also fell in tandem, with market anxiety rising rapidly.
But on November 6, the U.S. released October nonfarm payroll data: employment increased by 165k, far above the market expectation of 65k, while the unemployment rate fell to 4.1%.
By traditional logic, strong employment means less room for rate cuts, which is unfavorable for U.S. stocks and crypto assets.
However, the market didn’t continue to plunge. The Nasdaq and S&P 500 actually closed higher.
What does this mean?
I believe some of the earlier bad news had already been reflected in prices. The market is beginning to shift from trading purely on macroeconomic fears to reassessing corporate earnings and asset valuations.
II. What’s my take on this CPI report?
The market has already priced in a high probability of a Fed rate hike in December, with rate futures at one point reflecting about a 78% chance of a hike.
So a December rate hike is no longer a complete surprise in itself. What will really affect the market is whether the CPI data further changes expectations for the future path of interest rates.
I see three possible scenarios:
1️⃣ CPI below expectations:
Cooling inflation could ease concerns about further rate hikes. Treasury yields and the dollar may fall, giving BTC, U.S. stocks, and gold a chance to rise.
2️⃣ CPI in line with expectations:
The market may continue to trade sideways. The focus will be on Treasury yields, the dollar, and capital flows as the market waits for a directional move.
3️⃣ CPI above expectations:
In the short term, this could push up Treasury yields and the dollar, putting pressure on BTC, tech stocks, and gold.
But I don’t think a hotter-than-expected reading means U.S. stocks will inevitably plunge again. The market has already undergone a major correction, and expectations for a rate hike are already high. The key is whether the actual result exceeds what has already been priced in.
III. Trader’s take and trading plan
What I’m watching more closely is whether the valuations of high-quality companies have shed too much froth after the recent sharp decline.
For companies with solid earnings, orders, and cash flow, I think it’s time to start looking for long-term spot opportunities rather than focusing only on short-term macro headwinds.
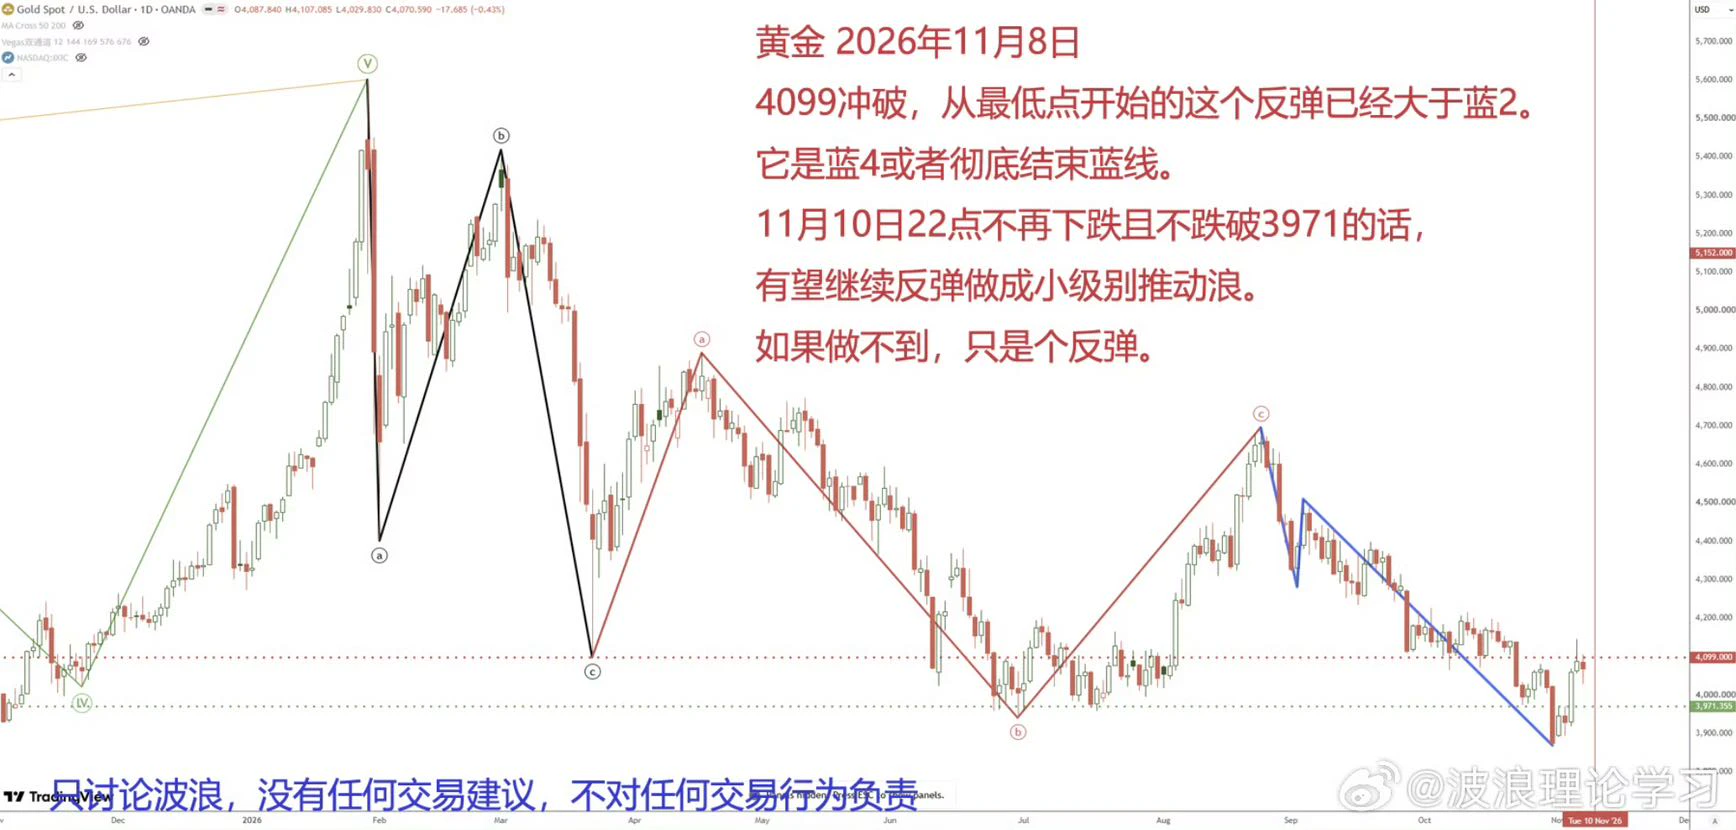
The same goes for BTC and gold: Don’t just look at the CPI figure; also watch the dollar, real Treasury yields, and how capital actually reacts.
My plan:
• Spot: Build positions in high-quality assets in stages; don’t bet everything on the bottom at once.
• Futures: Don’t bet on the data’s direction. Wait for a breakout, retest, and confirmation.
• Risk management: If the market continues to weaken, reassess positions instead of blindly holding on.
My core view: To know how much bad news has been priced in, watch how prices move, not just what the headlines say.
If CPI comes in below expectations, the market could rebound; if it comes in above expectations, watch whether the market has already priced it in.
Don’t call the top or bottom, and don’t chase the first big green candle.
Macro sets the direction; structure determines the entry. Let the market give you the answer instead of trying to predict it!
How do you think the market will move after this CPI release?
A. Inflation cools, broad rebound
B. In line with expectations, continued sideways trading
C. Inflation runs hot, another drop
D. Bad news is priced in, and prices rise instead
Share your take in the comments! 👇
(Personal views for discussion only; not investment advice.)
🔥 U.S. October CPI is coming up! Has all the bad news already been priced in? Can this inflation report still trigger a selloff?
Trading watchlist: $BTC $ETH $NVDA $GOOGL $XAU
At 21:30 Beijing time on November 10, the U.S. will release its October CPI data.
September CPI rose 3.7% year over year. The market expects headline CPI to rise about 0.24% month over month in October, and core CPI to rise about 0.2%.
I have a view on this CPI report that differs from the market consensus: If inflation comes in below expectations, the market could see a rebound; even if inflation runs hot, U.S. stocks may not plunge again.
Why? Let’s first review what has happened recently.
I. Bad news has hit all at once, but the market hasn’t continued falling
On November 3, in the U.S. midterm elections, Democrats won control of both chambers of Congress, and the market grew concerned about AI data center construction and tighter regulation of the tech industry.
On November 5, U.S. tech and semiconductor stocks suffered heavy losses, and BTC also fell in tandem, with market anxiety rising rapidly.
But on November 6, the U.S. released October nonfarm payroll data: employment increased by 165k, far above the market expectation of 65k, while the unemployment rate fell to 4.1%.
By traditional logic, strong employment means less room for rate cuts, which is unfavorable for U.S. stocks and crypto assets.
However, the market didn’t continue to plunge. The Nasdaq and S&P 500 actually closed higher.
What does this mean?
I believe some of the earlier bad news had already been reflected in prices. The market is beginning to shift from trading purely on macroeconomic fears to reassessing corporate earnings and asset valuations.
II. What’s my take on this CPI report?
The market has already priced in a high probability of a Fed rate hike in December, with rate futures at one point reflecting about a 78% chance of a hike.
So a December rate hike is no longer a complete surprise in itself. What will really affect the market is whether the CPI data further changes expectations for the future path of interest rates.
I see three possible scenarios:
1️⃣ CPI below expectations:
Cooling inflation could ease concerns about further rate hikes. Treasury yields and the dollar may fall, giving BTC, U.S. stocks, and gold a chance to rise.
2️⃣ CPI in line with expectations:
The market may continue to trade sideways. The focus will be on Treasury yields, the dollar, and capital flows as the market waits for a directional move.
3️⃣ CPI above expectations:
In the short term, this could push up Treasury yields and the dollar, putting pressure on BTC, tech stocks, and gold.
But I don’t think a hotter-than-expected reading means U.S. stocks will inevitably plunge again. The market has already undergone a major correction, and expectations for a rate hike are already high. The key is whether the actual result exceeds what has already been priced in.
III. Trader’s take and trading plan
What I’m watching more closely is whether the valuations of high-quality companies have shed too much froth after the recent sharp decline.
For companies with solid earnings, orders, and cash flow, I think it’s time to start looking for long-term spot opportunities rather than focusing only on short-term macro headwinds.
The same goes for BTC and gold: Don’t just look at the CPI figure; also watch the dollar, real Treasury yields, and how capital actually reacts.
My plan:
• Spot: Build positions in high-quality assets in stages; don’t bet everything on the bottom at once.
• Futures: Don’t bet on the data’s direction. Wait for a breakout, retest, and confirmation.
• Risk management: If the market continues to weaken, reassess positions instead of blindly holding on.
My core view: To know how much bad news has been priced in, watch how prices move, not just what the headlines say.
If CPI comes in below expectations, the market could rebound; if it comes in above expectations, watch whether the market has already priced it in.
Don’t call the top or bottom, and don’t chase the first big green candle.
Macro sets the direction; structure determines the entry. Let the market give you the answer instead of trying to predict it!
How do you think the market will move after this CPI release?
A. Inflation cools, broad rebound
B. In line with expectations, continued sideways trading
C. Inflation runs hot, another drop
D. Bad news is priced in, and prices rise instead
Share your take in the comments! 👇
(Personal views for discussion only; not investment advice.)