
Square
Following
Hot
News
Notifications
Profile
Share your thoughts
placeholder
Article
$NVDA
One of the greatest assets in the market is presenting an interesting technical setup.
After seven consecutive bearish weekly candles, price is now trading into several significant higher-timeframe levels, including the monthly 50 MA, the 200-week MA and the 0.786 Fib.
In my opinion, this is precisely the type of opportunity sidelined capital should be paying close attention to. I’ll certainly be watching closely myself.
However, confirmation is key. Should these levels fail to hold, the potential for a relief bounce becomes invalidated, opening the door for further downside. At that po
NVDA-13.84%
  • 3
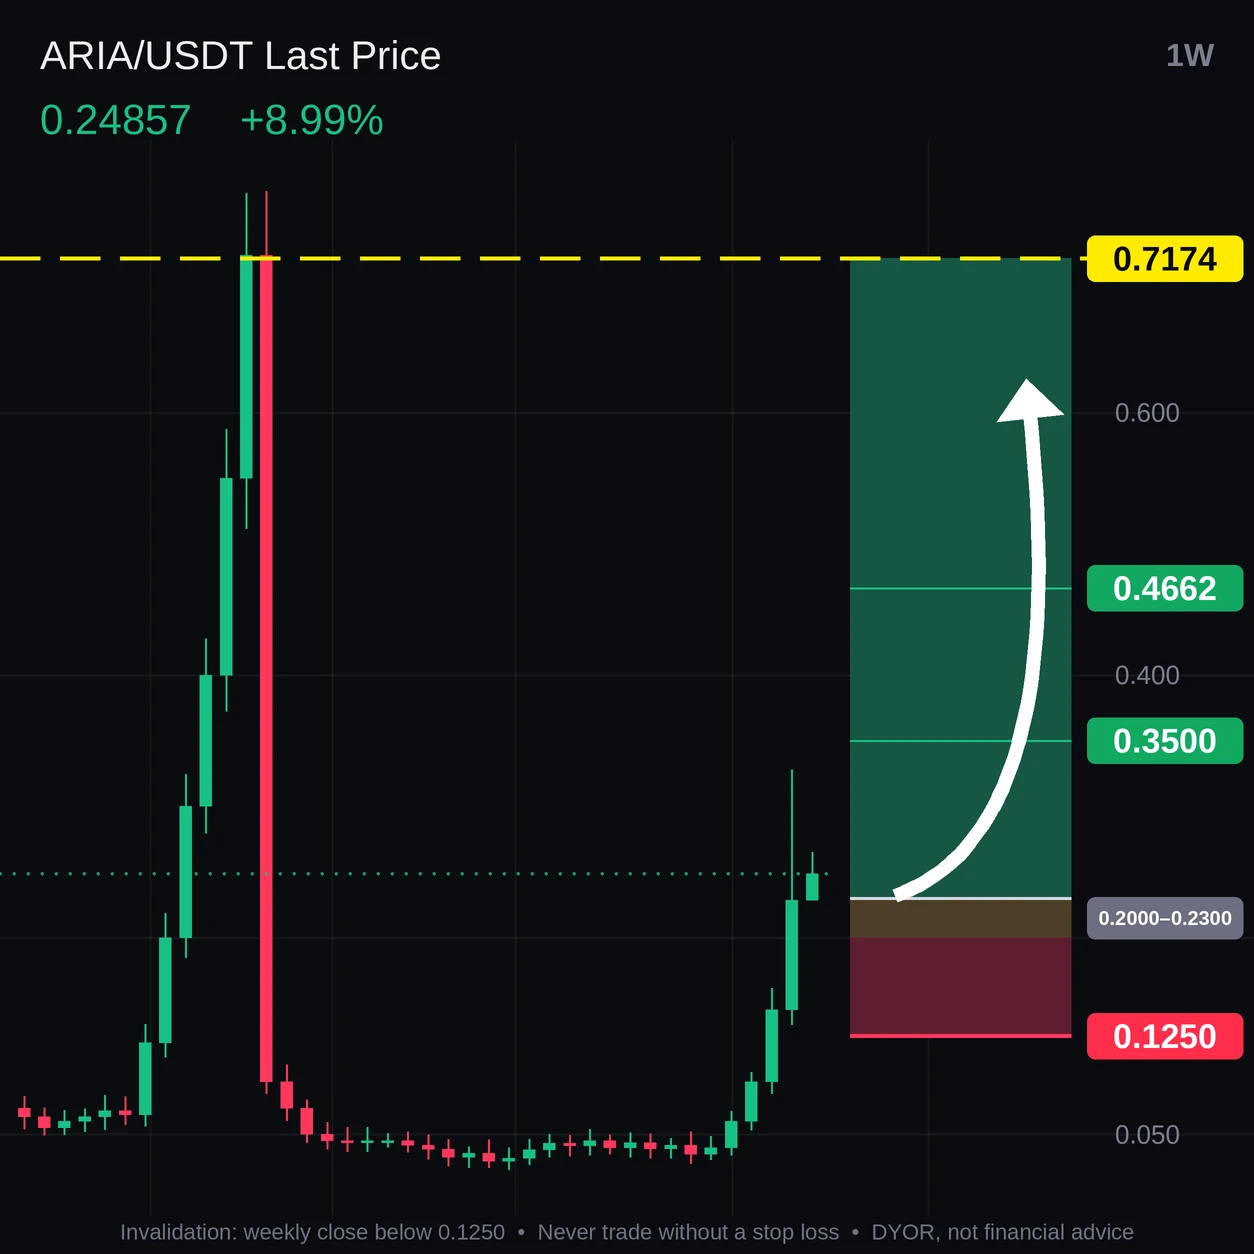
🟢 $ARIA /USDT Long Position 🔥🔥
$ARIA ‌
Entry price: $0.2000 – $0.2300
Stop-loss: $0.1250
Take-profit 1: $0.3500
Take-profit 2: $0.4662
Take-profit 3: $0.7174

A weekly close above $0.3300 would significantly strengthen the long position.

⚠️ Invalidation zone: $0.1200 – $0.1300.
post-image
ARIA+21.92%
Trenches
PIEVERSE
P
bade
b
PIEVERSE
0x0e...25a9
Market Cap
$
Change
.
24h Vol
$.
Holders
.
IDOL
I
bade
b
IDOL
0x3b...ab07
Market Cap
$.
Change
.
24h Vol
$.
Holders
.
JAGENT
J
bade
b
JAGENT
0x8e...ae15
Market Cap
$.
Change
.
24h Vol
$.
Holders
.
mihao
m
bade
b
mihao
4Cxj...pump
Market Cap
$.
Change
.
24h Vol
$.
Holders
.
BLOB
B
bade
b
BLOB
8s11...pump
Market Cap
$.
Change
.
24h Vol
$.
Holders
.
Market Analysis | After Exiting, Don’t Rush to Buy Back
1️⃣ During the rebound from the previous lows, I reminded everyone to exit completely at 61,300 and 2,710 and lock in profits first. Trading isn’t about selling at the exact top; it’s about sticking to your plan.
2️⃣ BTC then climbed to a high of 61,668 and has now pulled back to around 60,858. Resistance has emerged between 61,300 and 61,668, with 62,033 as the next level to watch above. Below, watch 60,000 first, then 58,767 if it breaks.
3️⃣ ETH is currently around 1,713, after reaching an intraday high of 1,732. Although it’s recoveri
post-image
BTC-0.67%
ETH-1.26%
  • 6
  • 2
Liverpool 4 vs 0 Manchester United
He who sells a Monkey 🐒 and buys a dog 🐕, he should remember that..................?!!!!
post-image
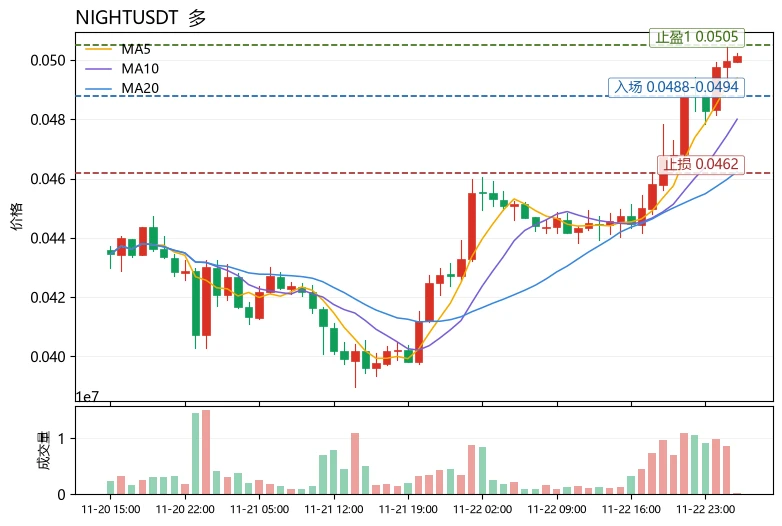
$NIGHT is already up 9 points. Can you still chase it? The technical outlook says: bullish, but don't chase—wait for a pullback.

First, the structure: MA5=0.049386 has crossed above and held above MA20=0.0462365, with the short- and medium-term moving averages aligned bullishly and the trend direction clear. The MACD histogram is +0.0004155, with the red bars continuing, so bullish momentum has not yet faded. But the problem is RSI=80.1, already in overbought territory, while the current price of 0.05006 is just below the Bollinger upper band at 0.050534, with resistance close at hand. Meanw
post-image
NIGHT-3.10%
INJ-1.67%
AIGENSYN+1.18%
Did you make a profit today?

The volatility of major coins is still somewhat underwhelming. Altcoins have been moving better. I trimmed part of my position and kept holding for just three days.

Those who followed along should have made some comfortable profits this time, right? Don’t get impatient. Use patience and time to generate profits—let time create room for growth.

A lot of people have recently added me to learn, and I’ve met many people like this. But trading is a gradual process, not a way to get rich overnight. As I always say, if you don’t want to learn, don’t contact me—I don’t
BULLA+10.92%
ETH-1.23%
#PCEAndGDPDataNextWeek #ShareWeekly

Financial markets are approaching another important macroeconomic event as the United States prepares to release a fresh batch of inflation and economic growth figures on November 25. This time, investors will receive several important indicators together, including October's Personal Consumption Expenditures (PCE) Price Index, the revised third-quarter GDP estimate, personal spending, and durable goods orders.

In my view, this combination deserves particular attention because inflation and economic growth can tell two very different stories about the US
post-image
$STRK For the bulls to keep pushing, they first need to prove they can hold around 0.0315 on the 4-hour timeframe. I’m currently watching whether the narrow 0.03148–0.03160 range can form solid support. If the price falls below 0.0308, the entire long thesis is immediately invalidated. Rather than chasing the rally, I’d prefer to wait for a pullback and confirmation before entering.
For this trade setup, the stop-loss distance is about 2.2%, while the potential gain at the third target is around 3.6%, putting the risk-reward ratio at the final target at roughly 1.6R. The 1-hour RSI currently
post-image
STRK-3.55%
JUST IN: 🇺🇸 A top Democrat is threatening to cut off government funding for Elon Musk's SpaceX.
post-image
  • 1
Hurry, get in—we’re about to hit the highway
post-image
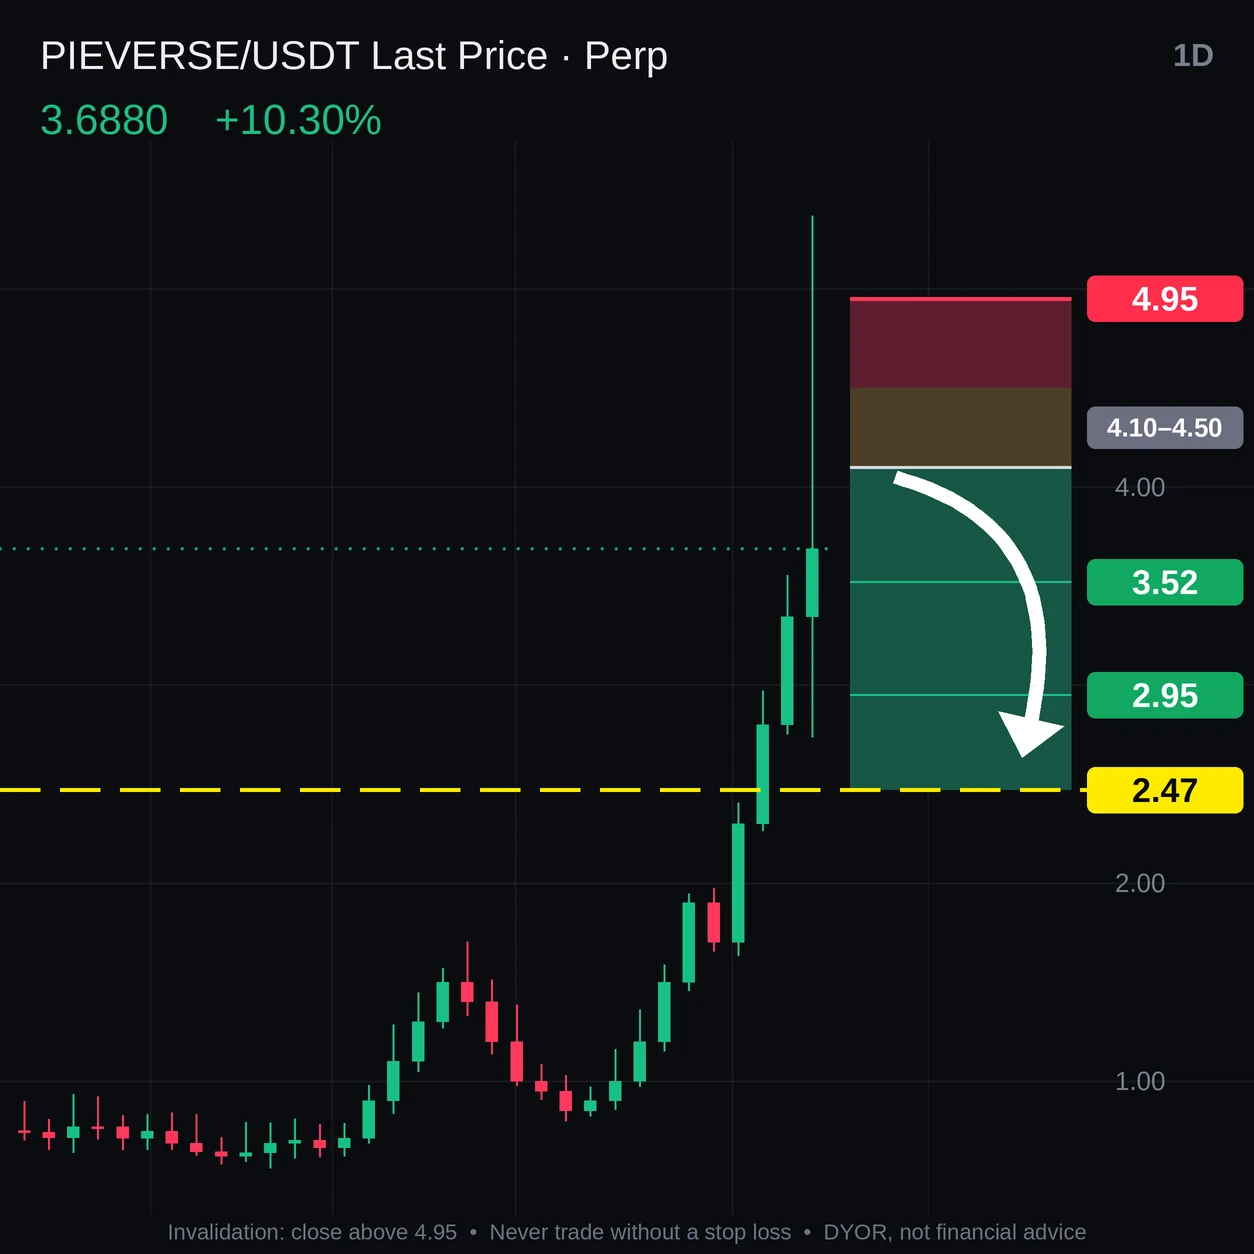
🔴 $PIEVERSE /USDT SHORT🔻😎 ‌
Entry: $3.85 – $4.05
SL: $4.35
TP1: $3.45
TP2: $3.15
TP3: $2.75
TP4: $2.40

A rejection around $3.85–$4.05 could strengthen the short setup, especially if momentum and volume begin fading.

⚠️ Invalidation zone: $4.30 – $4.35. A breakout and strong hold above this zone could invalidate the short idea.
post-image
PIEVERSE+0.50%
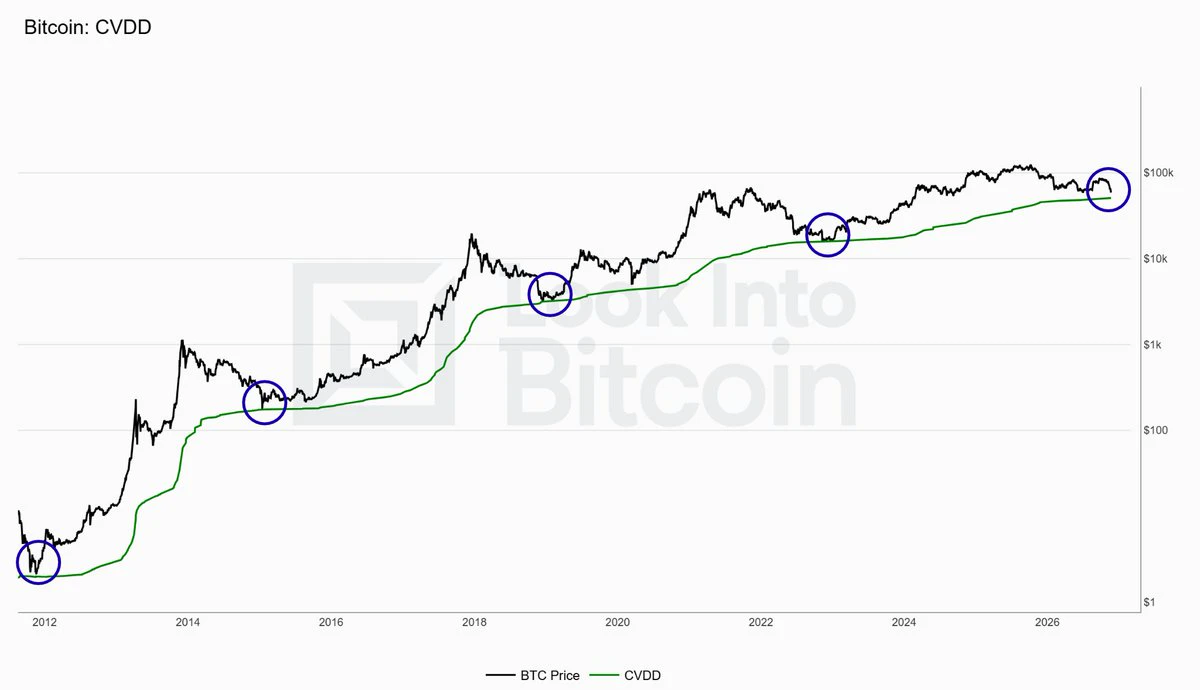
$BTC is trading near $61K while the CVDD model sits around $50K.
Every major cycle bottom since 2011 has formed near this on-chain floor.
post-image
BTC-0.67%
Crypto Markets Search for Stability After Forced Closures! What Could Improve Trading Conditions?
live-cover
LIVE1,397
SKHYV-0.98%
SPCX-7.38%
TSLA-7.56%
AAPL-1.83%
AMD-13.27%
evening updates about btc with skyvera
live-cover
LIVE2,943
BTC-0.67%
ETH-1.26%
SOL-0.77%
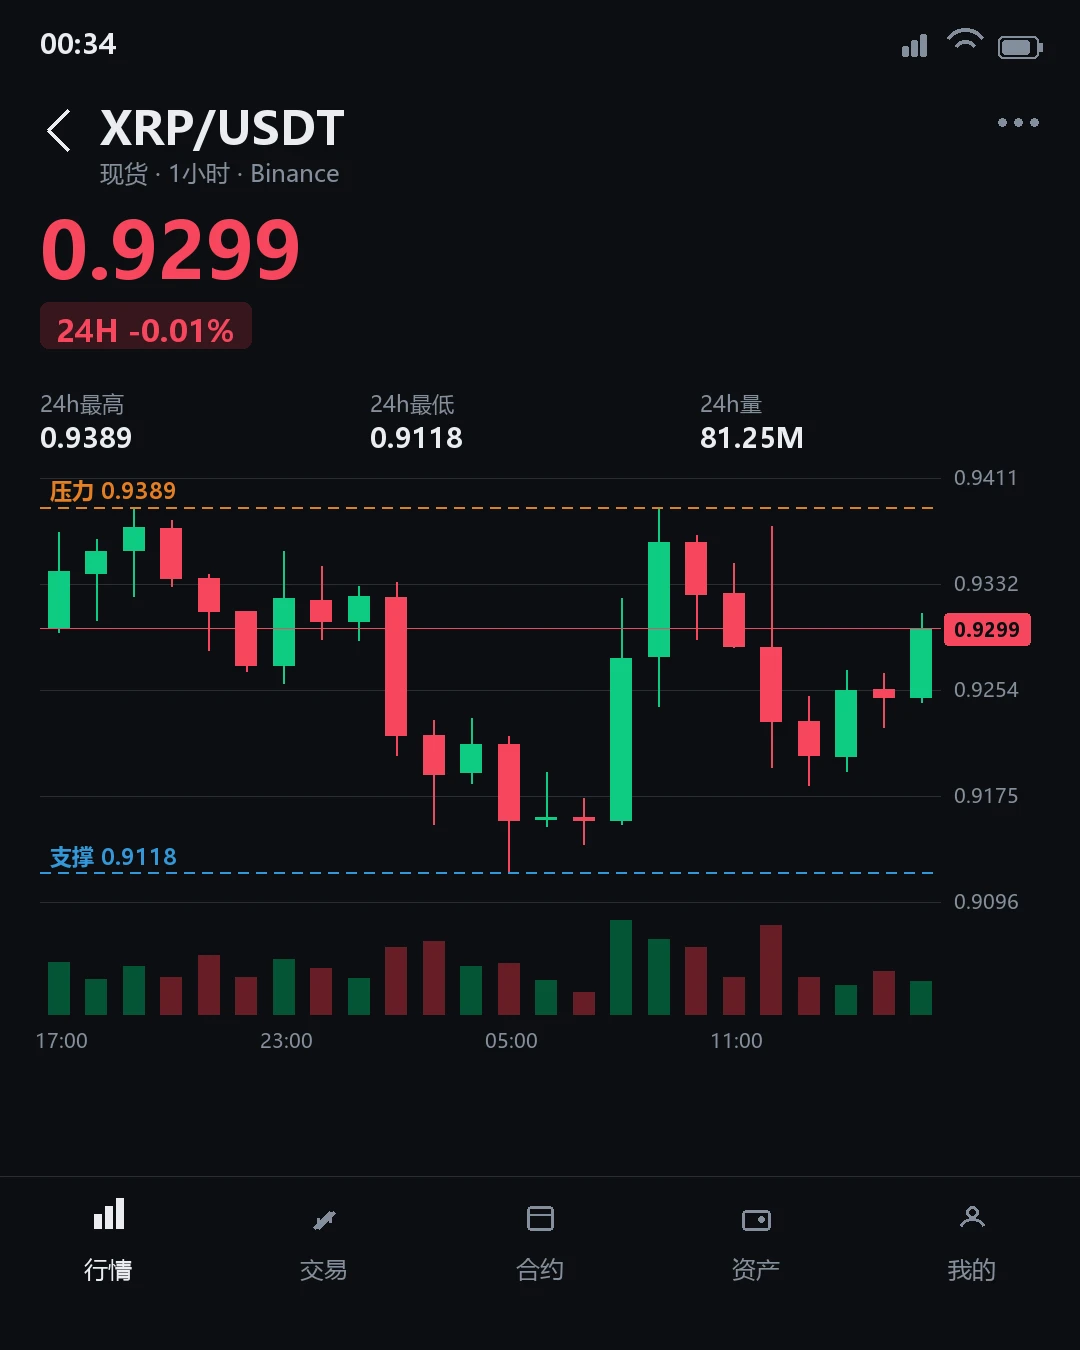
$XRP The current price is 0.9291, up 0.04% over the past 24 hours. However, the 1-hour timeframe looks strong, while the 4-hour timeframe looks weak, showing a clear divergence. The 1-hour RSI is 56.22, indicating short-term strength, while the 4-hour RSI is 44.16, indicating longer-term weakness. This conflict between timeframes can easily lead people to misread it as a trend reversal signal, when it may simply be short-term volatility.
I’d rather see this as direction not yet confirmed than rush to label it a rebound or pullback. The key thing to watch now is which timeframe changes directio
post-image
XRP-1.15%
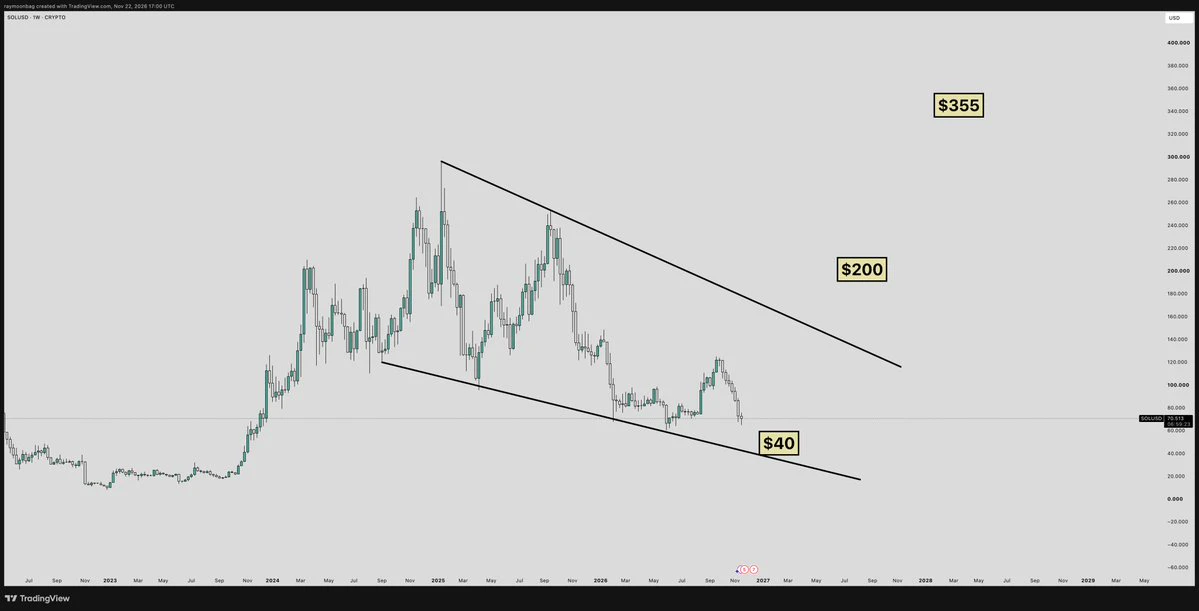
DCA'ing $SOL here
post-image
SOL-0.77%
#BTCReboundFaces60KTest
### BTC Rebound Faces $60K Test 🚀

Bitcoin is trying to make a strong recovery after facing heavy selling pressure. The market is now watching an important level of $60,000. This level could play a major role in the next move of Bitcoin. Traders and investors are waiting to see whether BTC can move above this level and continue its recovery.

Bitcoin has faced a difficult market situation. Sellers have pushed the price down, and many traders are still worried about further losses. However, every market correction also brings new opportunities and new questions. The im
post-image
BTC-0.67%
Load More

Join 40 M users in our growing community

⚡️ Join 40 M users in the crypto craze discussion

💬 Engage with your favorite top creators

👍 See what interests you

Trending Topics

BTCReboundFaces60KTest

2.2M Views30.1K Discussing

BTC rebounded from around $55,300 on November 21, briefly reclaiming $60,000 before pulling back to around $59,300. The $60K level is back in focus as traders assess whether the recovery can last. Is this rebound a sign of stabilization or a short-lived recovery? Would reclaiming and holding $60K be enough, or do you need confirmation from trading volume and fund flows?

PCEAndGDPDataNextWeek

260.6K Views2.6K Discussing

GateDirectIPOPhase3ANTAllocates92100Shares

852.2K Views5.1K Discussing
View More