
Square
Following
Hot
News
Profile
Share your thoughts
placeholder
Article
$GT ‌
Gate's derivatives trading data for September highlights the platform's growing momentum in this sector. Monthly derivatives trading volume reached $396.4 billion—a 38.2% increase from the previous month—marking the fastest growth rate among major exchanges.
This surge in volume has also translated into an expanded market share for Gate. The platform’s share of the derivatives market rose by 1.64 percentage points to reach 10.1%, securing it the third position in global rankings. This climb in the rankings reflects not only an increase in volume but also a highly competitive market posi
GT-0.19%
  • 1
  • 1
Everyone, listen‼️ Quickly open a second long position on $ETH
now.entry: $2,451 – $2,455targets: $2,465 / $2,480 / $2,500sl: $2,418
post-image
ETH+0.84%
Retail investor: Oil’s back over $100 & they’re hitting tankers in Hormuz again. I’m thinking about going to cash till it calms down
Me: When does it calm down?
Retail investor: idk... when the war’s over?
Me: Brent oil hit around $118 back in March when the strait shut down. Everybody was saying exactly what you’re saying...
Retail investor: & what happened?
Me: Nasdaq made a new all time high a few weeks later and now up over 30% from that point.
Retail investor: with all this still going on??
Me: Yep. The market doesn’t wait for the all clear. It moves as soon as it figures out earnings are
post-image
BZ-0.34%
NDAQ+1.57%
Kalshi's gold and silver perpetual futures, the first non-crypto perps the CFTC has allowed on a US regulated exchange, use Pyth as their sole price source. Pyth also powers Polymarket's real-world asset markets.
@PythNetwork
KALSHI+0.61%
XAU+1.72%
XAG+3.37%
CPI Comes in Hotter Than Expected
live-cover
LIVE69
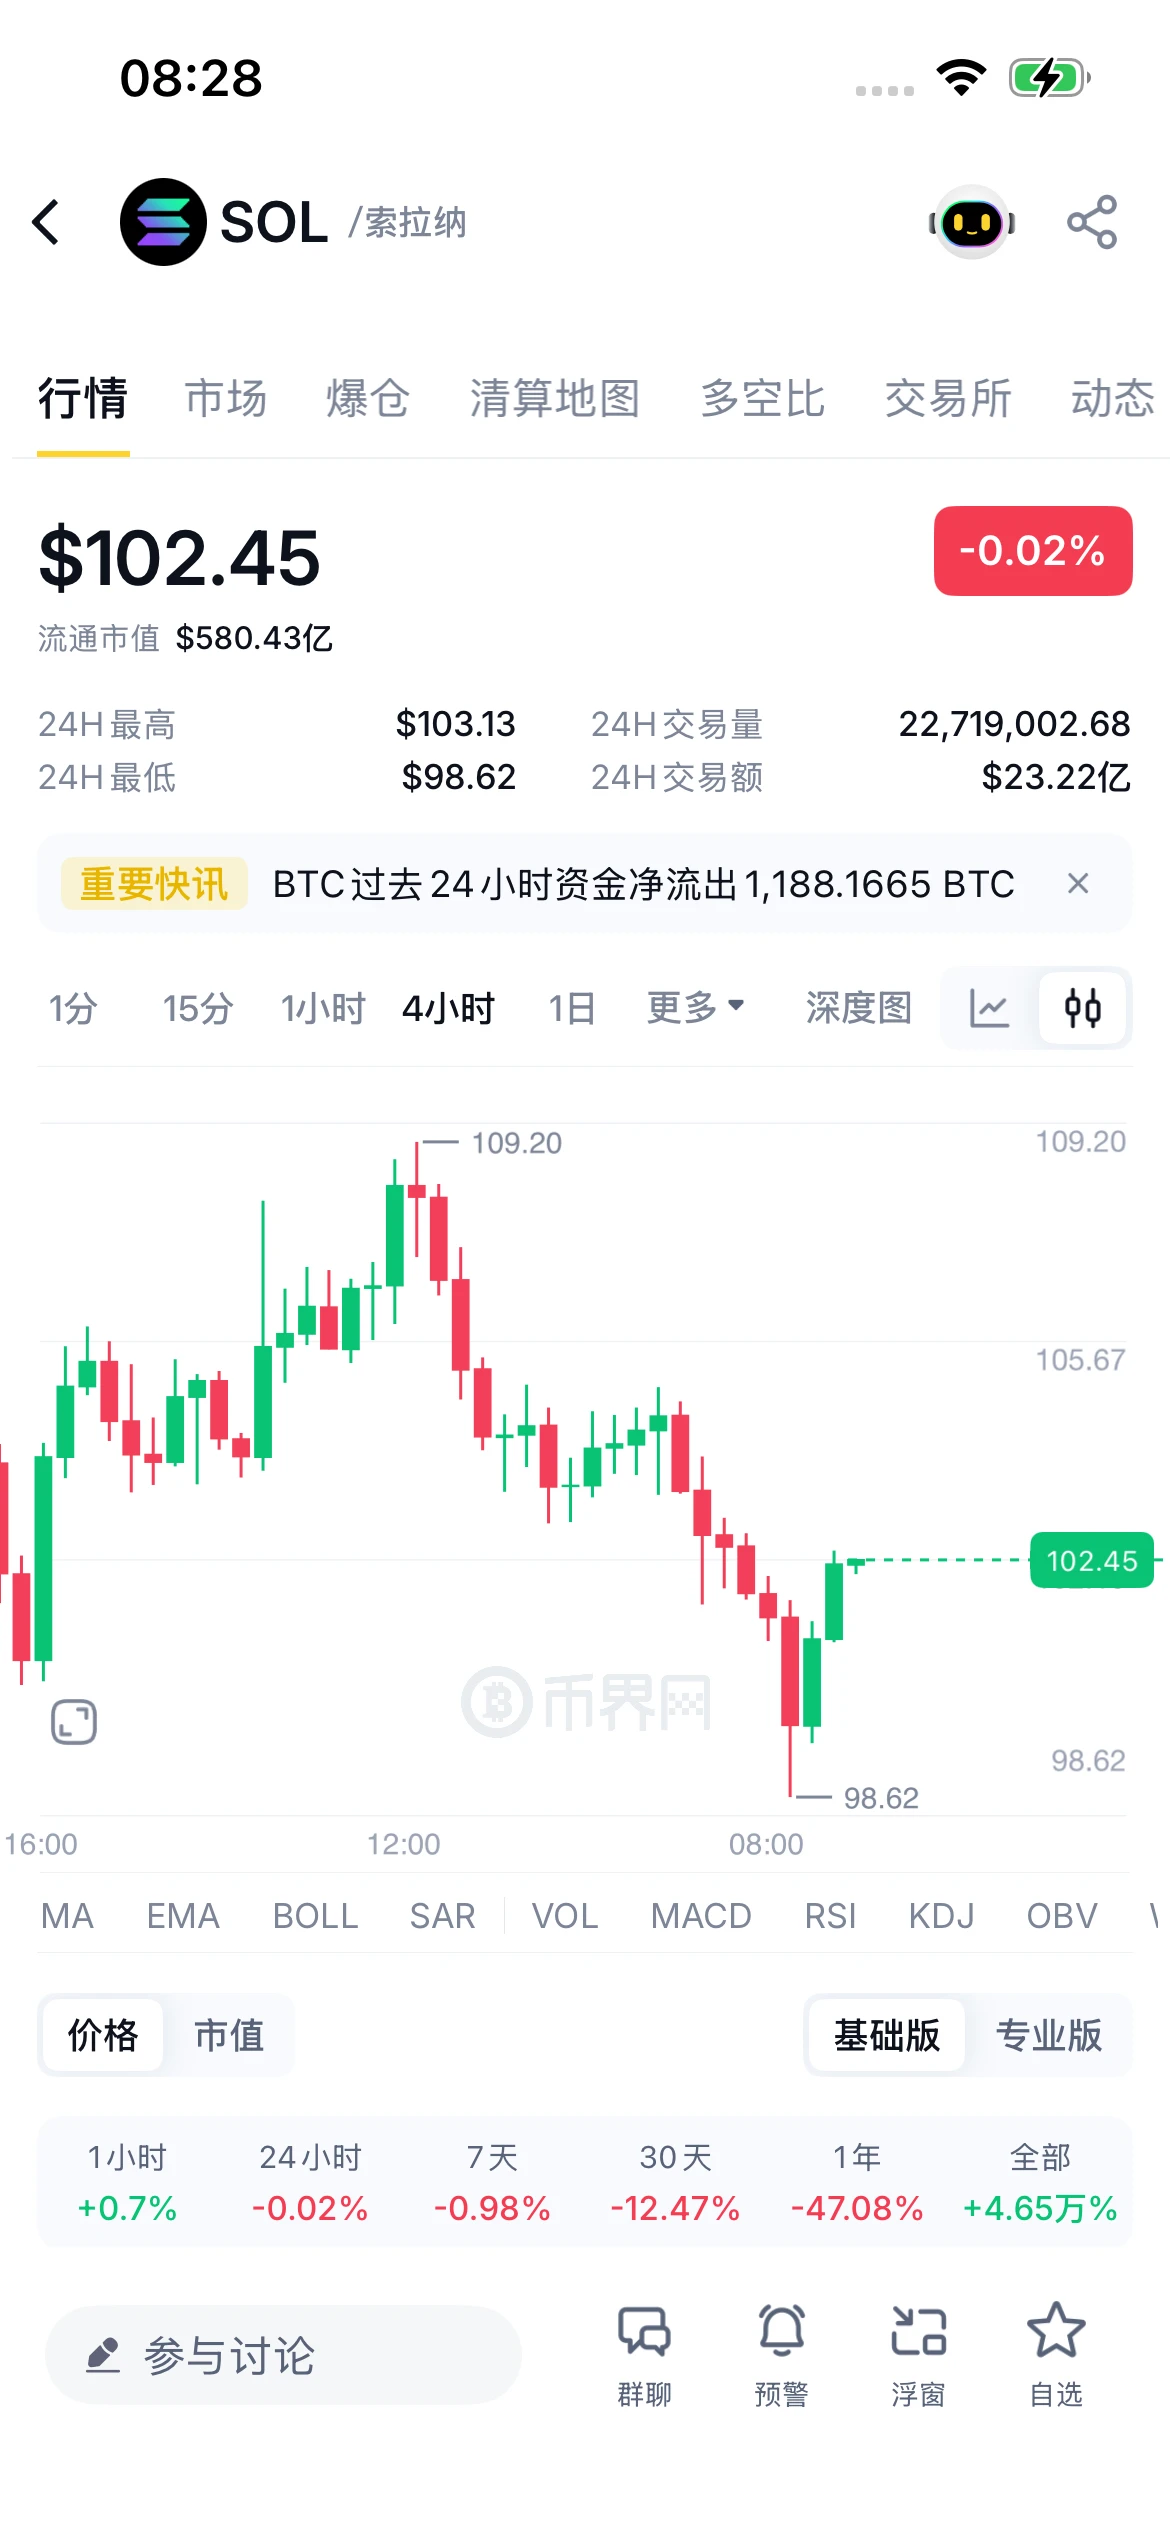
SOL oscillated downward from the earlier high of 124.99, with the intraday low dipping to 100.51 before a slight rebound, reaching a high of 106.49. This rebound is merely a minor corrective bounce during the decline; the overall broader downtrend channel remains intact, and a rebound to resistance presents an opportunity to enter short.

From the chart, the daily highs have been gradually moving lower, and the bearish trend structure remains intact. This rebound is only a brief pause amid the decline. MACD remains weak and trending downward, while heavy pressure from previously trapped posit
post-image
SOL+1.66%
JUST IN: 🚨 Billionaire real estate titan Grant Cardone just purchased $5,000,000 worth of Bitcoin.
His company now has almost 3,000 $BTC on its balance sheet.
BTC+0.60%
#Gate衍生品份额增幅全球第一
Like the brightest star in the sky, Gate shines ever brighter among crypto exchanges with each passing month.
Gate Ranks Among the World's Top 3 Derivatives Exchanges!
According to the September exchange review, Gate continues to strengthen its position in the global derivatives market.
Growth Leader: Recorded the highest growth rate among leading global centralized exchanges.
$396.4 Billion Trading Volume
September derivatives trading volume rose by 38.2% compared to the previous month, allowing it to surpass other crypto exchanges and secure third place globally.
10.1% Mark
post-image
Barclays, HSBC UK and Lloyds are among seven UK banks in GBTD, which made the first live customer payments in tokenised sterling on a platform built by Quant. They included two remortgages, with funds released at completion.
@quantnetwork
HSBC+0.62%
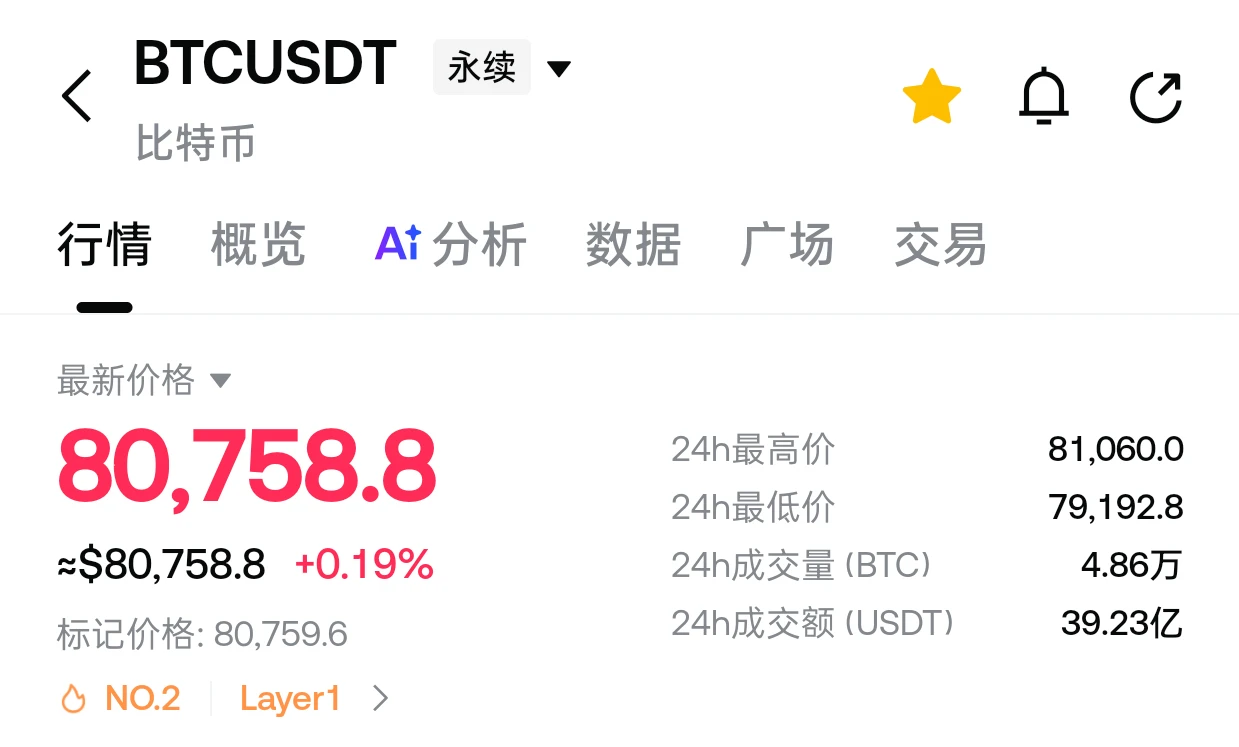
#美国9月PPI大超预期 Data beat expectations across the board, yet the market "isn't following the script": PPI came in at 6.3%, with BTC hanging by a thread at $80K—will this be "the end of bad news" or "stagflation panic"?

Actual data: U.S. September PPI rose 6.3% year-over-year (forecast 5.3%) and 1.3% month-over-month (forecast 0.5%)—the highest in more than four years; core PPI rose 5.0% year-over-year, while retail sales rose 0.8%, also beating expectations. All four readings "blew out the charts." But interestingly, the more explosive the data, the more "divided" the market became—U.S. Treasur
post-image
BTC+0.60%
XAU+1.72%
NDAQ+1.57%
DOW+1.59%
ING-0.59%
  • 10
Which step is $CRCLB’s latest rally most likely to fool you on?
$CRCLB There is a very typical debate right now: one side uses +8.96% over 24 hours to prove the direction, while the other counters with key levels. I’m not taking sides based on the rise or fall for now, because $CRCLB remains strong, while the crowded positioning is already out in the open and has yet to provide a complete answer. I acknowledge that the trend is strong, but what matters next is not how much higher it can surge, but whether anyone steps in during the first pullback.
Laying out the chart, the current price is 86.
post-image
Intraday, Ethereum pulled back toward around 2480, hitting a low of 2322 before recovering and rebounding, but the broader bearish trend remains unchanged. The rebound is only a brief bounce during the decline, with clear overhead selling pressure.
From the current chart, the main bearish structure on the daily timeframe remains intact. This rebound is merely a brief recovery after the rapid dip, while MACD remains bearish.
On the 4-hour timeframe, the price has risen close to the upper Bollinger Band, while bullish momentum is gradually fading and the rebound is weakening. On the 1-hour timef
post-image
ETH+0.84%
BAT pumping to 25 cents
post-image
BTC is currently around 82400; after the previous pullback, it has staged a short-term corrective rebound, but the upside follow-through is weak. This is a technical recovery after the decline, with no trend reversal signal appearing for now. The broader structure remains range-bound with a bearish bias.

On the 4-hour chart, the price is below the moving averages, and rebound volume is insufficient, indicating a weak consolidative recovery. The overhead resistance zone is substantial. As long as the price fails to firmly hold above resistance, this rebound is more likely to be a continuation
post-image
BTC+0.61%
While XRP has seen significant developments on the institutional front, its price has followed a more cautious trend. Despite approximately $1.8 billion in net inflows into XRP exchange-traded products (ETPs) over the past 13 weeks, the token’s price currently sits at $1.39—a decline of over 8% in the last week alone. This divergence raises a fundamental question that is now at the forefront of investors' minds.
The developments on the institutional side are noteworthy. Evernode—a company holding 473 million XRP and $300 million in cash—has begun trading on the Nasdaq under the ticker symbol X
post-image
XRP+1.19%
  • 2
  • 1
( new streamer) market overview
live-cover
LIVE1,573
peak lighting on the streets of north kolkata
Why is INJ so strong?? wtf is going on over there, has tech changed??
post-image
INJ+9.18%
Ok what the hell one more time!
LFG!!!!
Load More

Join 40 M users in our growing community

⚡️ Join 40 M users in the crypto craze discussion

💬 Engage with your favorite top creators

👍 See what interests you

Trending Topics

USSeptemberPPIBeatsExpectations

91.35k Views1.87k Discussing

US September PPI came in at 6.3% YoY, well above the 5.3% market expectation, pointing to renewed producer-side inflation pressure. Weekly jobless claims were 199K, broadly in line with forecasts. Could hotter inflation further reduce room for rate cuts, and what does it mean for $BTC, US stocks, and gold?

DrLinHanSpeaksAtOxfordUnion

135.63k Views1.86k Discussing

JapanAndKoreaStocksPlunge

47.27k Views1.76k Discussing

View More