
Square
Following
Hot
News
Notifications
Profile
Share your thoughts
placeholder
Article
$INIT SHOWS STRENGTH AFTER 32% RALLY — CAN BUYERS PUSH TOWARD $0.15?
INIT is showing encouraging bullish momentum following its recent 32% surge. Buyers are attempting to maintain control, with the $0.1320 area becoming an important level to watch.

As long as price stays above this zone, the recovery structure remains constructive. A move above $0.1397 could attract additional buying interest and create room for a continuation toward $0.1450 and potentially $0.1520.

Key figures

$0.1320–$0.1340 — Important support and price-holding zone.

$0.1397 — Key resistance and bullish breakout level.
post-image
INIT-2.53%
  • 2
  • 2
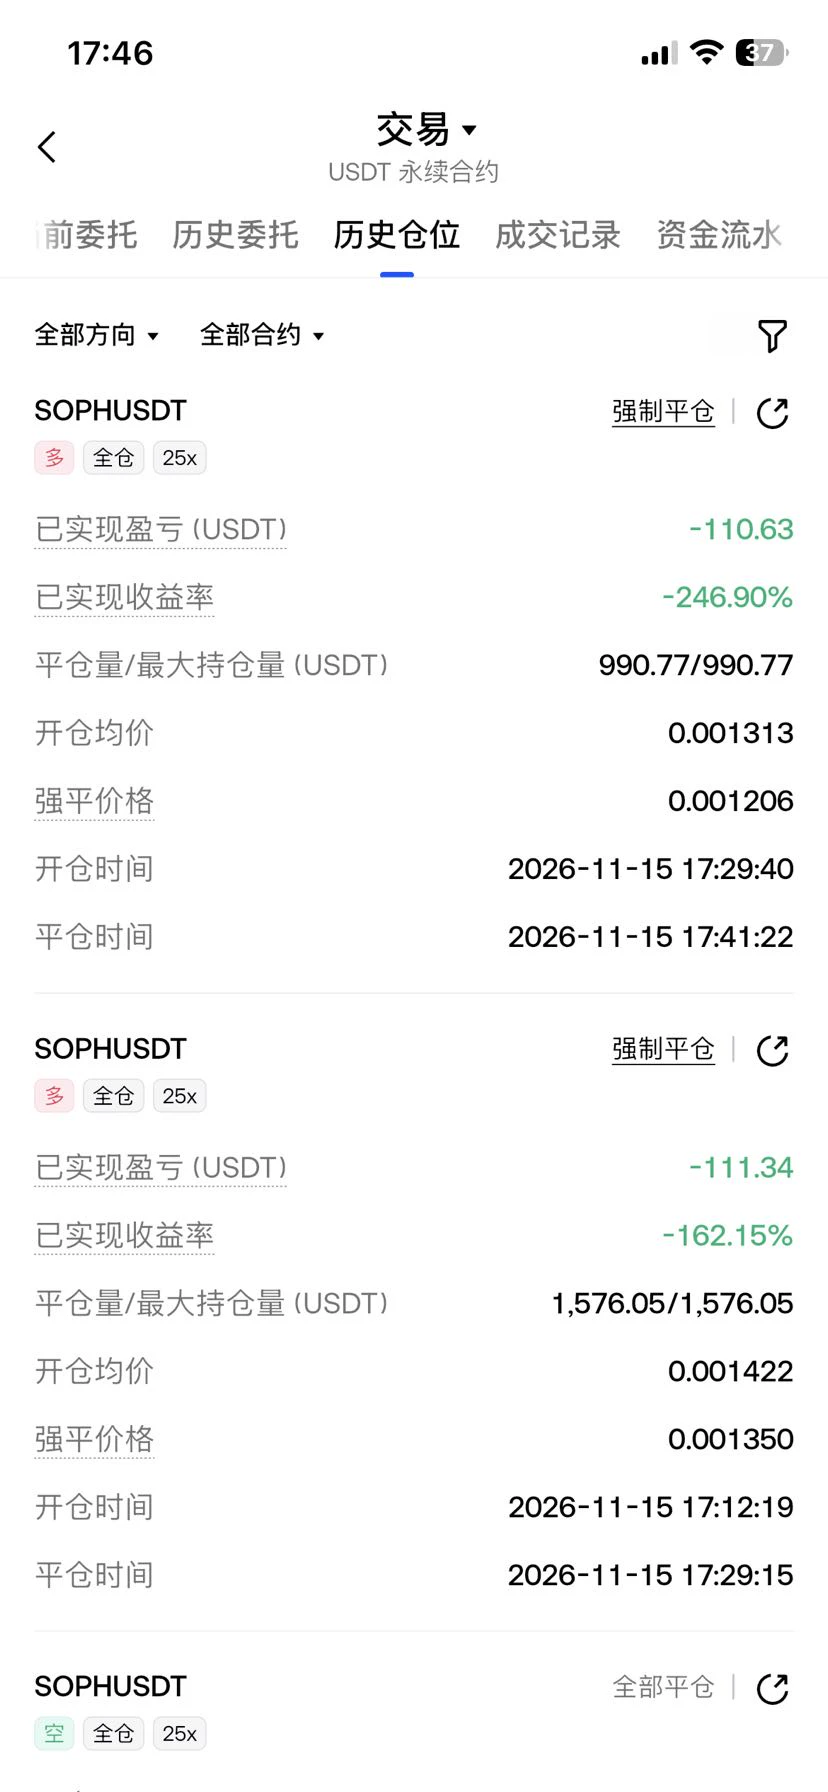
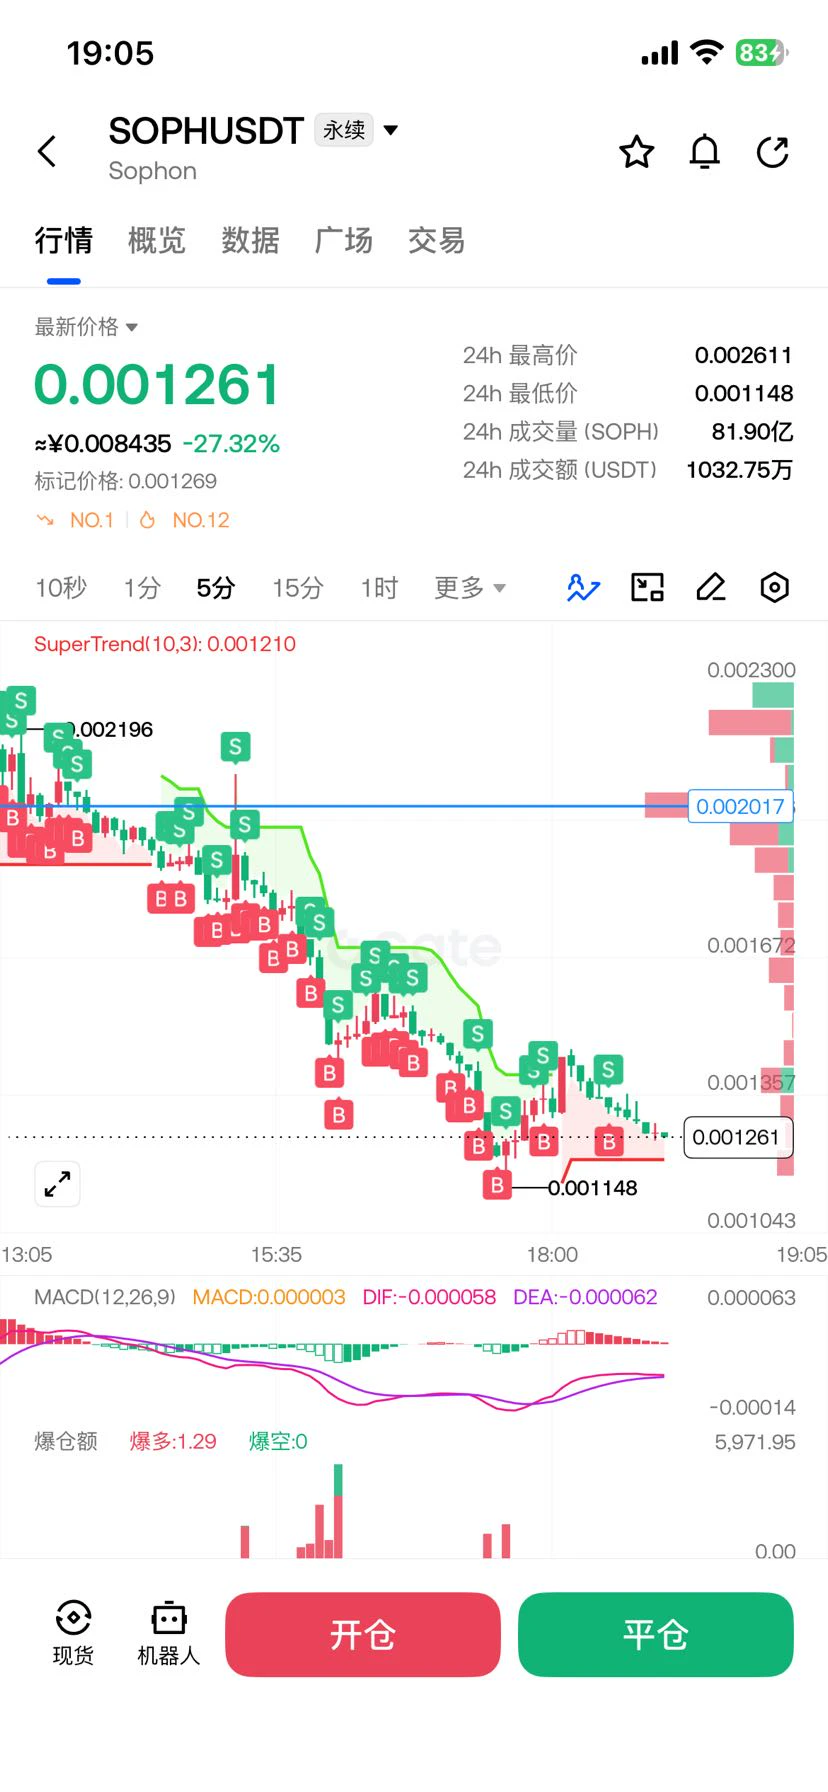
$SOPH I got badly ripped off today
post-image
SOPH-3.83%
Trenches
Snoopy
S
bade
b
Snoopy
7mEh...47Cn
Market Cap
$.
Change
.
24h Vol
$.
Holders
.
mihao
m
bade
b
mihao
4Cxj...pump
Market Cap
$.
Change
.
24h Vol
$.
Holders
.
bill
b
bade
b
bill
85Rh...pump
Market Cap
$.
Change
.
24h Vol
$.
Holders
.
AGT
A
bade
b
AGT
0x5d...e274
Market Cap
$.
Change
.
24h Vol
$.
Holders
.
PIEVERSE
P
bade
b
PIEVERSE
0x0e...25a9
Market Cap
$.
Change
.
24h Vol
$.
Holders
.
$SOPH All are flash liquidations.
post-image
SOPH-3.83%
The shorts were protected at the end, and the longs got their revenge, haha
post-image
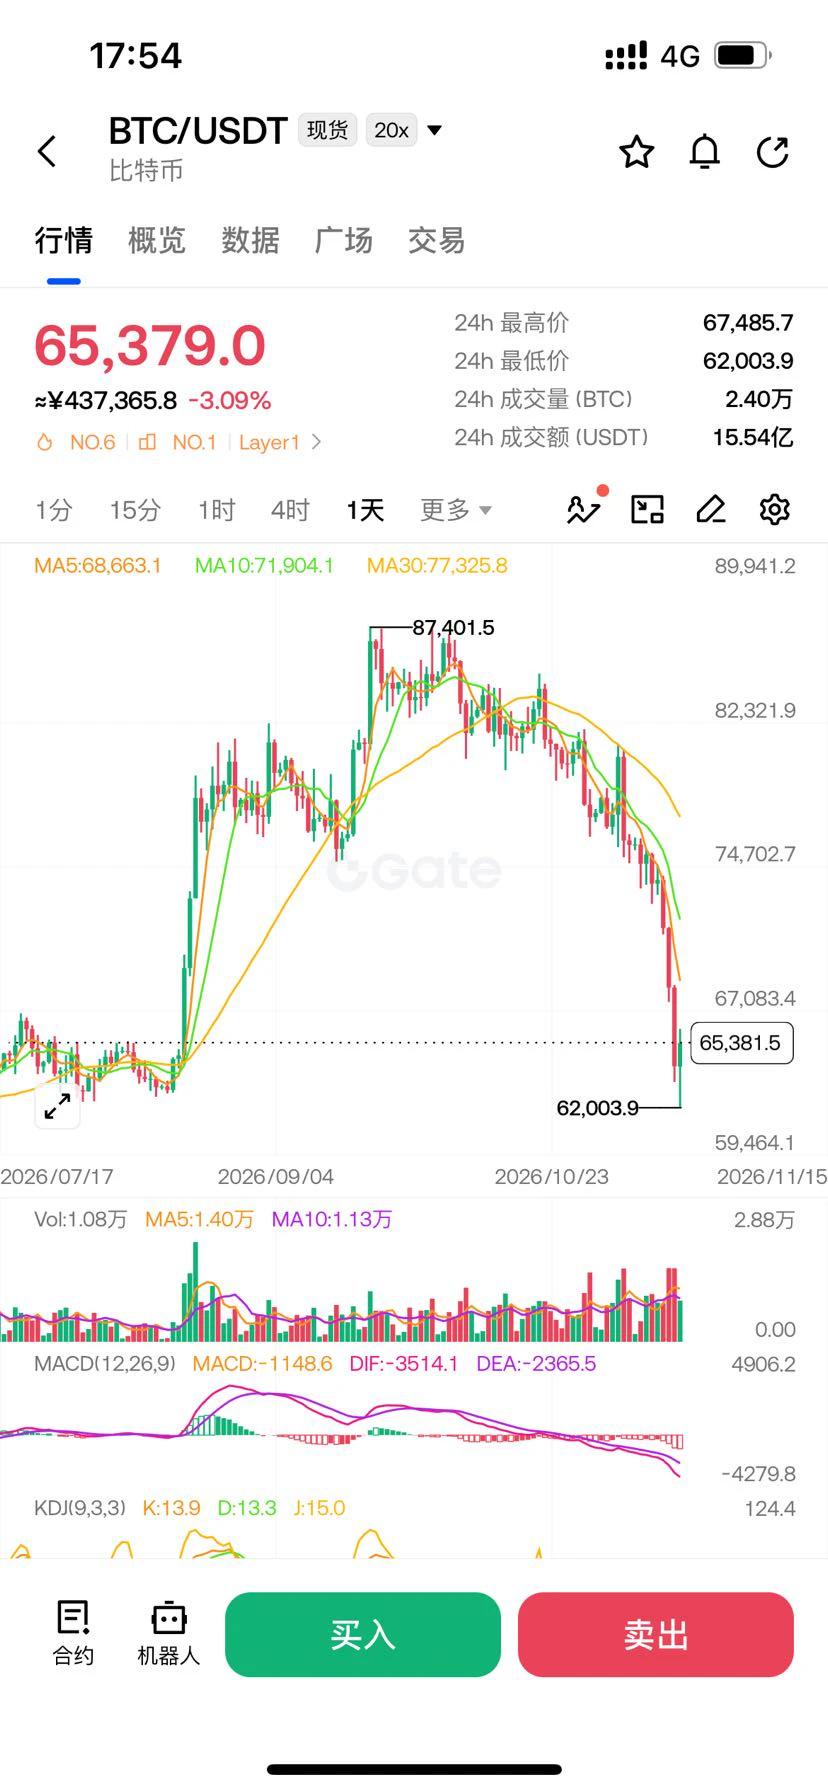
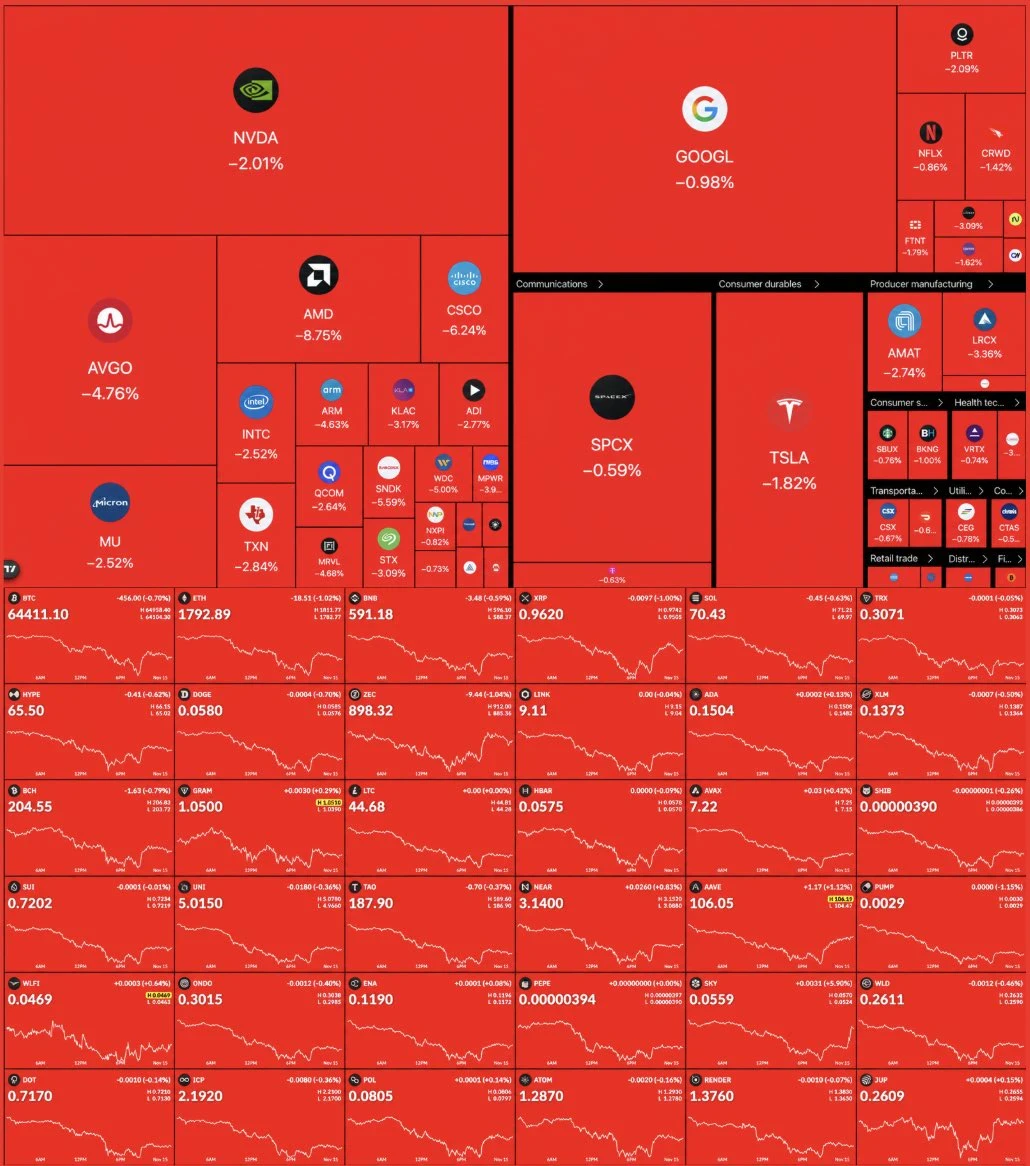
$BTC Here's a joke. October had barely started when a few smaller exchanges couldn't hold on and shut down; then an exchange got hacked; election results came out at the start of the month, and the market hit the gas and plunged instead; then another rate hike landed a blow. Lao Huang resigned, Anthropic is gearing up to go public and siphon off liquidity, and one thing after another came crashing down, as if they'd all planned it. I saw one guy say: “Numb—numb as in scalp-numbing numb.” Spot on.

Now we're just above 65,000, down 13% in seven days and 25% from the six-month high, but over a s
post-image
BTC-0.67%
  • 7
That funding rate at 2 a.m. was insanely negative—longs got absolutely crushed. But what really determines tomorrow’s direction isn’t the futures market; it’s the Fed’s decision at 2 p.m. Cut rates, and risk assets get some breathing room; hold steady, and we grind sideways; actually hike, and tech stocks get wrecked first. It’s that simple. Don’t ask why. Save this, and come back tomorrow to see if it checks out.
post-image
  • 1
ZEC market prediction update
live-cover
LIVE1,411
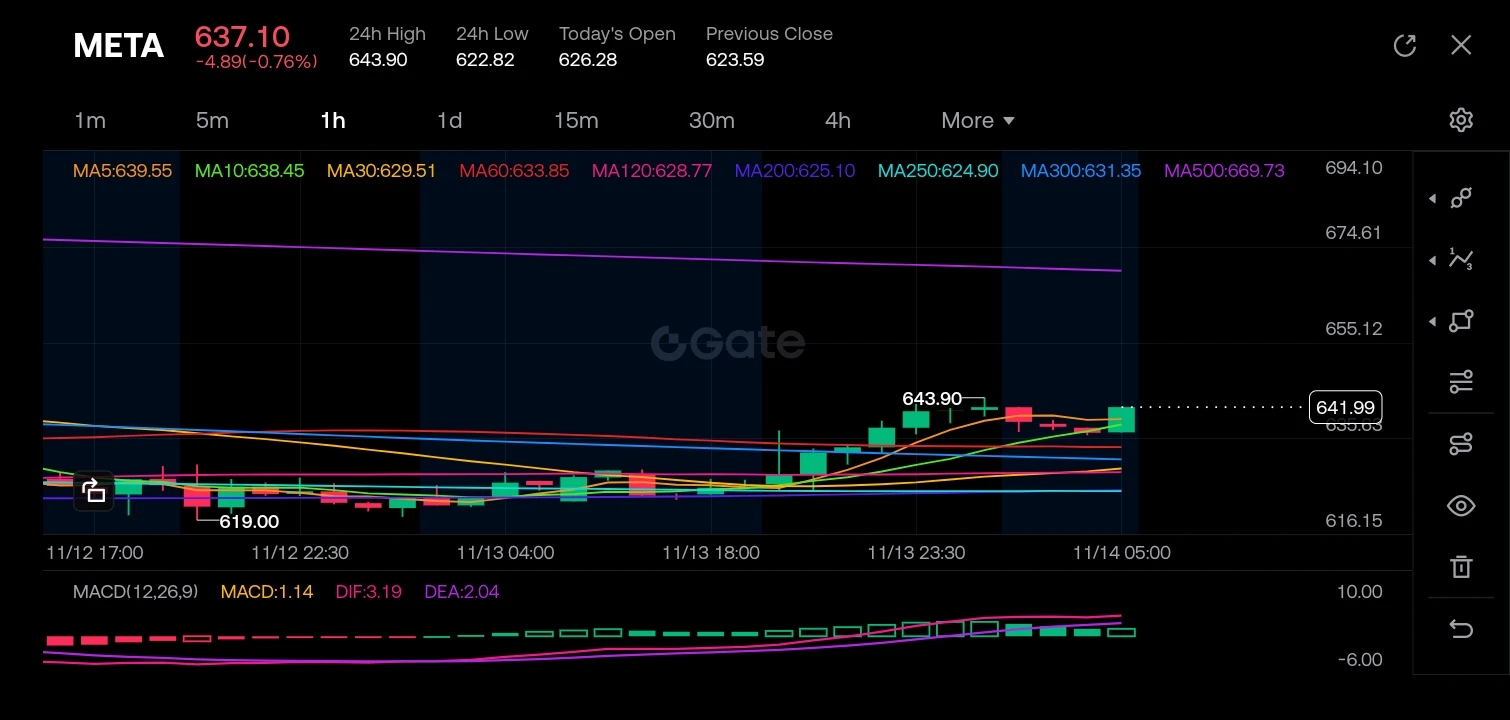
$META ‌
The structural mapping reveals a classic "V-bottom" recovery after a period of consolidation and a slight downtrend. Price action found a hard floor at the 619.00 level, which coincided with the blue MA200 (625.10) and green MA250 (624.90) acting as dynamic support. Following this bounce, the asset established a higher low structure, aggressively breaking through the shorter-term moving averages (MA5, MA10, MA30) which are now curling upward and crossing bullishly. The price is currently testing a local resistance zone around 643.90, pushing against the red MA60 (633.85) and the longe
post-image
META+2.95%
$ARIA recorded a $1.1412K short liquidation at $0.23696, suggesting that bearish positions are getting squeezed. The $0.2350–$0.2370 zone is the key area to monitor, with $0.2450 and $0.2550 as potential resistance levels. 🎯 Targets: $0.2450 → $0.2550 → $0.2650. Support sits around $0.2300, followed by $0.2220. Stop-loss: $0.2280 for a conditional long setup. Next move: A sustained move above $0.2450 could attract additional buying pressure.$NVDA ‌$TSLA
post-image
ARIA+22.03%
NVDA-1.92%
TSLA-1.86%
Short QNT$QNT at 151.2–152.0 on the 4H chart. Watch whether sellers enter here. The trend structure still favors sellers staying in control near 152. I’ll watch for a rejection. My view is invalidated if the closing price is above 158. Short 151.2–152.0 TP 147.9 / 145.5 / 141.8 SL 157.7- 4H chart price is at 152, below the 171 EMA50, with sellers in control.- Risk 4.0% to reach the SL, versus 6.5% for TP3; the risk-reward ratio to the final target is 1.6R.- 1H RSI is 54, momentum is neutral, and a pullback may occur. Could this be an entry opportunity for sellers? This is a trading plan, not
post-image
QNT+4.79%
🇩🇪 GERMANY PASSES BILL TO FREEZE €100K+ IN SUSPECTED CRYPTO ASSETS!
↳ Customs can freeze assets for up to 180 days
↳ Exchanges can receive direct freeze orders
↳ Self-custody wallets remain harder to freeze
↳ Bundesrat approval still pending
↳ Proposed effective date: Jan 1, 2027
Anti-money laundering move or threat to crypto privacy?
post-image
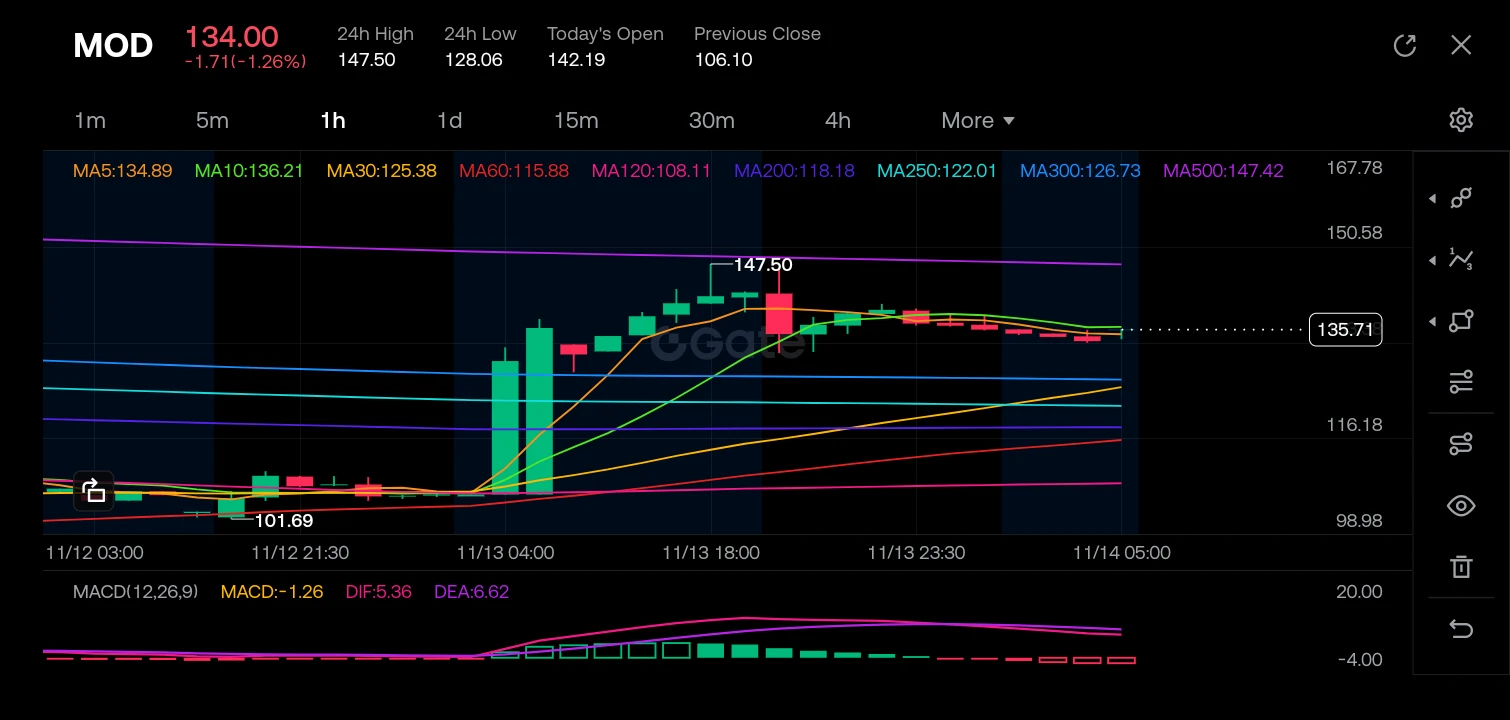
$MOD ‌
The chart displays a massive, high-volume bullish breakout from a consolidation zone around the 101.69 level, characterized by consecutive strong green candles that pushed the price to a peak of 147.50. Following this aggressive upward impulse, the price has entered a consolidation and slight retracement phase, currently trading at 134.00. The price is hovering just below the shorter-term moving averages (MA5 at 134.89 and MA10 at 136.21), which are beginning to curl downward, indicating short-term momentum loss. However, it remains well above the longer-term MAs (MA30 at 125.38 and MA
post-image
MOD+27.90%
  • 2
  • 2
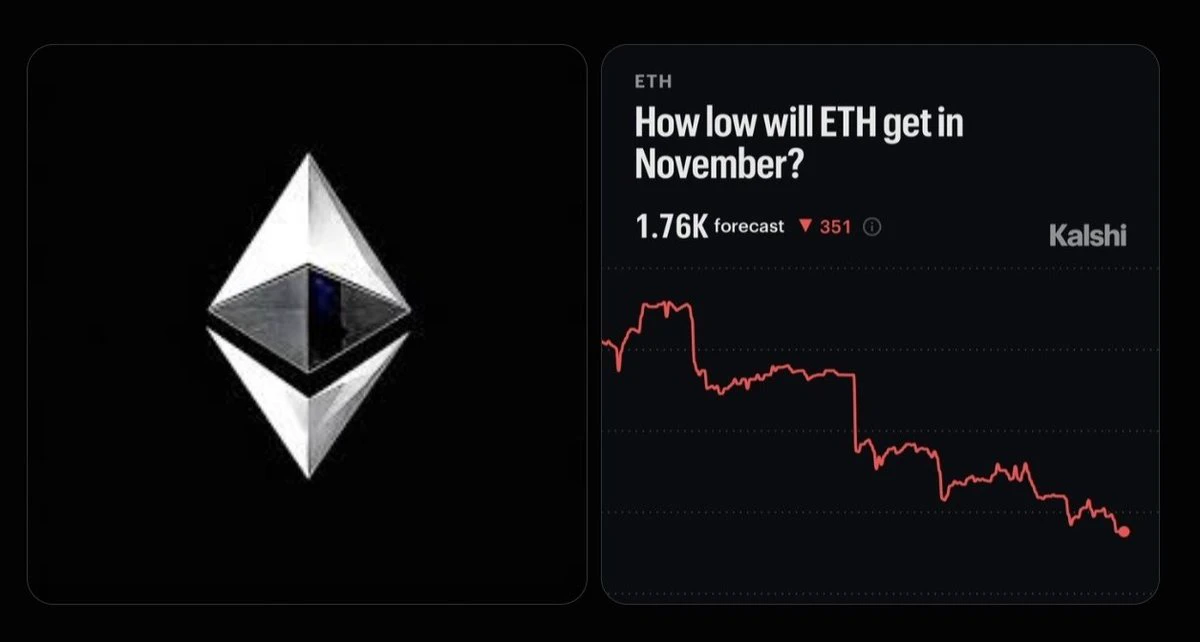
🚨 JUST IN: ETH COULD DROP TO $1,760 THIS MONTH! 📉
KALSHI TRADERS ARE NOW PRICING IN A POTENTIAL LOW OF $1.76K FOR ETHEREUM. 👀
post-image
ETH-1.26%
KALSHI+0.00%
The Ethereum Foundation sells another 2,500 ETH, bringing its total sales to 7,500 ETH over four day
live-cover
LIVE1,646
At this price, sellers seem to be exhausted. $SOPH 's downward momentum also looks close to running out, and some buying interest is finally starting to emerge. That's not to say it'll go to the moon, but a sudden, rapid rebound at this point wouldn't be surprising. Take profit: 0.0014 Stop loss: 0.0012 Worth noting: $BTC : Current price 65,533.3 - 24-hour change: -2.58%$JELLYJELLY : Current price 0.04468 - 24-hour change: +13.14%
post-image
SOPH-3.83%
🚨 INSANE CRASH:

$600 BILLION wiped from crypto and over $1 TRILLION from US tech stocks since the US midterms.

Brutal.

‍#Dr.HanOxfordUnionSpeech
‍#GateIPOAccessAnthropic
post-image
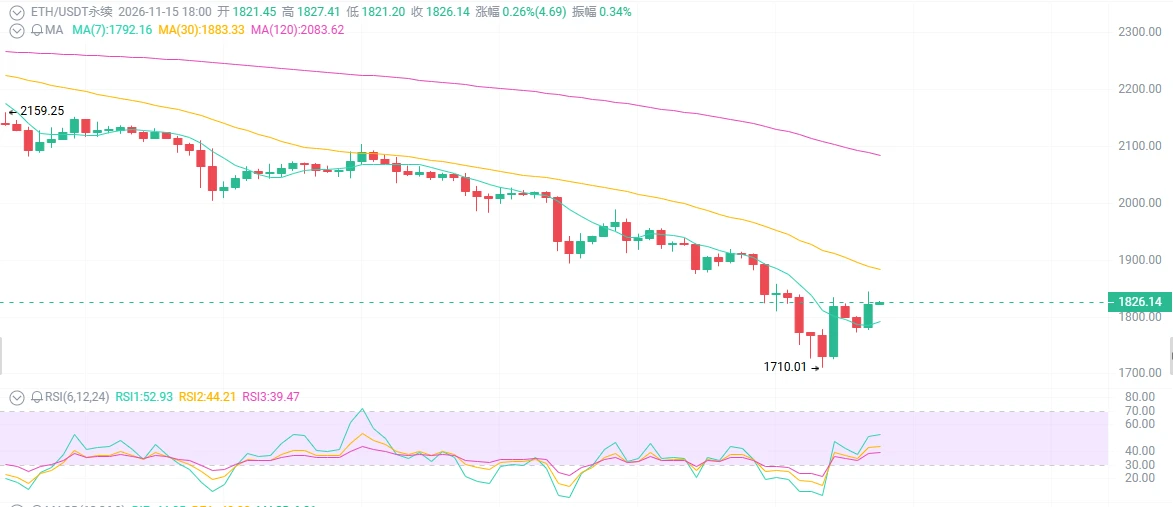
ETH at $1,826—are you panicking?

The Foundation is still selling, ETFs are still seeing outflows, and more than $200 million in positions were liquidated in 24 hours. The price just hit a new low for July. But just as everyone is shouting “ETH is done,” someone is quietly scooping up tens of thousands of coins. Is this a bottomless pit or a golden opportunity?

First, the surface: it’s fallen so far it’s unrecognizable
ETH is now at $1,826, down more than 60% from its August 2025 all-time high of $4,946. It just clawed back a little from around $1,710. The daily chart is all red candles, the
post-image
BTC-0.67%
ETH-1.26%
SOL-0.77%
NVDA-1.92%
◆ Next Week's Key Events Week Calendar | 11-15

Next week, watch NVDA's $4,005B earnings and the Fed meeting minutes: whether the AI lead can continue with rates constrained remains to be tested. A hawkish set of minutes would push up 10-year yields and DXY, weighing on high-valuation sectors.

Next week hinges on NVDA's $4,005B earnings and the 11-19 Fed minutes: whether the AI lead holds with rates still constrained. A hawkish read lifts the 10-Year yield and DXY, pressuring high-multiple sectors.
post-image
NVDA-1.92%
Load More

Join 40 M users in our growing community

⚡️ Join 40 M users in the crypto craze discussion

💬 Engage with your favorite top creators

👍 See what interests you

Trending Topics

GateIPOAccessAnthropic

350.2K Views2.7K Discussing

Gate IPO Access Phase 3 features Anthropic (ANT), with USDT subscription interest starting from 100 USDT. Successful allocations will be delivered as real shares to Gate Stock Accounts. Indicative price: $70–$78/share Subscription: Nov 12–17 (UTC+8) Allocation is not guaranteed. Please manage risk accordingly.

Dr.HanOxfordUnionSpeech

151.3K Views510 Discussing

USOctoberPPIBelowExpectations

481.4K Views1.4K Discussing

View More