Square
Following
Hot
News
Notifications
Profile
Share your thoughts
placeholder
Article
$BTC When you see sideways trading, either short or run.
BTC-0.67%
  • 1
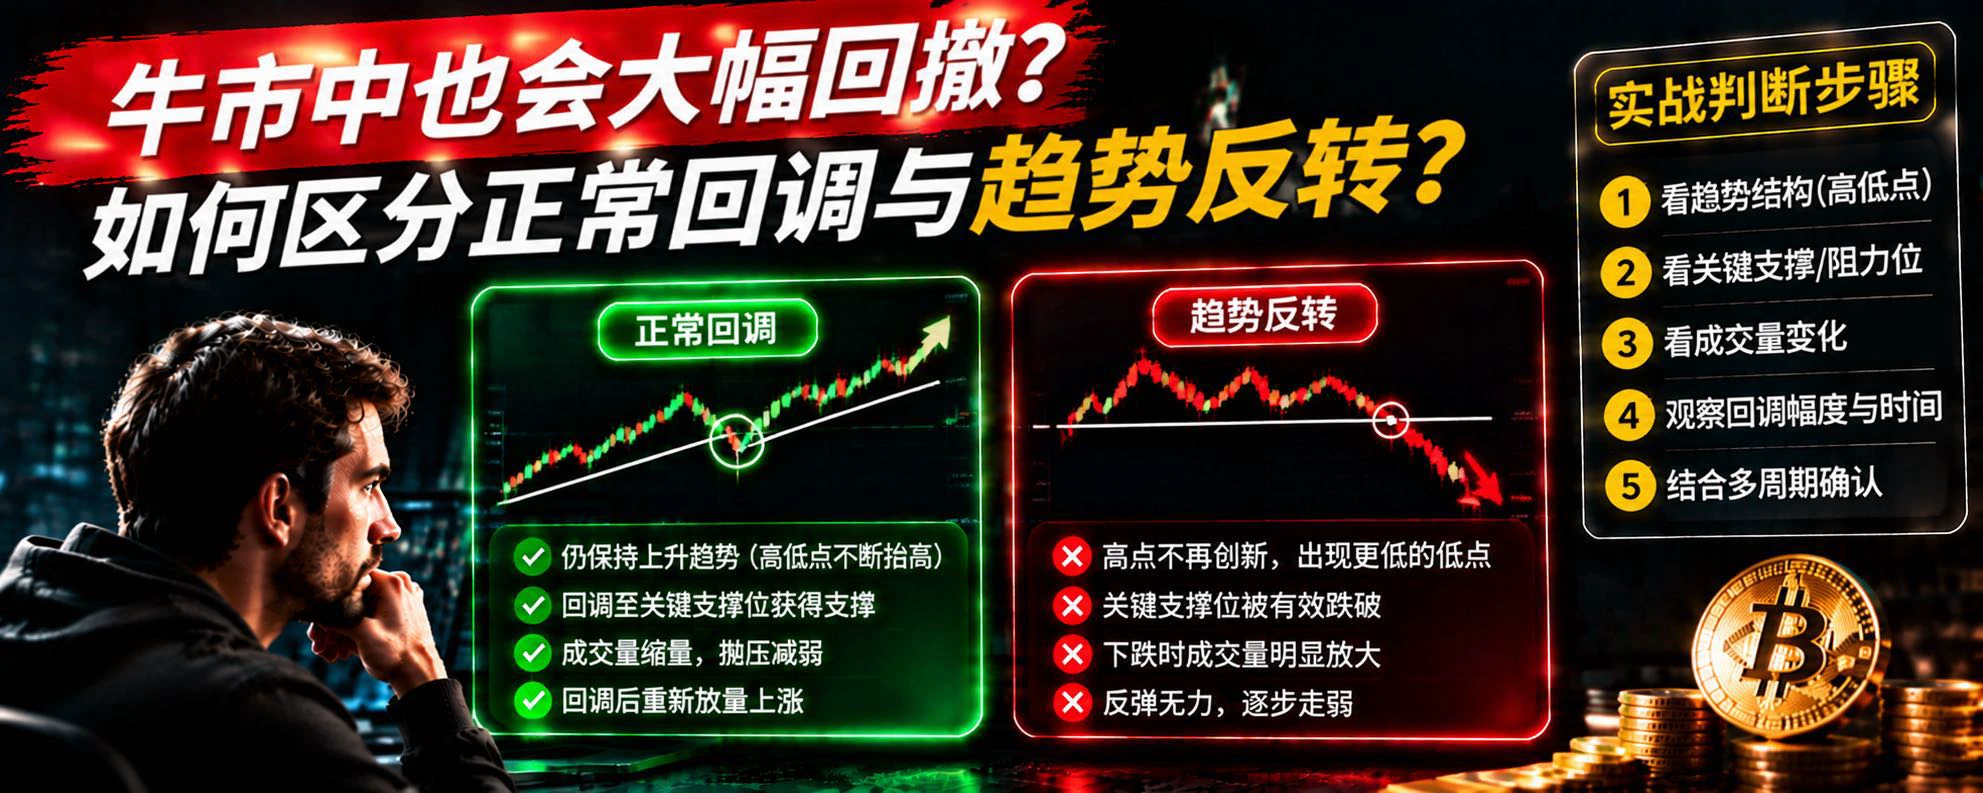
Can sharp pullbacks occur even in a bull market? How can you distinguish a normal correction from a trend reversal?

In the cryptocurrency market, many traders have experienced this: BTC rises for a while, then suddenly suffers a sharp drop. Some see it as a normal correction and continue holding; others think the bull market is over and rush to sell.

But how can you tell?

First, observe the market structure. In a healthy uptrend, prices typically form progressively higher highs and higher lows. Even when a correction occurs, as long as key lows have not been decisively broken, the upward st
post-image
BTC-0.67%
Trenches
FOOD
F
bade
b
FOOD
FTu5...pump
Market Cap
$.
Change
.
24h Vol
$.
Holders
.
mihao
m
bade
b
mihao
4Cxj...pump
Market Cap
$.
Change
.
24h Vol
$.
Holders
.
AGT
A
bade
b
AGT
0x5d...e274
Market Cap
$.
Change
.
24h Vol
$.
Holders
.
IDOL
I
bade
b
IDOL
0x3b...ab07
Market Cap
$.
Change
.
24h Vol
$.
Holders
.
Sakura
S
bade
b
Sakura
9sFG...pump
Market Cap
$.
Change
.
24h Vol
$.
Holders
.
MARKET UPDATE
live-cover
LIVE1,005
$DODOX Already up 65%, but is it finally time to wait for a more attractive pullback confirmation? Today's notable movers: $TAC : Current price 0.001299 - 24-hour change: +43.06%$ZEC : Current price 924.53 - 24-hour change: -2.90%
post-image
DODOX
DODOXDODOX
Pump.Fun
MC:$3.17KHolders:86
6.67%
TAC-2.72%
$BTC The 1-hour chart has just completed its second pullback, with the price touching the 68000 area again. However, the rebound is noticeably weaker this time, and the bulls have failed to quickly push the price back up. If you want to enter at this level, consider testing the waters with a small position first rather than rushing to size up. On the daily chart, the RSI has entered oversold territory, suggesting that downside room is relatively limited. I personally expect BTC to dip first and test around 66000, shake out weak hands, and then start rising. Risk warning: The above is only my
post-image
BTC-0.67%
#GateIPOAccessAnthropic #ShareWeekly
Anthropic IPO Access Through Gate: A Landmark Opportunity for Everyday Investors in One of the World’s Leading AI Companies

An Initial Public Offering (IPO) marks the historic moment when a private company first offers its shares to public investors, transforming exclusive ownership into a publicly traded opportunity. For years, access to elite technology companies remained largely reserved for institutional players and high-net-worth individuals. That barrier is now shifting. Through Gate’s IPO Access program, ordinary investors can participate in the An
  • 3
In the cryptocurrency market, many people look for trading opportunities every day, but few take the time to create a trading plan. They go long when they see BTC rising and short when they see prices falling, then start doubting their judgment as soon as the market moves slightly against them. This kind of planless trading can easily leave an account stuck in a cycle of repeated losses.

So, what should a truly effective trading plan include?

First, define your trading direction. Before entering a trade, analyze whether the market is currently trending up, trending down, or moving sideways.
post-image
BTC-0.67%
#黄仁勋辞职 #每周来晒 NVIDIA’s “Near-Term Worries and Long-Term Concerns” After Jensen Huang’s Departure

On November 12, an announcement from NVIDIA declared the end of an era: Jensen Huang resigned as CEO, and Colette Kress, the company’s current executive vice president and CFO, was named interim CEO until a permanent successor is chosen. The board simultaneously began a search for candidates from both inside and outside the company.
After the news broke, NVIDIA shares plunged as much as about 14% intraday, before narrowing their losses to 4.34% by the close. The company still lost about $182 billio
NVDA-1.92%
  • 5
[new streamer]MARKET UPDATE
live-cover
LIVE1,510
The Musk-themed Little Puppy meme coin appeared out of nowhere within one minute of Musk’s “l love you puppies” tweet, its contract ending in 6eb2, listed on more than a dozen exchanges, with communities now building continuously in over 50 countries, making it worth accumulating at low levels
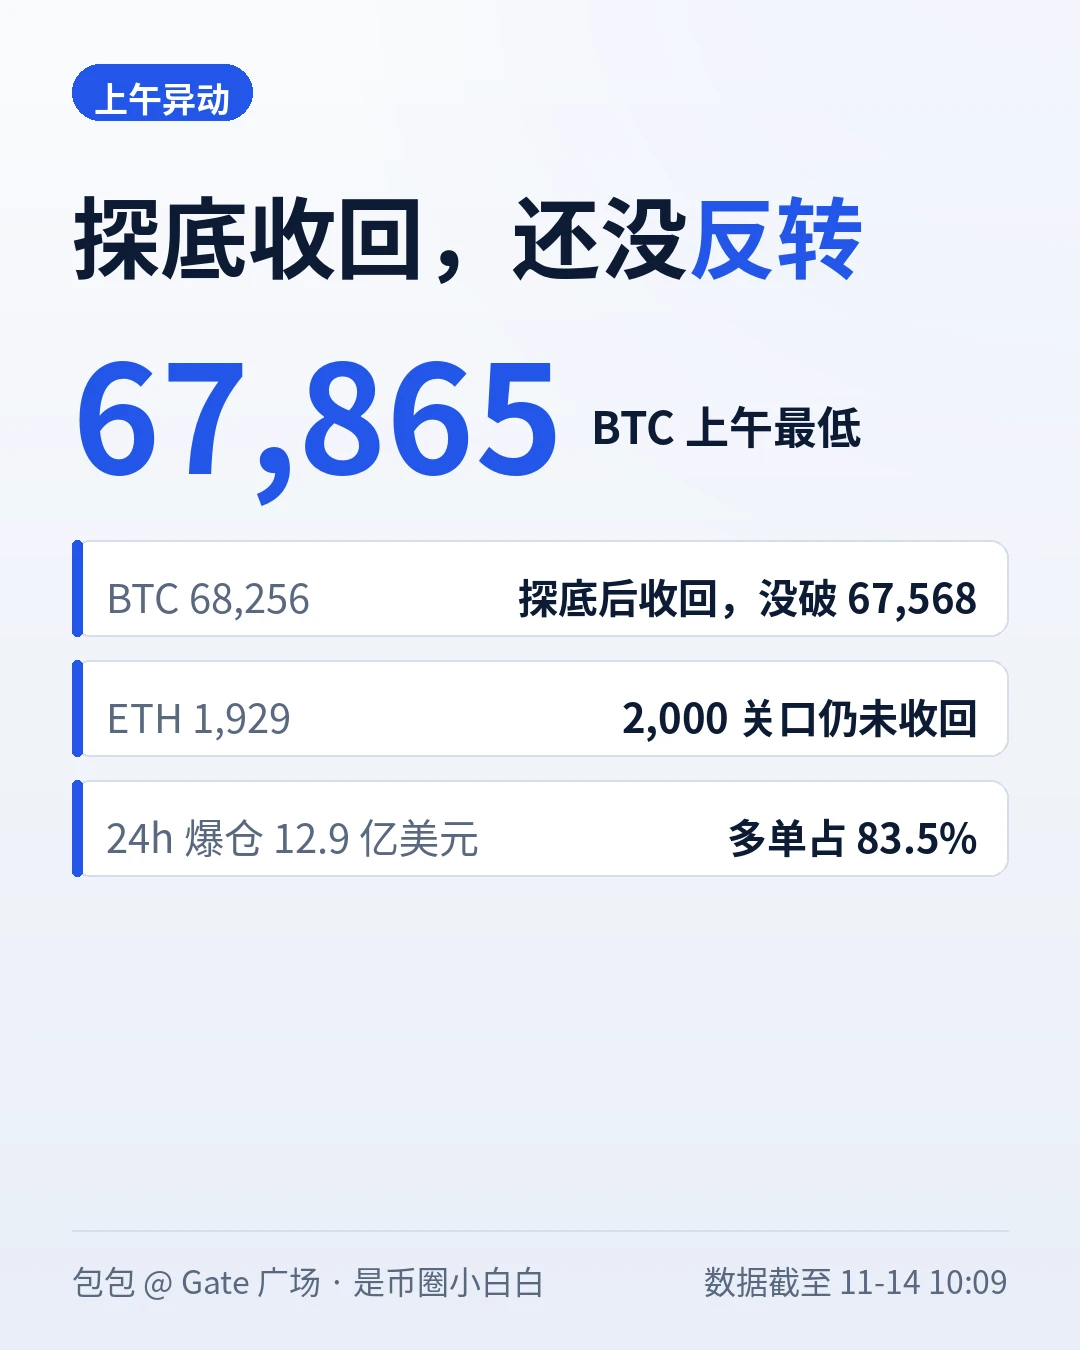
BTC fell below 68,000 this morning, touched 67,865, then climbed back above 68,000. ETH hovered around 1,930 and failed to reclaim 2,000—the low of 67,568 from yesterday held, but this is just a breather in the downtrend, not a reversal. #BTC跌4%
At 09:00, BTC was still at 68,346, but it dipped again this morning, hitting a low of 67,865—less than $300 above yesterday’s low of 67,568, which held. It then recovered 68,000 and is now at 68,256, down 3.62% over 24 hours. Buyers stepped in around 67,568, but selling pressure above 68,000 hasn’t eased; reclaiming the level doesn’t mean a reversal.
post-image
BTC-0.67%
ETH-1.26%
#BTCDown4% #BTCDown4% #ShareWeekly

Bitcoin Below $70,000: Is This a Temporary Correction or a Deeper Shift in Market Sentiment?

Bitcoin's struggle below $70,000 is becoming an important test for the broader cryptocurrency market. The decline is not simply about price action; it reflects a combination of macroeconomic uncertainty, weakening institutional demand, and deteriorating technical structure.

The real question is whether buyers can defend the current support region or whether the market is preparing for another downward move.

1. Macroeconomic Pressure Is Limiting Risk Appetite

Rece
BTC-0.67%
How should you read on-chain data? How can large transfers help you gauge market trends?

In the cryptocurrency market, many people watch candlestick charts and trading volume every day, but overlook a very important source of information: on-chain data.

Especially when large Bitcoin transfers occur, many traders immediately speculate: Is a whale preparing to sell? Is an institution buying in large quantities?

But do large transfers really mean that prices are about to change?

First, distinguish between funds flowing into and out of exchanges. A large amount of BTC moving to an exchange may
post-image
BTC-0.67%
Many futures traders have had this experience: they correctly predict the market’s overall direction, but a brief, sharp price move suddenly liquidates their position.

Why does this happen?

First, excessive leverage is the most common reason. The higher the leverage, the greater the impact of price movements on margin. Even a brief move in the opposite direction can quickly hit the liquidation price.

Second, market liquidity affects execution. When a large number of sell or buy orders suddenly appear, the order book can thin out rapidly, making price movements even more volatile.

Third, in
post-image
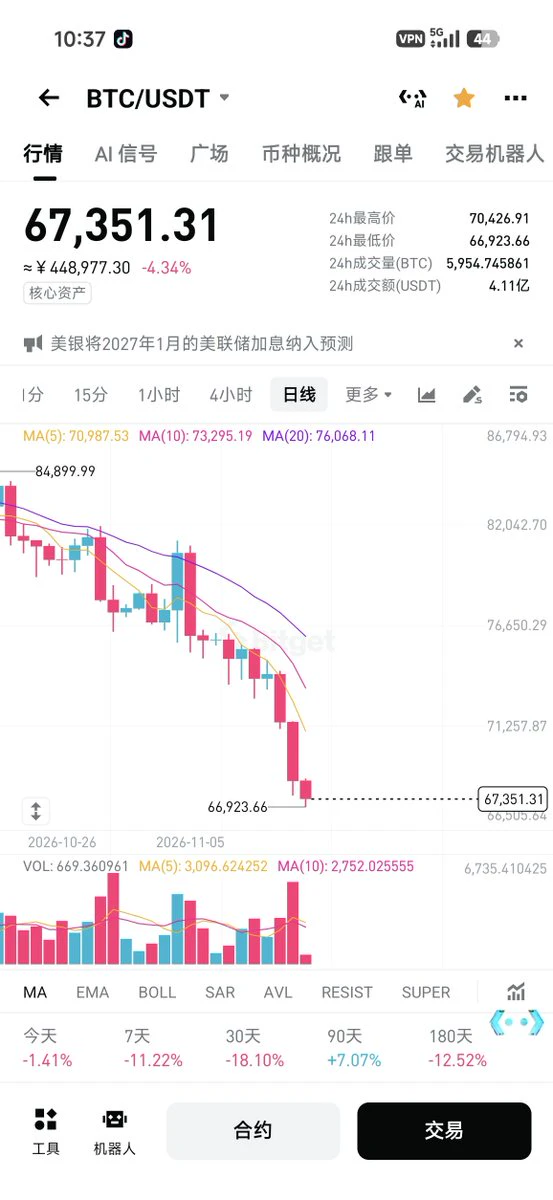
The decline is so smooth; the script looks just like what happened in May or June, with a very smooth drop.
Could BTC really be stuck in a range-bound market from now on??
Repeatedly getting chopped back and forth😏
post-image
BTC-0.67%
The U.S. Federal Aviation Administration (FAA) suddenly issued an order: No planes can take off from any airport in the country.

Planes already in the air can land as usual, but all departures are suspended. This kind of thing has only happened a few times since 9/11.

There may have been a communications system failure. Air traffic controllers and pilots rely on radio communications to direct flights. If that line goes down, no one dares let planes take off, so they shut everything down across the board.

Could this be retaliation for freezing $1.2 billion in cryptocurrency stolen from Binan
Contract Position Alert:

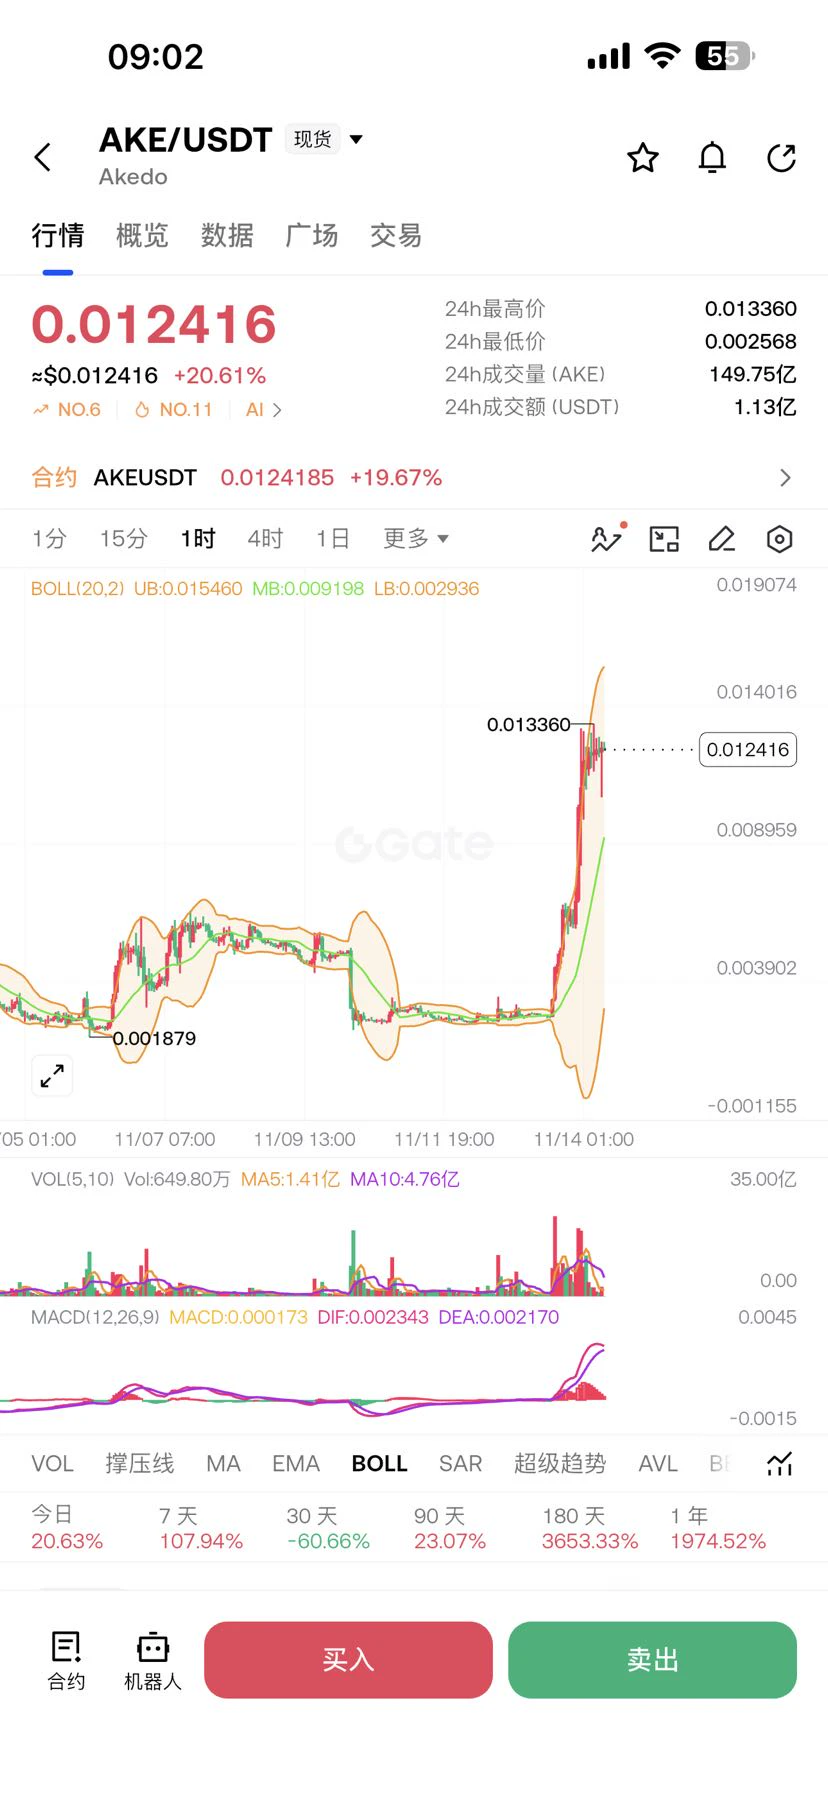
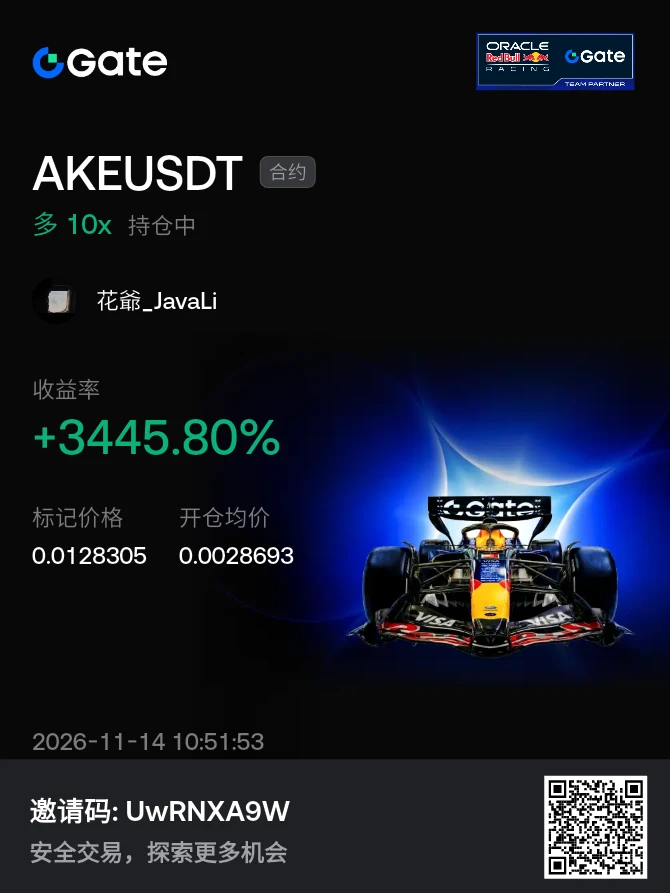
AKE appears to have topped. Enter a half position at the current price of 0.0125, add the other half at 0.015, and set a stop-loss at 0.0161. Make sure to use a stop-loss; highly volatile coins should not be stubbornly held.

Highly volatile coins carry extreme risk. Manage your risk accordingly!
post-image
AKE+6.39%
  • 3
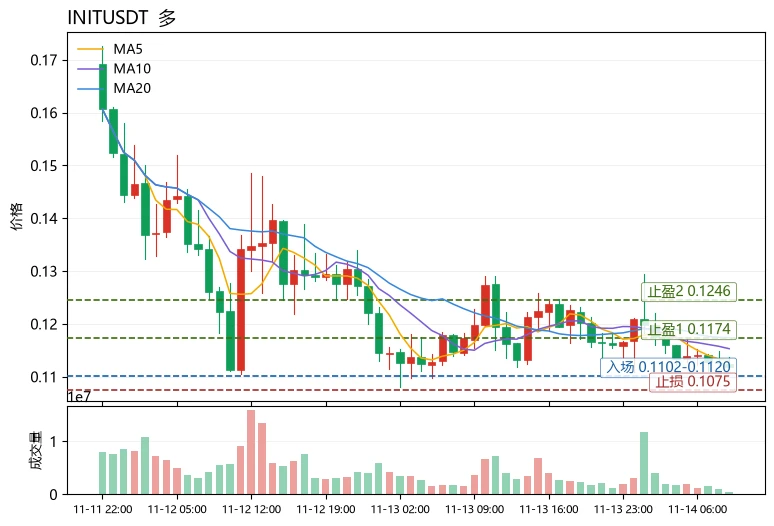
With an extreme fear reading of 13 and negative funding rates, $INIT ’s decline looks more like an emotional sell-off than the end of the trend. I lean toward a small long position near the lower Bollinger Band, betting on a mean reversion.
Three points support this view: First, the Fear & Greed Index at 13 is in extreme territory, where historically the odds of chasing shorts have deteriorated significantly; $INIT ’s funding rate is -0.1968%, meaning shorts have to keep paying, and the crowded short positioning itself provides fuel for a rebound. Second, in terms of broader market correlation
post-image
INIT-2.53%
BMT+5.93%
$AKE I'm still holding; I feel like it can keep going up. If you can't hold, go die.#比特币跌破7万美元 ‌
post-image
AKE+6.39%
Load More

Join 40 M users in our growing community

⚡️ Join 40 M users in the crypto craze discussion

💬 Engage with your favorite top creators

👍 See what interests you

Trending Topics

GateIPOAccessAnthropic

297.9K Views2.8K Discussing

Gate IPO Access Phase 3 features Anthropic (ANT), with USDT subscription interest starting from 100 USDT. Successful allocations will be delivered as real shares to Gate Stock Accounts. Indicative price: $70–$78/share Subscription: Nov 12–17 (UTC+8) Allocation is not guaranteed. Please manage risk accordingly.

Dr.HanOxfordUnionSpeech

146.4K Views541 Discussing

USOctoberPPIBelowExpectations

458.2K Views1.3K Discussing

View More