Share your thoughts
placeholder
Article
Everyone has probably seen ZEC’s price action.
The price surged to 1050, and market hype has completely exploded.

Objectively speaking, ZEC’s sharp rally this time is largely driven by narrative speculation and large-capital buying, rather than a simultaneous fundamental breakout. Friends holding long positions must take profits and secure them in their pockets in time! Let me remind everyone of its historical price action: it previously plunged rapidly from 750 to 150.
For tokens with relatively small circulating supplies, when major players distribute their holdings, the decline can be abs
post-image
ZEC+7.15%
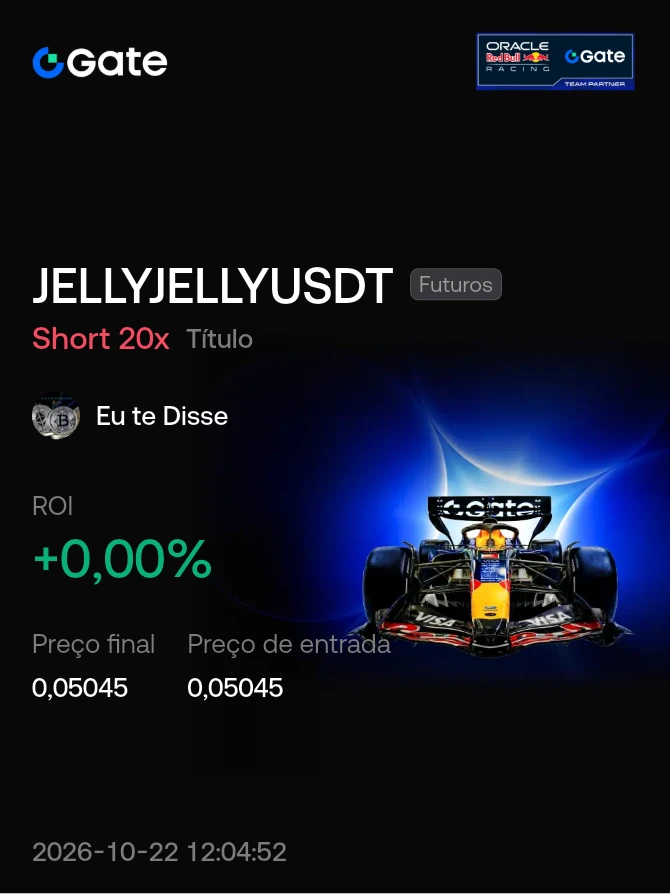
🚨🔥 #RedBullTradingTourSeason6 🏎️📈
🏁 THE TRADING ACTION IS BACK! 🚀🔥
Red Bull Trading Tour Season 6 is bringing together the excitement of trading, competition and high-performance energy! ⚡📊
🏎️ Season 6 is ON!
📈 Markets moving fast
🔥 Traders ready for action
🎯 Strategy meets precision
🌍 The trading community comes together
Just like racing, trading is all about speed, discipline, timing and staying focused when the pressure is high! 🧠⚡
Who’s ready to follow the journey and see what Season 6 brings? 👀🏆
🔥 FAST MARKETS. BIG ENERGY. TRADING MODE ON!
👑 HOST BY HOT TRADER 🚀
#RedBul
BTC-2.46%
Everyone’s watching $ETH /USDT for a breakout—but the 4h chart just whispered a secret nobody’s pricing in yet.

$ETH /USDT - SHORT

Trade Plan:
Entry: 2443.10 – 2454.96
SL: 2505.93
TP1: 2406.36
TP2: 2377.91
TP3: 2335.23

Why this setup?
- 1D trend is *range*, not bull—so longs are gambling on hope, not structure.
- RSI (15m) at 40.48 shows momentum is fading, not flipping.
- Entry zone 2443–2455 is armed: TP1 at 2406 is a 1.7% drop, TP2 at 2378 is a 2.9% slide.
- Why now? ATR 1h is 23.7—volatility is compressed, and shorts pay when the range snaps downward.

Debate:
Are you trusting
ETH-2.37%
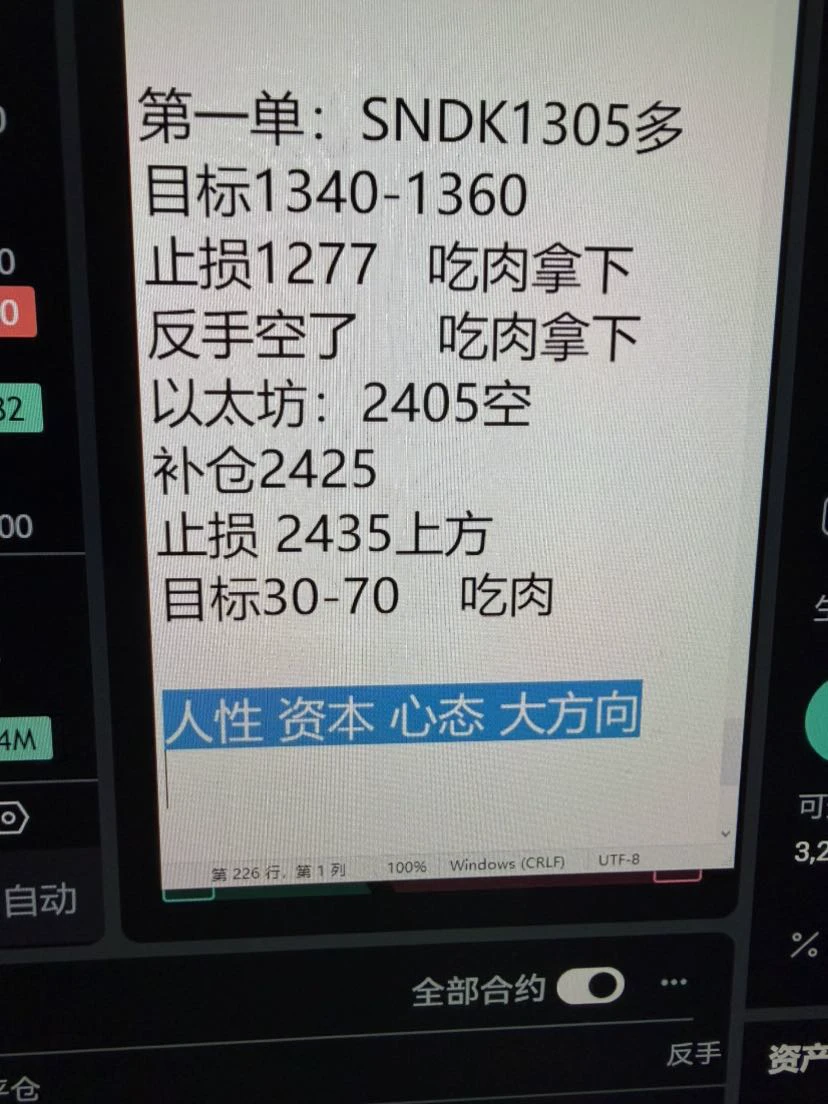
U.S. Treasury yields are too high right now; interest rates will most likely be cut next year, and 2027 will be a super bull market. $SNDK
post-image
SNDK+11.85%
  • 1
JUST IN: 🇺🇸 President Trump says economic growth does not cause inflation “stupidity” does.
President Trump is correct.
Growth does not automatically cause inflation. It depends on why the economy is growing and whether demand is outrunning the economy’s ability to produce more goods and services.
Any other economists want to add something? Preferably someone from the far left. 🙂🔫
post-image
I originally just wanted to snag a free breakfast, but the market ended up serving me six months’ worth of dumplings. A few days ago, in the early hours, I saw that $VVV hadn’t broken its key level, and I felt half reassured. At the time, I suggested entering a long position; if it held on the pullback, it was an easy win. It’s now 17.941, a long way above 17.236, with a +194.88% return right in front of us—this profit feels great. Those already on board should be waking up laughing. It was really sluggish at first, but the outcome is truly sweet. This feels so good—I can afford a nice meal. I
post-image
VVV+6.81%
SNDK+11.75%
ADA-3.66%
$ZEC and $XRP are showing strength. But is altseason really starting?
I’d be careful with that conclusion.
The important signal isn’t two coins outperforming. It’s whether capital starts rotating across a wider part of the altcoin market.
#BTC ’s pullback after stronger U.S. jobs data adds another layer to the move, with higher Treasury yields putting pressure on risk assets.
So the real test from here is simple:
Does the strength broaden?
More altcoins outperforming BTC + stronger volume + deeper liquidity would make the rotation much more convincing.
Until then, I see this as selective str
post-image
ZEC+7.05%
XRP-4.46%
A few days ago, my hand trembled slightly as I set a stop-loss before bed. This morning, I realized that extra act of filial piety had been unnecessary. My last glance before bed showed $BASED had just pulled back to a key level. I repeatedly confirmed that the pullback had held and the footing was solid, with absolutely no sign of a breakdown.

I judged at the time that this bullish move had potential, so I directly opened a long position around 0.05933 as a test. When I opened the chart this morning, I froze for a moment—the price had already touched 0.06868, with +757.86% sitting there. T
post-image
BASED-1.58%
SOL-3.29%
BNB-0.53%
🔹Oil Rally Pauses, U.S. Stocks Snap a Three-Day Losing Streak! I
live-cover
LIVE1,897
I had just switched the app to the background when it suddenly shot back up—what, is it playing hide-and-seek with me? A few days ago, I took one last look before bed. $ARKM was facing clear resistance overhead, with sell orders constantly pressing it down, and the candlesticks were inching along without breaking upward. I figured shorting at this level offered decent risk-reward, so I set an entry at 0.1481. When I woke up this morning, it put on a straight-up cliff dive for me, reaching 0.106, and I pocketed +282.61%—that felt damn good. Staying up for this move was worth it. In terms of exe
post-image
ARKM-3.28%
BNB-0.53%
SOL-3.29%
NVDA Still Leading The AI Race — Can Bulls Push Higher?
$NVDA is trading around the $230 zone, and this area is becoming very interesting for the next move. After recovering from the recent pullback, Nvidia is showing strength again as buyers continue to defend important levels.
My view is that NVDA remains one of the strongest AI-related stocks because the market is still focused on AI infrastructure growth, data center demand, and Nvidia’s dominant position in advanced chips. Recent momentum has improved as investors regain confidence in the AI sector.
From a technical perspective, holding
post-image
NVDA+0.80%
【$Lobster Signal】Long | 1H Band Hugging + MACD Expansion Across Both Timeframes
$Lobster RSI 1H 86.14, current price 0.093252 hugging the 1H Bollinger upper band. The 16:00 candle touched 0.1027 before closing back at 0.0899, with overhead supply not yet cleared. The 17:00 and 18:00 candles both closed above 0.0930, with buyers retaking control. The MACD 1H histogram is 0.0017 and the 4H histogram is 0.0015, expanding in sync across both timeframes. The funding rate is 0.0777%, raising the cost of long positions. Sell orders slightly outweigh buy orders in the order book, but the price is hold
post-image
龙虾+19.27%
BTC-2.46%
ETH-2.43%
SOL-3.39%
Live trading - Analysis Crypto market
live-cover
LIVE83
$ZEC I see that many liquidation prices on the feed are between 1200 and 1300. Will it keep pushing upward?
post-image
ZEC+7.15%
  • 1
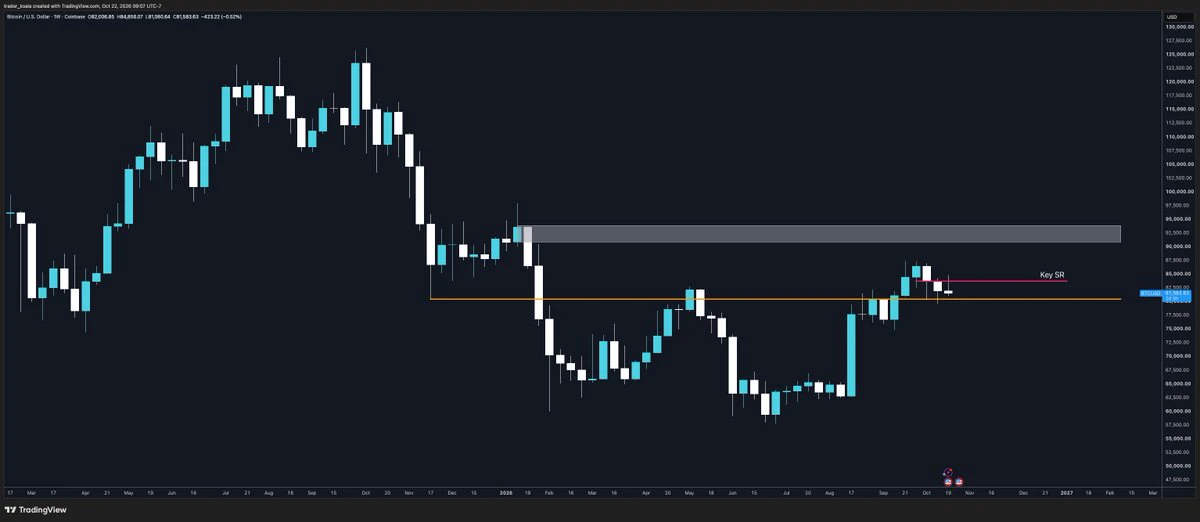
✨Those who missed the move will only become more numerous; the Bitcoin bull market has just begun.
Short-term fluctuations do not mean the trend has ended.
The market has repeatedly absorbed known negative factors such as rate hikes and bills, and these factors are unlikely to change the larger cycle.
At worst, there will only be sporadic rate hikes, after which the market will still return to the path of easing.
The monthly and quarterly bullish structures remain intact.
In the remaining three months of this year, there is a chance of pushing into the 90,000–100,000 range.
The real major corr
post-image
BTC-2.39%
ETH-2.37%
Everyone’s staring at ADA’s breakout—but the 4h tape is quietly screaming lower.

$ADA /USDT - SHORT

Trade Plan:
Entry: 0.2119 – 0.2137
SL: 0.2212
TP1: 0.2065
TP2: 0.2023
TP3: 0.1960

Why this setup?
Why now? The daily is stuck in a range, yet the 4h structure is armed for a SHORT at 0.2128 with only 55% conviction—meaning the path of least resistance is down, not up.
- RSI on the 15m is already at 42.5, losing momentum before any bounce.
- ATR on the 1h is tight (0.0035), so the drop to TP1 (0.2065) is a clean 3% ride if 0.2095 breaks.
- If bulls can’t reclaim 0.2137 fast, this is a
ADA-3.66%
Everyone’s staring at ESPORTS’ 95% short signal—but nobody’s asking why the 15m RSI is screaming overbought at 64.95.

$ESPORTS /USDT - SHORT

Trade Plan:
Entry: 0.01460 – 0.01470
SL: 0.01517
TP1: 0.01426
TP2: 0.01400
TP3: 0.01360

Why this setup?
- The 4h timeframe is a confirmed sell zone: entry at 0.01465, with a tight stop at 0.01517 (risk just 3.5%).
- Bearish daily trend aligns with a 95% confidence score—this isn’t a coin flip; it’s a statistical setup.
- Why now? The 1h ATR (0.000218) shows volatility is compressed, meaning the breakout to TP1 (0.01426) or TP2 (0.01400) could be
ESPORTS-0.88%
BITCOIN'S GOLDEN CROSS IS HERE. 👀🔥
Historically, this setup has preceded some HUGE moves.
But is $100K guaranteed?
Absolutely not.
The Golden Cross has appeared 12 times since 2012. Some produced massive rallies:
📈 2012: +306%
📈 2020: +312%
The average 3-month gain across nine signals was 24.9%.
But there's a catch…
Only 3 of 12 signals remained intact for a full year without a Death Cross.
WHY $100K IS BACK ON THE TABLE:
🔹 Strong institutional ETF demand
🔹 $3.5B+ in August Bitcoin ETF inflows
🔹 USDT dominance potentially forming a Death Cross
🔹 Capital potentially rotating into risk a
post-image
BTC-2.46%
Which #memecoin will do this next?
post-image
MEME-1.20%
MEMECOIN-62.16%
I originally wanted to cut losses and sacrifice to the heavens, but the heavens weren't appeased—the meat cooked itself instead. 🍖
During the repeated intraday swings, I opened this short at 2460.00. The logic was simple: insufficient buying support, with every rebound looking paper-thin and the overhead resistance clearly visible. The candlesticks kept grinding back and forth, but the center of gravity was quietly moving lower. This kind of move is the most deceptive, but also the easiest to hold.
Now at 2454.23, I’ve pocketed 80%. It was truly sluggish at first, but once it moved, it felt g
post-image
XRP-4.39%
DOGE-4.93%
Load More

Join 40 M users in our growing community

⚡️ Join 40 M users in the crypto craze discussion

💬 Engage with your favorite top creators

👍 See what interests you

View More