Square
Following
Hot
News
Profile
Share your thoughts
placeholder
Article
$US Bought spot at a low yesterday, went long and bought the dip, winning across the board. As long as you hold, just wait for the pump to sell
US-8.60%
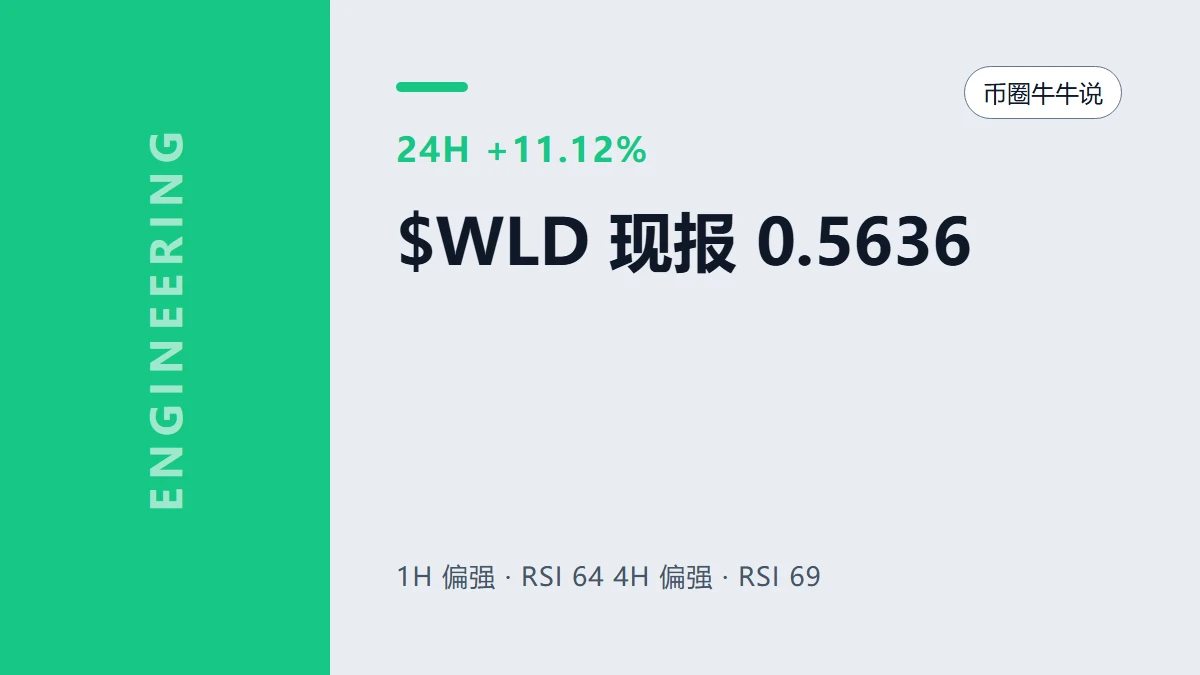
An unpopular take: $INJ ’s current +10.99% gain is not as conclusive as it looks.
$INJ is currently at 8.423, up +10.99% over 24 hours. The 1-hour support is 7.061, resistance is 8.562, and current volume is 0.77 times the average volume of the past 20 periods. What is truly useful in these numbers is where 7.061 and 8.562 are containing the range.
This is where I currently stand: I acknowledge that the trend is strong, but what matters next is not how much higher it can surge, but whether buyers step in during the first pullback. The 1-hour trend is strong, with an RSI of 86; the 4-hour trend
post-image
INJ+10.27%
$CRCL Short Fades a Fresh Bullish MACD Cross Momentum Conflict
Pair: $CRCL /USDT
Direction: SHORT
Entry Zone: 77.89
Take Profit:
- TP1: 76.12 +2.3%
- TP2: 74.94 +3.8%
- TP3: 73.18 +6.0%
Stop Loss: 80.25
Chart Structure:
- CRCL declined steadily from ~86 through MA7, MA25, and MA99 to a low near 74.5, then recovered to current price, now consolidating just below the broken MA7/MA25 cluster
- MA99 (purple) remains above as declining resistance, not yet tested on this bounce
- RSI(14) recovered from the low-20s to the high-40s a decent, sustained recovery, not just a tick
- ⚠️ MACD has been d
CRCL+8.31%
$ETH Long Catches a Fresh Flush Partial Bounce, No Momentum Confirmation
Pair: $ETH /USDT
Direction: LONG
Entry Zone: 2364.29
Take Profit:
- TP1: 2423.13 +2.5%
- TP2: 2462.36 +4.1%
- TP3: 2521.20 +6.6%
Stop Loss: 2285.83
Chart Structure:
- ETH declined steadily from ~2480 through MA7, MA25, and MA99, then printed a sharp flush candle down to ~2285-2300 before bouncing to current price
- Price remains well below all three moving averages this is a bounce attempt within an intact downtrend, not a reclaim
- RSI(14) dropped to ~25 at the flush low and has only partially recovered to the high-
ETH+1.52%
  • 2
If I could leave just one note for $FIL today, it would be: don’t let +7.87% make the decision for you.
What’s really worth discussing is that $FIL remains strong, while the crowded trade is already out in the open. $FIL is currently at 1.172, up +7.87% over 24 hours. The 1-hour support is 0.9999, resistance is 1.1774, and current volume is 0.61 times the average volume of nearly 20 bars.
The 1-hour trend is strong, with RSI at 78; the 4-hour trend is strong, with RSI at 56. This combination makes me temporarily accept the following interpretation: I acknowledge that the trend is strong, but
post-image
FIL+6.46%
$INJ is heading straight toward a major selling-pressure zone
INJ has rebounded strongly from around 7.00 and is now approaching the 8.50–8.70 resistance zone. This is exactly where I stop chasing the rally and start watching for a potential price rejection. Short setup entry zone: 8.30–8.60Next target price: 8.20TP1: 8.05TP2: 7.80Final target: 7.55Stop-loss: 8.95The upward momentum is strong, but the price is now approaching the same zone where sellers stepped in previously. If INJ fails to establish a firm foothold above 8.50–8.70, a strong rejection candle could trigger a rapid pullback. A
post-image
INJ+10.36%
Ledger response to the recent supply chain attacks: $899 pls. Ps don't drop it
post-image
🔹Whale Dumps BTC and Loads Up on ETH! After selling 237.8 BTC and buying 7,929 ETH, is big money be
live-cover
LIVE88
Wow 😮 everyone is getting instantly rich 🤑 from this coin solana:DFMt2FyLpB6ekPNAzVErLXgpSnJ9CRf1VnxBAkTLpump
Probably backed by @elonmusk
Gaurantee to make you rich 🤑 100%
Nobody loses it goes up forever ♾️
DFMt2FyLpB6ekPNAzVErLXgpSnJ9CRf1VnxBAkTLpump
post-image
SOL+1.42%
first day calling on @Pumpfun
bullish tek!
post-image
$NEAR NEAR Breaks Out of a 4-Year Descending Channel: TP1: $11
NEARUSDT
Weekly Time Frame:
NEAR (1W, log scale) is breaking out of the descending channel that has defined price action since the 2022 top, and the weekly candle is now pushing above the upper boundary.
What the chart shows:
After the 2022 high (~20.6), price spent years in a descending channel, bottoming around the 0.9 area in early 2026.
Since that low, price has risen sharply and is now trading at ~5.4, above the channel’s upper trendline.
The breakout is happening at the 2024 volume profile POC (~5.2), so the trendline and a h
post-image
NEAR+10.25%
Social experiment but after confirming villian monkey is behind the “Neymar” token.
I recant my post. I do not endorse this token or encourage anyone to buy after new evidence.
If you still buy, it’s at your own risk. Enjoy your day. 👍🏾
post-image
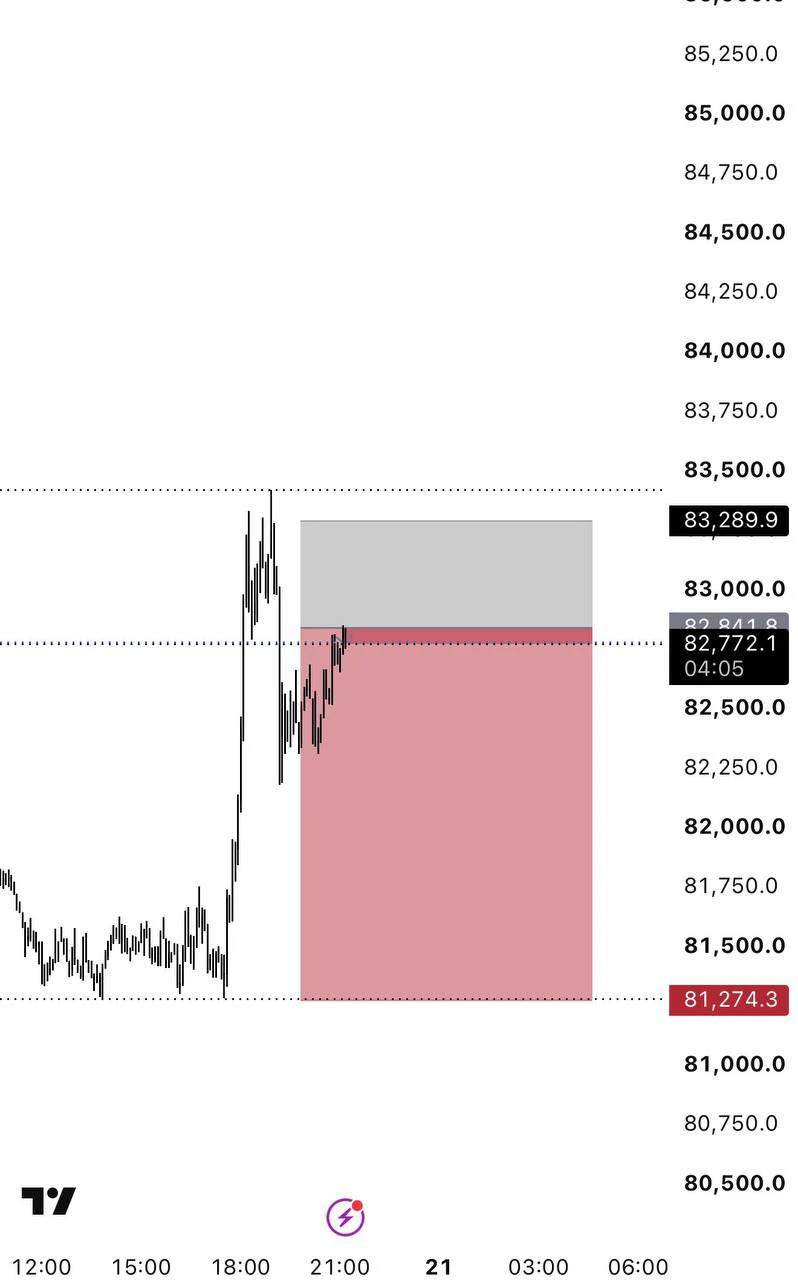
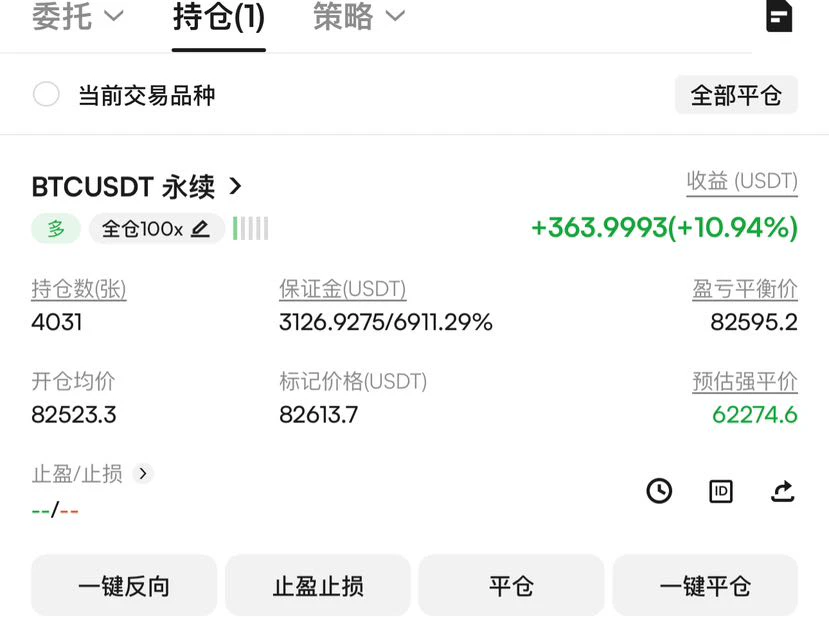

Bitcoin is BACK over $82,000!!
We are so back!!
post-image
BTC+0.31%
We could have been a beautiful combo, you and I...
post-image
CPI Comes in Hotter Than Expected
live-cover
LIVE76
$OP
This move is pushing from 0.1397 toward 0.1418, up more than 13% over the past 7 days, while open interest is piling up as longs keep adding and driving it higher🚀 The wildest part is that shorts are effectively paying to stay in, having to hold on while funding remains negative. The pressure isn’t a bad thing—it’s an early-entry position. Break through 0.1418 and jump aboard.
post-image
OP-0.14%
10.16 $SNDK The strategy has once again reached everyone’s favorite moment: the “three storage clowns.” First, SanDisk’s decline is not over yet; it’s just that the short positions exited early, while long positions still have to withstand further downward pressure. We previously discussed one logic,
namely, the three underlying elements for training small and large AI models: 1. Computing power: continuously allowing small and large AI models to iterate and upgrade step by step; 2. Electricity: demand for computing power continues to rise, and stable power supply is the foundation, with typic
post-image
SNDK-0.56%
SOL oscillated downward from the earlier high of 124.99, with the intraday low dipping to 100.51 before a slight rebound, reaching a high of 106.49. This rebound is merely a minor corrective bounce during the decline; the overall broader downtrend channel remains intact, and a rebound to resistance presents an opportunity to enter short.

From the chart, the daily highs have been gradually moving lower, and the bearish trend structure remains intact. This rebound is only a brief pause amid the decline. MACD remains weak and trending downward, while heavy pressure from previously trapped posit
post-image
SOL+1.48%
CARDANO $ADA REJECTING MOVING AVERAGE RESISTANCE ARE BEARS TARGETING $0.213 NEXT?
Pair: $ADA /USDT
Direction: SHORT
Entry Price: 0.2306
Target Levels (Take Profit)
TP 1: 0.224 2.86%
TP 2: 0.2196 4.77%
TP 3: 0.213 7.63%
Stop Loss
SL: 0.2394
Technical Breakdown
ADA ($0.2306) faced strong rejection following an aggressive upward push, printing a topping wick that stalled out right at structural resistance. This price action confirms persistent seller defense and sets up a clean continuation toward lower targets.
Price action tested areas above short-term moving averages before facin
ADA+0.88%
Excited to share our portfolio snapshot! 🚀 Focused on DeFi, yield farming, and funding arbitrage for optimal gains. 📊 Dive in and explore the insights below! #Crypto #Trading #Portfolio #DeFi
Ready to start your journey?
post-image
Load More

Join 40 M users in our growing community

⚡️ Join 40 M users in the crypto craze discussion

💬 Engage with your favorite top creators

👍 See what interests you

Trending Topics

USSeptemberPPIBeatsExpectations

91.35k Views1.88k Discussing

US September PPI came in at 6.3% YoY, well above the 5.3% market expectation, pointing to renewed producer-side inflation pressure. Weekly jobless claims were 199K, broadly in line with forecasts. Could hotter inflation further reduce room for rate cuts, and what does it mean for $BTC, US stocks, and gold?

DrLinHanSpeaksAtOxfordUnion

135.63k Views1.86k Discussing

JapanAndKoreaStocksPlunge

47.27k Views1.76k Discussing

View More