Square
Following
Hot
News
Notifications
Profile
Share your thoughts
placeholder
Article
11.12 Gold

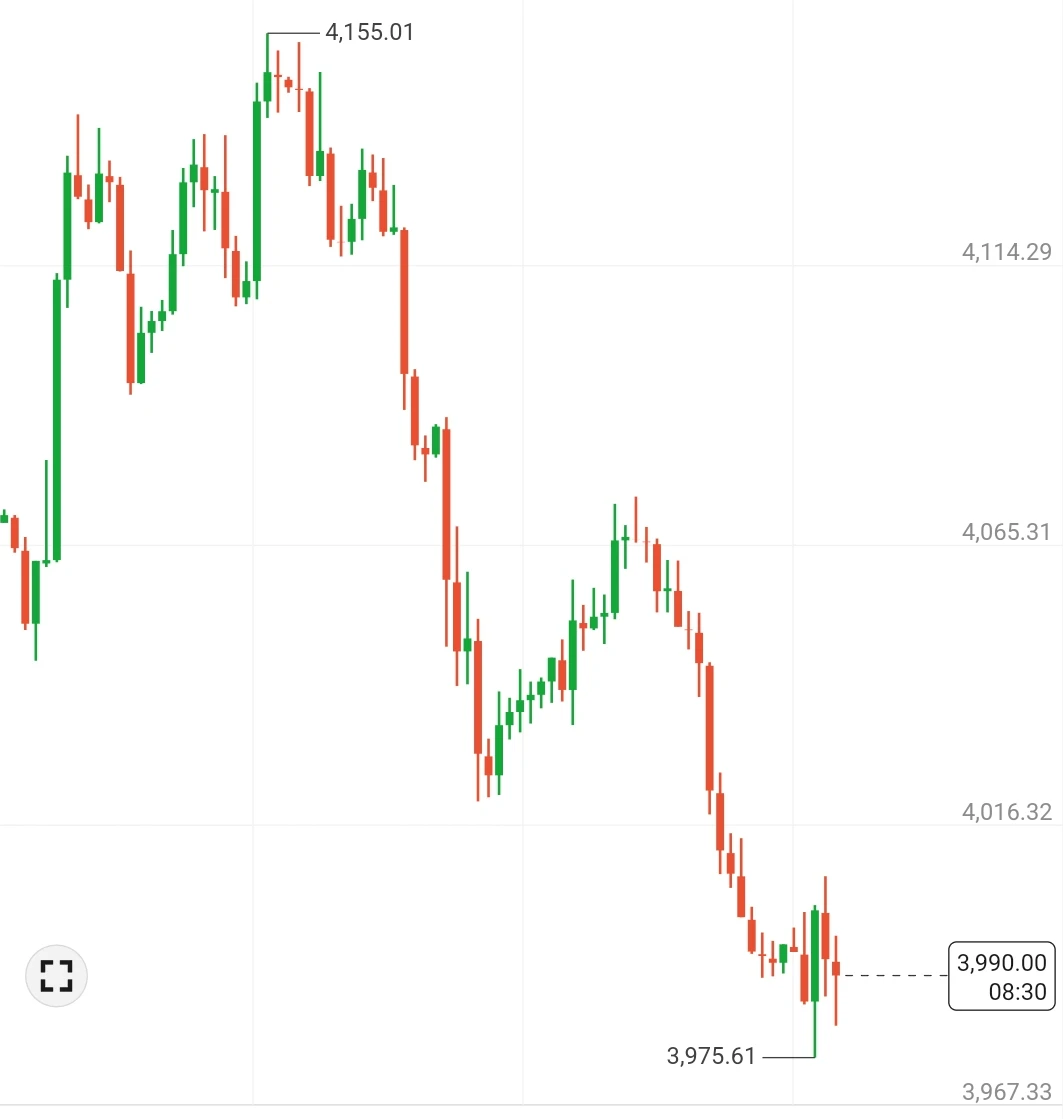
Gold fluctuated narrowly around 3992 today. After plunging to 3975 in early trading, it staged a slight rebound, but remained clearly under pressure overall. Overnight, gold prices fell decisively below the 4000 level, with the technical picture showing a classic bearish alignment: the 21-day, 50-day, and 100-day moving averages all gave way, while the MACD histogram’s green bars continued to narrow, signaling fading bullish momentum.

U.S. October CPI rose more than expected month over month. Markets are strongly expecting a 25-basis-point rate hike in December, with some even sti
post-image
GLDX-0.40%
PAXG+0.37%
XAU+0.38%
11/12 Midday Bitcoin:

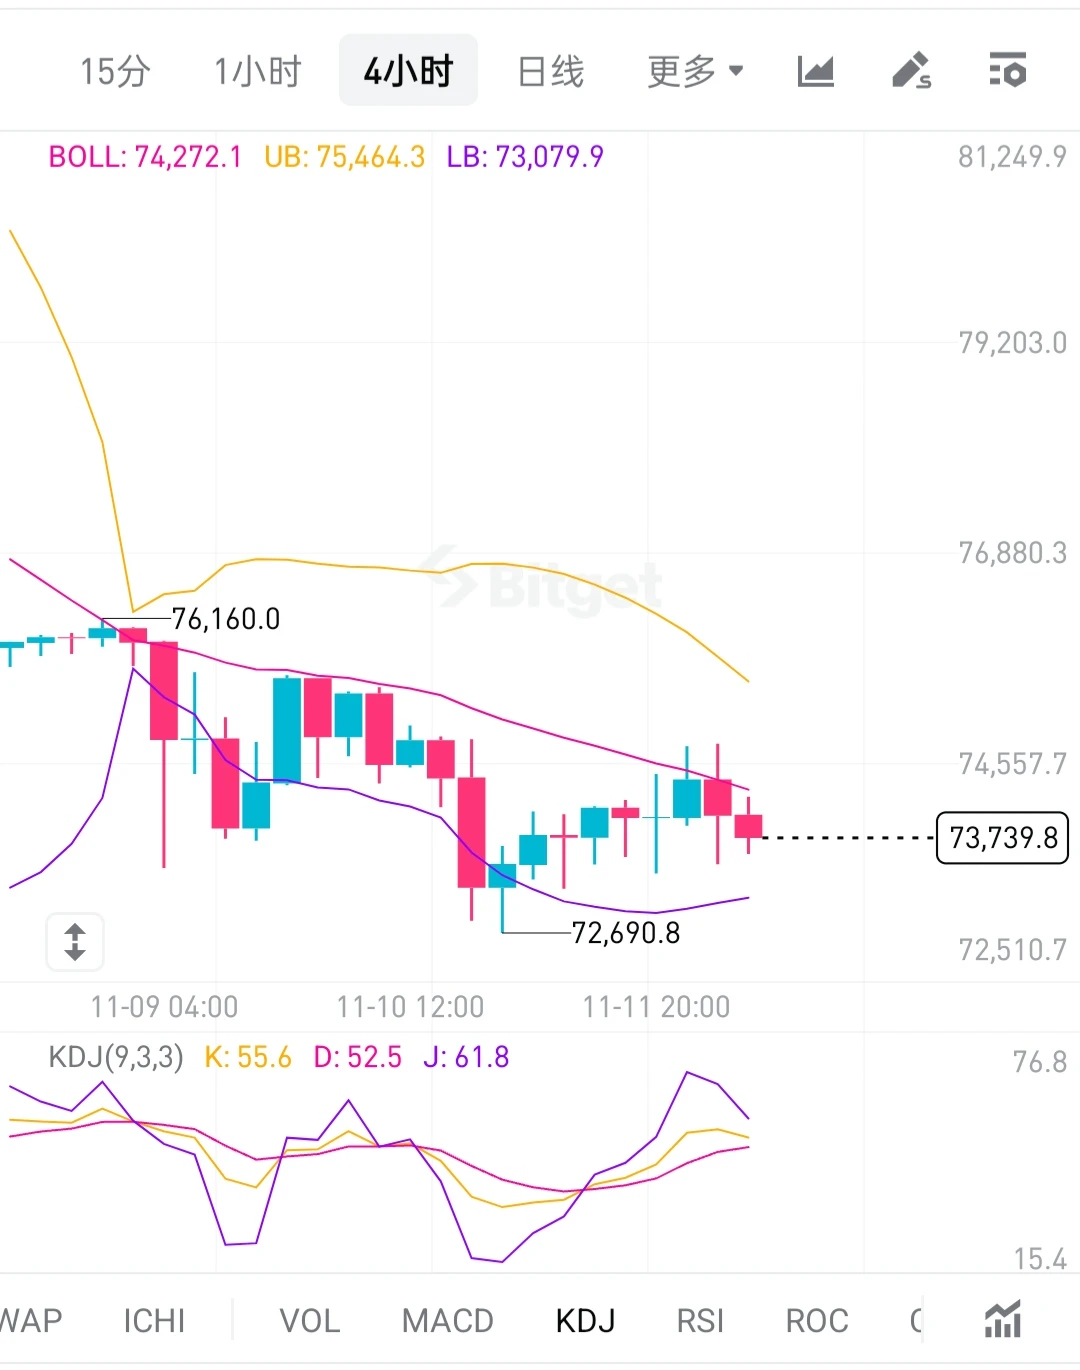
On the short-term 4-hour chart, the current price is between the Bollinger middle and lower bands. The price has pulled back from around 76160, with the middle band continuing to act as resistance. Overall, it remains in a low-level consolidation and recovery phase within a bearish trend, with the previous low around 72690 serving as key short-term support.

As for KDJ, the K value is 55.6, the D value is 52.5, and the J value is 61.8. The indicator has rebounded from low levels and formed a golden cross, indicating potential for a corrective rebound after the sharp drop
post-image
BTC-0.67%
Trenches
Max
M
bade
b
Max
5qaP...pump
Market Cap
$.
Change
.
24h Vol
$.
Holders
.
mihao
m
bade
b
mihao
4Cxj...pump
Market Cap
$.
Change
.
24h Vol
$.
Holders
.
AGT
A
bade
b
AGT
0x5d...e274
Market Cap
$.
Change
.
24h Vol
$.
Holders
.
DacityCoin
D
bade
b
DacityCoin
DKYc...pump
Market Cap
$.
Change
.
24h Vol
$.
Holders
.
Max
M
bade
b
Max
HPSp...h53z
Market Cap
$.
Change
.
24h Vol
$.
Holders
.
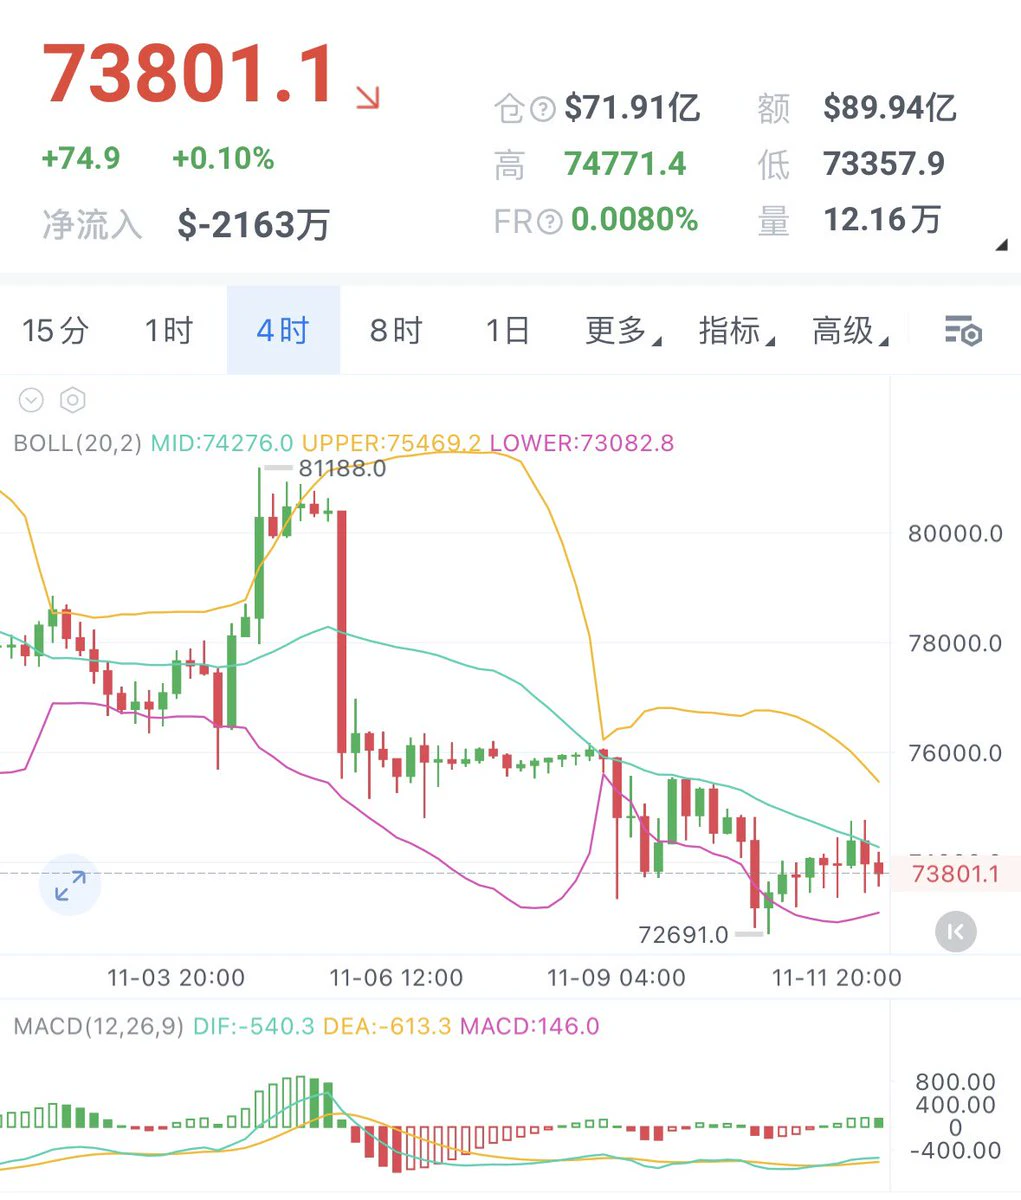
No midday update today. BTC remains in the 74,700–71,800 range, and ETH remains in the 2,021–2,116 range. ETH should have seen a two-hour decline last night, but news triggered a short squeeze, dragging it out to four hours. Jobless claims data are due tonight; if the market doesn’t dawdle, ETH will most likely break straight through the 2,000 level. For intraday trading, consider shorting around 2,078, with a stop at 2,105 and a target near 1,940. For BTC, consider shorting around 74,300, with a 500-point stop and a target near 70,800.
Gold closed around 4,004 this morning, and the bulls are
post-image
BTC-0.67%
ETH-1.26%
GLDX-0.40%
PAXG+0.37%
  • 1
The probability that Jensen Huang will continue as NVIDIA CEO has fallen to 9%, with prediction markets now favoring Ian Buck, known as the “father of CUDA,” as his successor.

On Polymarket’s “Next NVIDIA CEO” market, Ian Buck has a 32% probability and is described as one of the creators of the company’s core moat. Colette Kress is at around 17%, Rene Haas at 10%, and the option for Jensen Huang to remain CEO has dropped to 9%.
NVDA+2.99%
Buy the dip and go long on gold at 3982, with a stop-loss. At 3965, a stop-loss is mandatory. For reference only
post-image
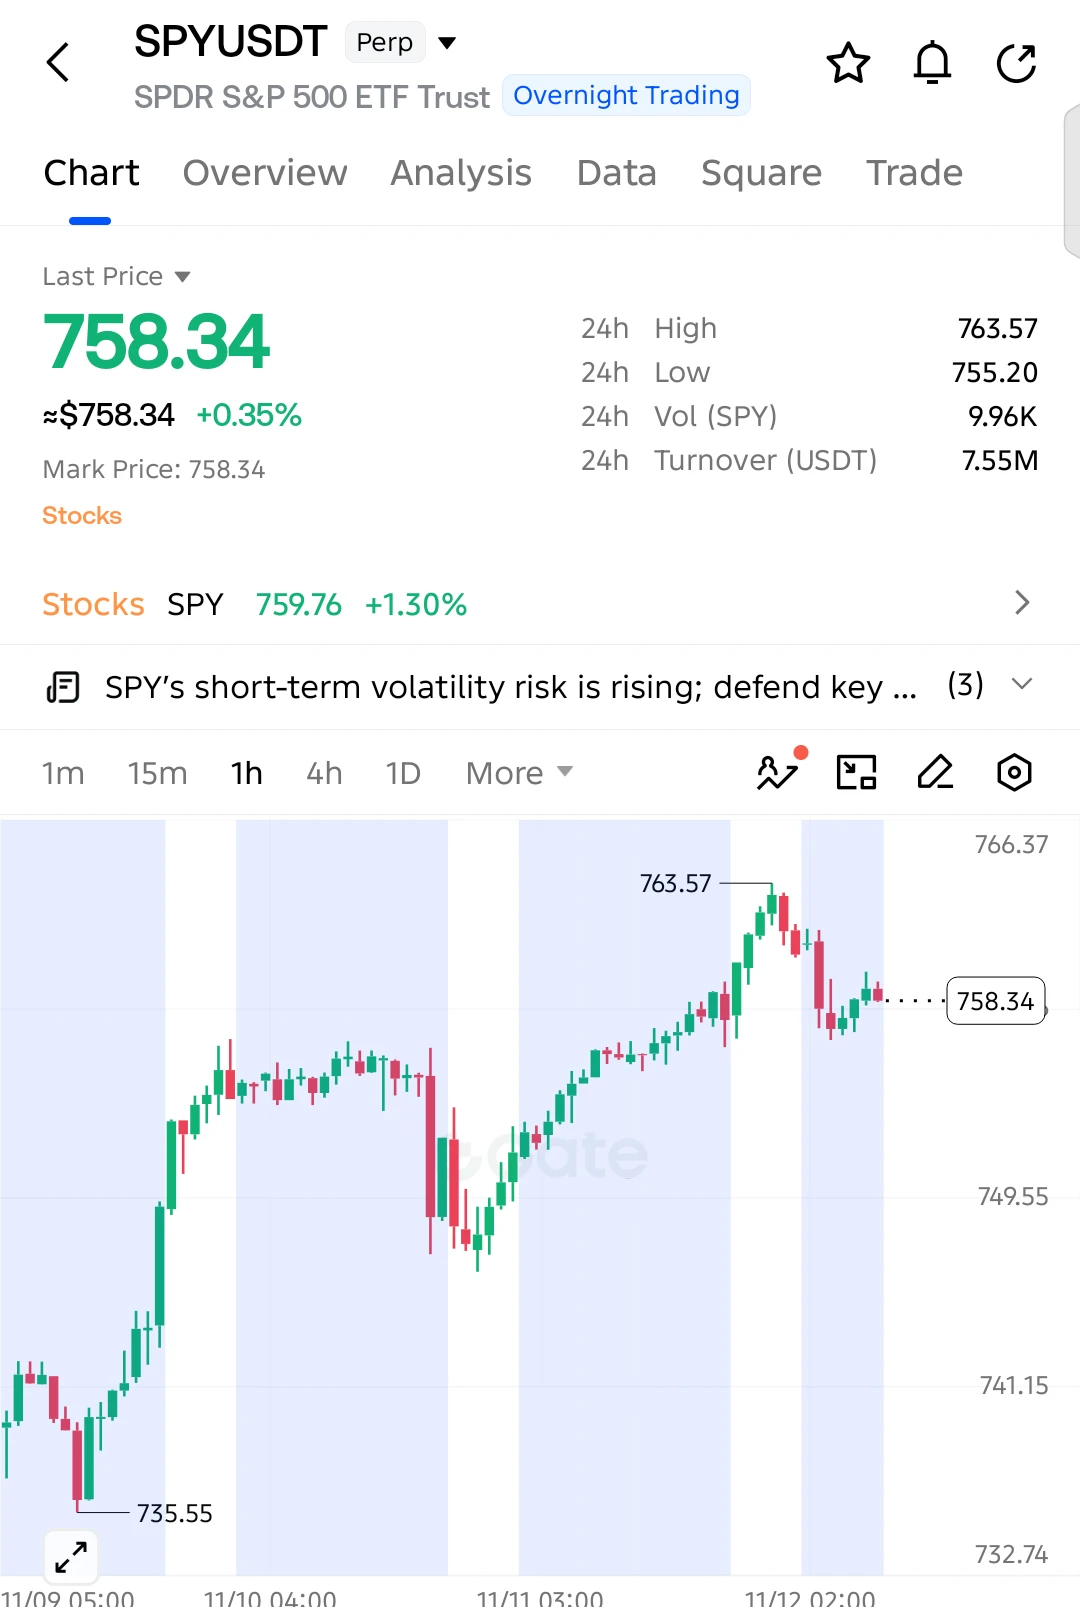
$SPY LONG SETUP — BULLS TARGET ANOTHER BREAKOUT!

Entry: 758.34
SL: 754.80

TP1: 760.50
TP2: 763.57
TP3: 766.30

$SPY is showing renewed buying interest after pulling back from 763.57. Buyers are defending the 755–756 support zone, keeping the bullish structure intact. Holding above this area could open the door for another rally toward the recent high.

Invalidation: A sustained break below 754.80 weakens the bullish setup.
post-image
SPY+0.06%
  • 5
Still unequivocally bullish today. Numerous on-chain and long-term indicators show that the bear market is over. The previous low of 57,700 was the definitive bottom for this year.

The awkward thing now is that U.S. stocks are rising while crypto remains very weak. We may not have completed the full correction yet, and this decline could ultimately stop around the 50% Fibonacci retracement level, near 72,500.

In any case, the short-term focus this week is still on buying dips, and the long-term outlook is bullish too!

Set an intraday bid to go long at 72,500, with a stop-loss at 71,800 and
post-image
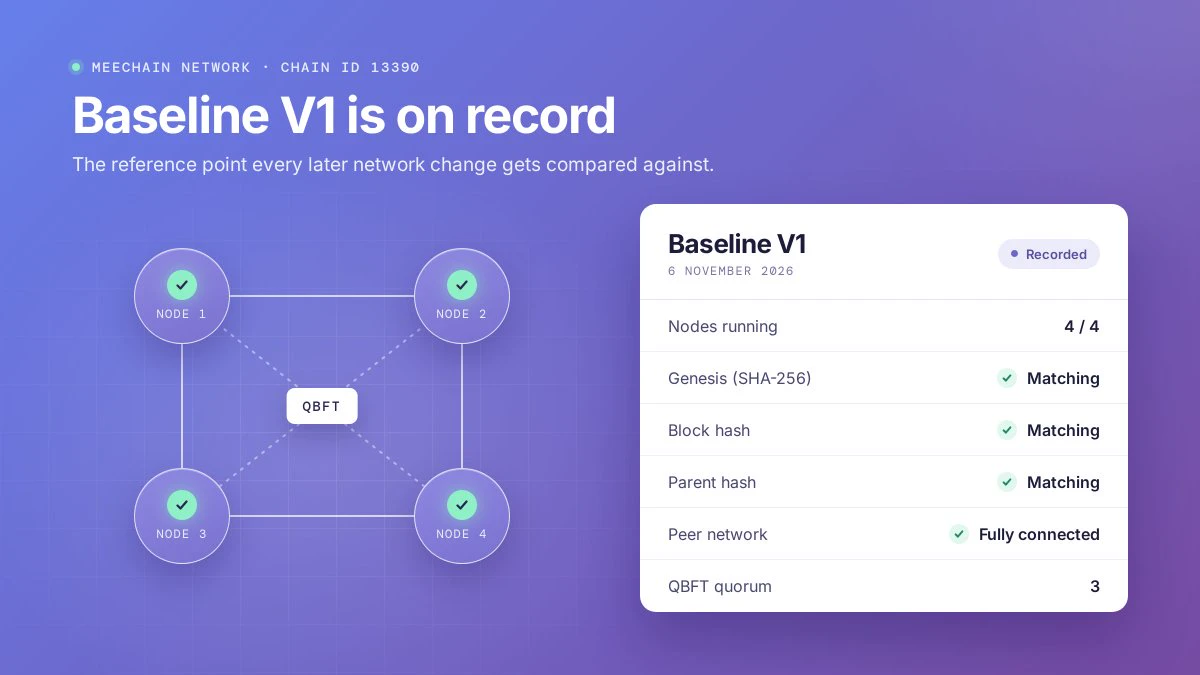
MeeChain Network is getting an Ops Dashboard where every health status links to the evidence behind it.
The Command Center prototype is built, and the baseline for all 4 QBFT nodes is on record. Future changes get compared against it.
post-image
Tariffs took effect unevenly, but the market didn’t behave by the textbook. I don’t buy it. The models say everything’s fine, but I want to look at the microstructure. Cracks are easiest to spot in the early hours, when liquidity is thinnest. If you think I’m talking nonsense, save this screenshot.
#Tariffs
post-image
  • 9
  • 2
So Strategy and Metaplanet have officially been kicked out of the game by MSCI!
MSCI confirmed it will remove Strategy and Metaplanet from relevant indices, effective after market close on November 30.
The reason is that MSCI views companies with 50% or more of their assets in Bitcoin as investment funds rather than operating businesses.
Immediately after the announcement, $MSTR fell about 3%.
Notably, JPMorgan had warned that outflows from $MSTR could reach $8.8 billion if other index providers follow MSCI.
For Strategy, this is clearly a major blow. Its large Bitcoin holdings were once an
post-image
MSCI+0.71%
BTC-0.67%
MSTR+1.10%
#WCTCS9 This rebound doesn't look particularly reliable. Tech stocks are rising on CoreWeave's better-than-expected results, while Bitcoin is mostly benefiting from short covering. Neither has confirmed a reversal.

AI tech stocks: Earnings support, but macro conditions are weak
Main driver of the rebound: CoreWeave's third-quarter revenue grew 168% year over year, and it also raised its full-year guidance.
A-shares riding on optical modules: On November 11, the ChiNext Index rose 3.11%, but excluding three stocks including Zhongji Innolight, almost all of the gains disappeared.
Rate hikes wei
CRWV+24.85%
BTC-0.67%
what do you think BTC WILL BE TODAY?
live-cover
LIVE1,138
U.S. stocks just rebounded across the board, but rumors of Jensen Huangs ouster have sparked another
live-cover
LIVE1,023
Why can a trading strategy work in a ranging market but fail in a trending market?

Have you ever encountered this situation?

A trading strategy performed well over the past few weeks. It sold when prices rose and bought when they pulled back, making repeated trades and still earning profits.

But suddenly one day, the market starts rising steadily, and the original strategy keeps selling, missing the subsequent move; or the market keeps falling, and the strategy repeatedly tries to catch the bottom, triggering stop-losses in succession.

The problem may not necessarily lie with the strategy
post-image
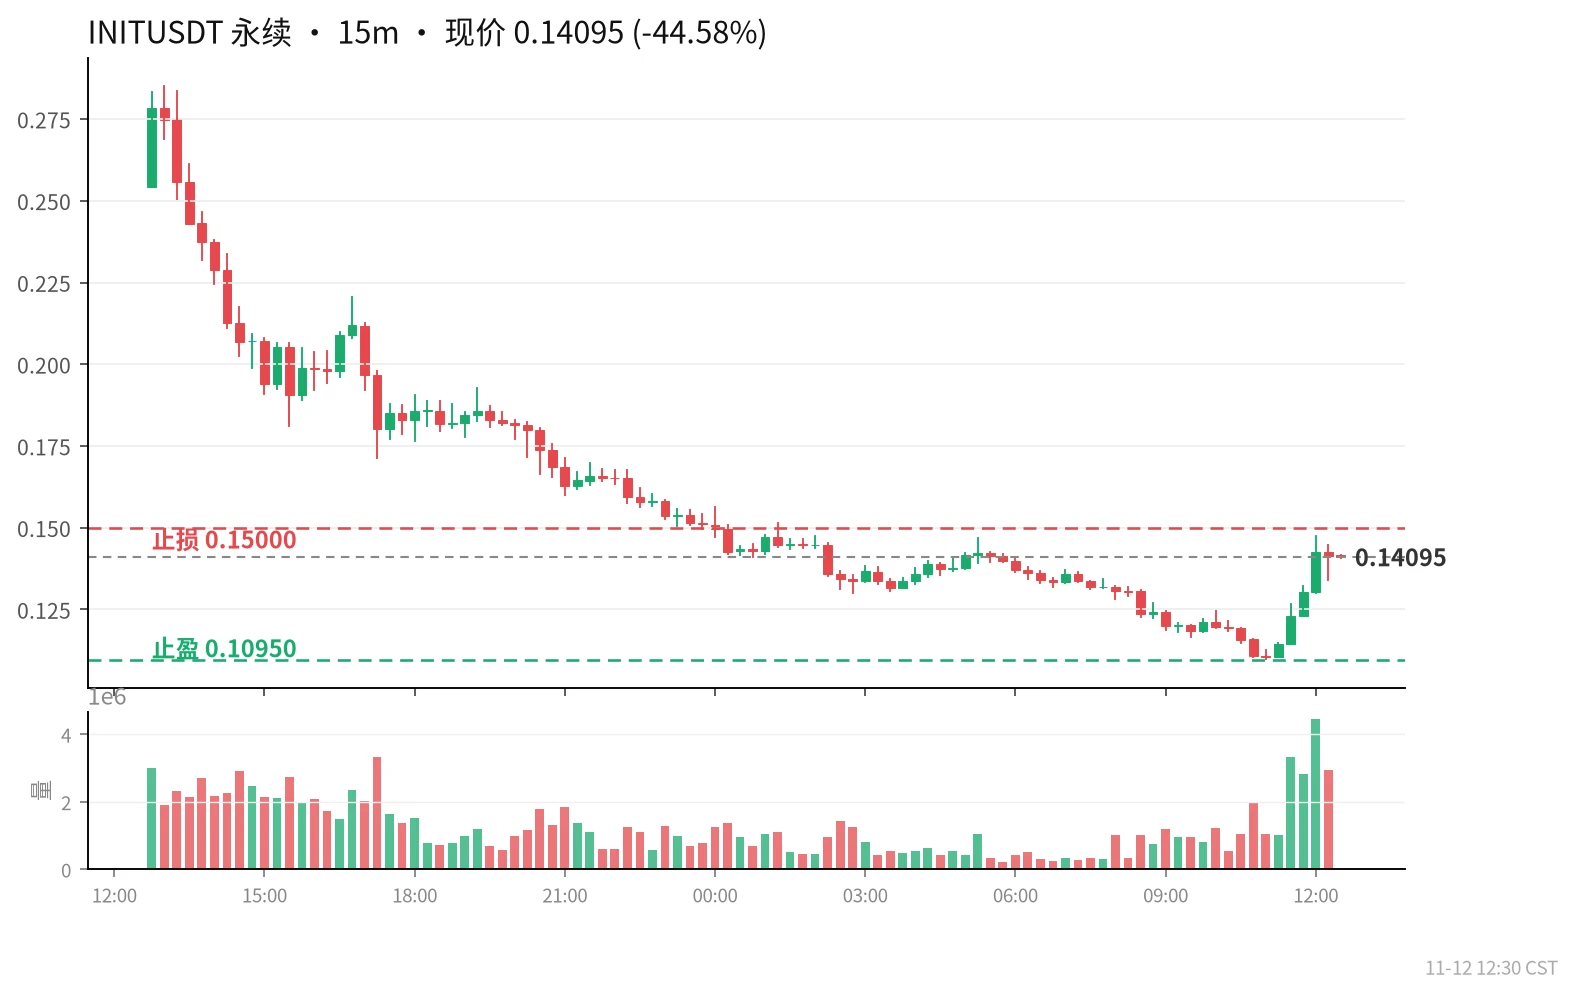
Hacked for the second time in three weeks, the chain is still halted, and the $INIT contract looks bearish. Cloud platform keys were leaked, and attackers forged withdrawals to transfer about $3.27 million, with $2.16 million frozen on the halted chain. The team says it will rebuild the infrastructure from scratch, but the restart date has not been set. The token price plunged from 0.285 to 0.109 today, down 43%, with over $1.2 billion in futures trading volume across the network. It bounced from the low, recovering from 0.109 to 0.141, up nearly 29%, but the first wall it hit was 0.15; yeste
post-image
INIT-1.74%
Why might a trading strategy that performs well in backtests fail in real markets?

If a trading strategy has high historical returns and a good win rate, does that mean it is worth committing real capital to?

Not necessarily.

Some strategies perform exceptionally well on historical data, but their returns drop significantly—or they even lose money consistently—once deployed in real markets.

The problem may not lie in the trading logic itself, but in the testing method, cost assumptions, or changes in market conditions.

I. Why can backtesting inspire confidence so easily?

Backtesting appl
post-image
🐋 WHALE WATCH : $MSCI is removing Strategy from its global indexes effective November 30.
Funds tracking those indexes hold roughly 13 million Strategy shares about 3.1% of the company. At todays close of $122.35 thats $1.6B in forced selling close to 60% of a normal days trading volume.
The date is set. The selling is mechanical.
post-image
MSCI+0.71%
In the defensive phase, I’m leaning bullish, with $BTC hugging 73589.6 and Fear & Greed at just 28
$BTC is currently at 73735.41, down just -0.19% in 24h. In the defensive phase, I’m leaning bullish. Rumors that the Russian central bank would open up trading on November 22 have been circulating for 21 hours; the market swung from 74709.84 to 73735.41, down -1.3%.

Why am I bullish? The funding rate is neutral at 8.214e-05, OI is 97431.23 and unchanged at 0.0% versus the archived figure, and the long/short account ratio is 2.6819; 24h trading volume is 1108953693 USDT, with a volume ratio of 0.
BTC-0.67%
Is this really a nightmare? It shouldn’t be, right? 🫣
post-image
Load More

Join 40 M users in our growing community

⚡️ Join 40 M users in the crypto craze discussion

💬 Engage with your favorite top creators

👍 See what interests you

Trending Topics

GateIPOAccessAnthropic

247.65k Views2.31k Discussing

Gate IPO Access Phase 3 features Anthropic (ANT), with USDT subscription interest starting from 100 USDT. Successful allocations will be delivered as real shares to Gate Stock Accounts. Indicative price: $70–$78/share Subscription: Nov 12–17 (UTC+8) Allocation is not guaranteed. Please manage risk accordingly.

USJoblessClaimsTonight

165.72k Views32.81k Discussing

JensenHuangCouldFaceRemoval

219.19k Views2.42k Discussing

View More