Square
Following
Hot
News
Notifications
Profile
Share your thoughts
placeholder
Article
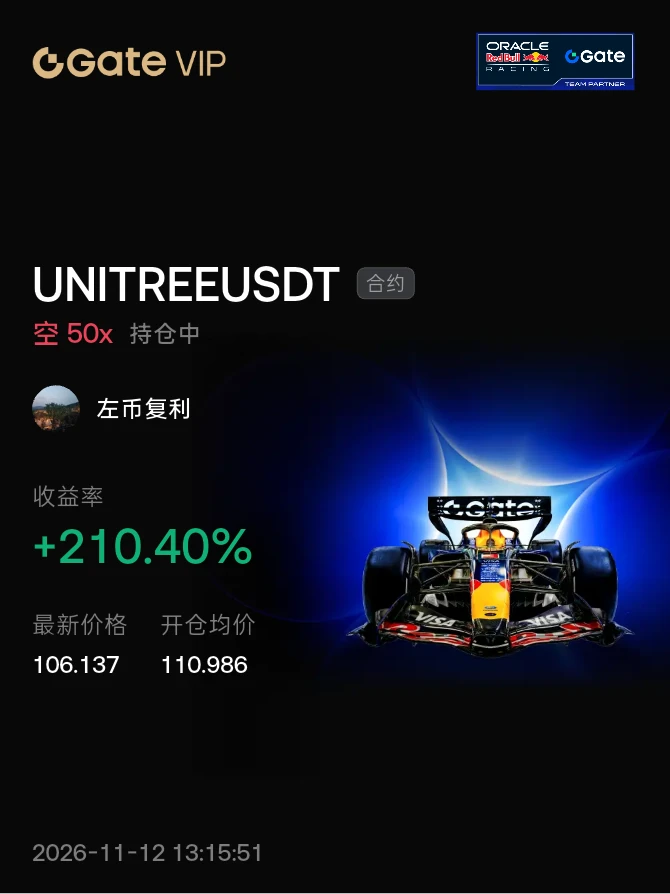
#晒出我的持仓收益 Looks like 20 cm is out of reach, but there’s still hope for 10 cm, hahaha
post-image
UNITREE+4.35%
⚡ Trading opportunities move fast. How can you stay one step ahead?
Gate Live seamlessly connects livestreams with trading, letting you quickly jump to the K-line trading page & follow streamer strategies with one click for a faster, more efficient trading experience!

🔹 Interact with streamers in real time and understand their trading logic
🔹 Copy strategies with one click, simple and easy
🔹 Customize your order amount for more flexible copy trading

💰 Learn more: https://www.gate.com/announcements/article/37519
GateLive
⚡ Trading opportunities move fast. How can you stay one step ahead?
Gate Live seamlessly connects livestreams with trading, letting you quickly jump to the K-line trading page & follow streamer strategies with one click for a faster, more efficient trading experience!
🔹 Interact with streamers in real time and understand their trading logic
🔹 Copy strategies with one click, simple and easy
🔹 Customize your order amount for more flexible copy trading
💰 Learn more: https://www.gate.com/announcements/article/37519
repost-content-media
Trenches
Max
M
bade
b
Max
5qaP...pump
Market Cap
$.
Change
.
24h Vol
$.
Holders
.
mihao
m
bade
b
mihao
4Cxj...pump
Market Cap
$.
Change
.
24h Vol
$.
Holders
.
AGT
A
bade
b
AGT
0x5d...e274
Market Cap
$.
Change
.
24h Vol
$.
Holders
.
DacityCoin
D
bade
b
DacityCoin
DKYc...pump
Market Cap
$.
Change
.
24h Vol
$.
Holders
.
Max
M
bade
b
Max
HPSp...h53z
Market Cap
$.
Change
.
24h Vol
$.
Holders
.
Holy shit! Holy shit! Holy shit!
What is this?
Urgent! Urgent! Urgent!
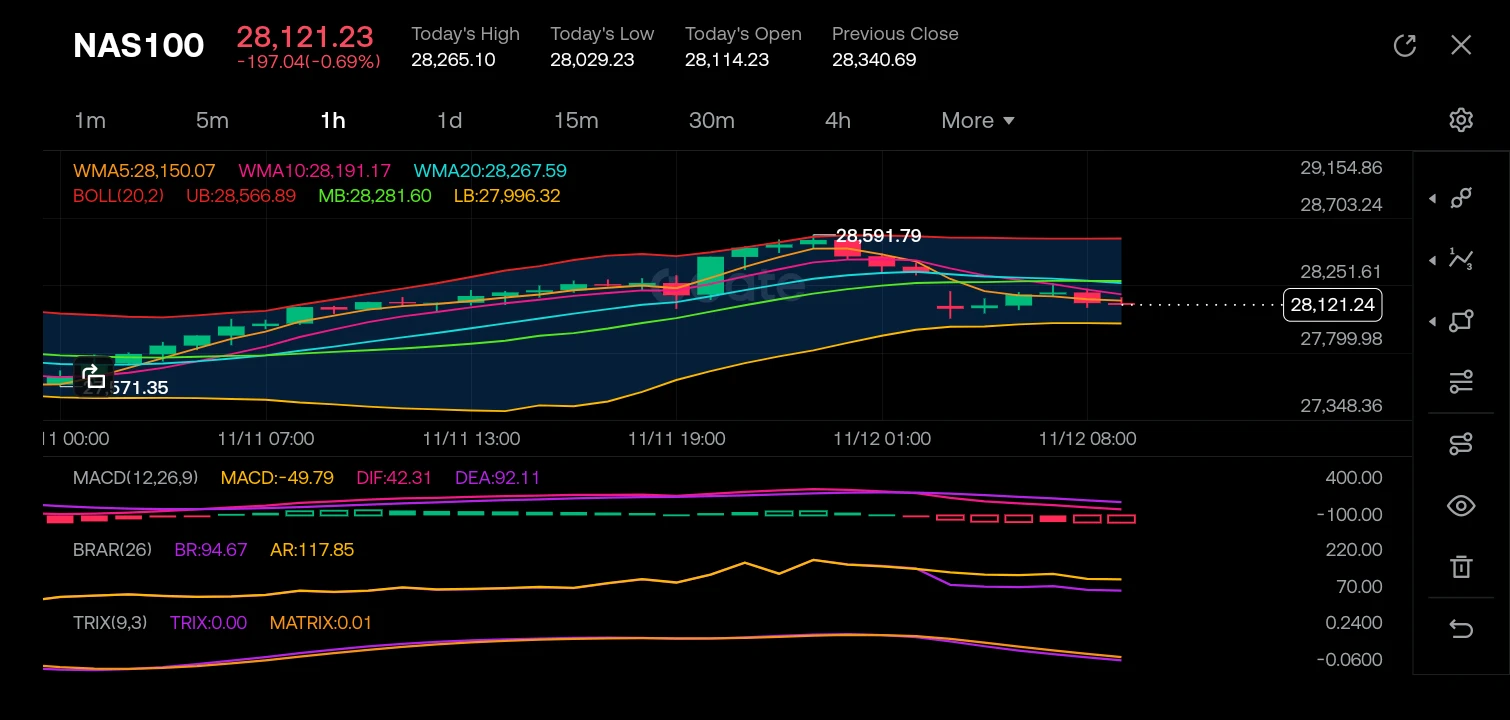
$NAS100 ‌
Looking at the 1h chart, the market structure has clearly shifted bearish, breaking down from the previous highs near 28,591.79 and creating a series of lower highs and lower lows. This downward momentum is imposing a bearish pressure across lower timeframes, invalidating any immediate bullish Gartley or harmonic reversal patterns that might have been forming near the top; instead, we are seeing a potential bearish continuation setup as the price tests structural support zones.

On the 5m and 15m charts, the K-lines are printing a series of red bearish candles, indicating strong int
post-image
NAS100-0.95%
  • 7
  • 2
Why can a trading strategy’s returns look stable while hiding significant risks?

A trading strategy earns a little every day, records multiple consecutive wins, and rarely suffers losses.

At first glance, this may seem like a very stable strategy.

But if the market suddenly reverses, the profits accumulated earlier may disappear quickly, or even turn into losses far beyond expectations.

Why does this happen?

Because stable returns do not mean low risk, and a high win rate does not guarantee long-term profitability.

To determine whether a strategy is reliable, you need to focus on the ris
post-image
The AI community has long been plagued by “middlemen swapping out the goods,” but the fact that large-model providers themselves are now launching an “exchange” is intriguing in its own right!

Today (November 12), at Baidu World Conference 2026, Robin Li officially launched “Token Exchange,” a trading platform for large models.

According to Li, a flurry of new models has been released over the past few months, and a whole host of token middlemen have sprung up. Developers often run into problems when buying APIs: prices for the same model can vary by several times, and ordinary users have no
post-image
ZHIPU AI-8.13%
Gm
rise and shineeeee my internet frens on ct
post-image
CT-12.34%
#美国10月CPI全面超预期 #每周来晒 The Warning Sign of Rising Rents—Commentary on October U.S. CPI

October U.S. core CPI exceeded expectations. Particular attention should be paid to the rise in the rent component: it has bottomed out and rebounded, which could make a return of inflation to the 2% target seem indefinitely out of reach. In recent months, month-over-month increases in rent and housing services have continued to rise, showing signs of breaking higher. In addition, U.S. rents, a leading indicator, had already begun rising earlier. Given their high weight, this means inflationary pressure could
XAU+0.38%
US PPI out tomorrow night! Inflation blows past expectations again, and Bitcoin and US stocks may get “schooled” by the market once more?

It’s exam time again for financial markets! The US October PPI will be released on November 13. This time, the test isn’t in math—it’s about how much investors’ wallets can take.
PPI is the Producer Price Index. Put simply, it tracks whether costs are rising for companies producing goods and providing services. If upstream costs keep climbing, companies may pass the pressure on to consumers, pushing overall inflation higher.
If this PPI comes in above marke
SPCX-2.32%
  • 11
Once a husband hands over his money, it’s no longer his own...
post-image
U.S. jobs data drops tonight! Are U.S. stocks and Bitcoin in for another roller-coaster ride, with rate-cut expectations hanging in the balance?

The U.S. labor market is set to deliver another report card tonight! Weekly initial jobless claims are due, and markets are watching for signs that the U.S. labor market is cooling.
Why does this data matter so much? Because a strong labor market could mean the U.S. economy remains resilient, leaving the Fed with no need to rush into rate cuts; but a significant increase in jobless claims could stoke concerns about an economic slowdown.
For U.S. stoc
SPCX-2.32%
  • 10
🔹U.S. Stocks Rebound, but Rumors of Jensen Huangs Ouster Trigger After-Hours Selling! Whats Next fo
live-cover
LIVE5,486
Morning alert: trade in batches. 4000–3974 has now broken through the first target, opening up 26 points of room, while the lows continue to push lower!$XAU #ZEC跌破1000美元 #黄金 ‌
XAU+0.38%
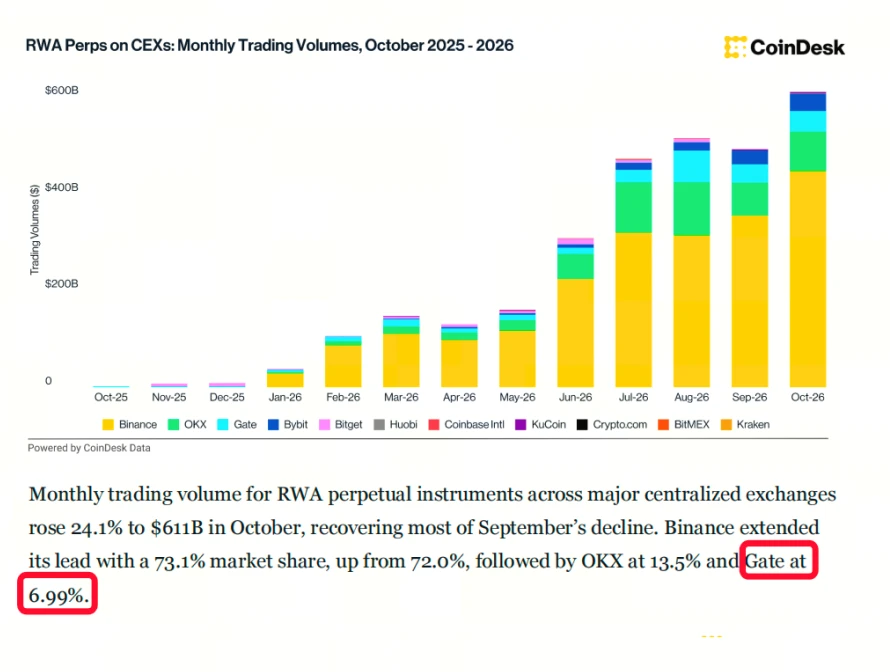
According to CoinDesk's latest October report, monthly trading volume for RWA perpetual contracts across major exchanges surged 24.1% in October, reaching $611 billion; meanwhile,
Gate captured 6.99% of the market, securing third place globally!

More and more capital now favors seamlessly switching between Crypto and traditional assets like US stocks and commodities in a single account, without the hassle of moving funds in and out. Ranking among the global top three in this emerging market shows that real money is flowing in, and that market depth and execution speed can fully withstand lar
post-image
#WCTCS9 2026.11.12 BTC/ETH/XAU/SNDK Analysis
The market saw an oversold bounce, especially in U.S. stocks, which rallied strongly. With further revelations about Lao Huang’s private life, most of last night’s gains have now been erased;
Gold and silver are seeking support further down as the probability of a rate hike in early December has risen sharply;
The crypto market has basically gone nowhere;
BTC
Support: 71300/68800/67135
Resistance tentatively in the 75475-78425 range
The key levels at this moment are 74600/72750; watch how they perform as the upper and lower bounds of a very short-te
DominanceWillMakeYou
2026.11.12 BTC/ETH/XAU/SNDK Analysis
The market saw an oversold rebound, especially in U.S. stocks. Further revelations about Huang’s personal life have now erased most of last night’s gains;
Gold and silver are moving further down to seek confirmation of support, as the probability of a rate hike in early December has risen sharply;
The crypto market has essentially gone sideways;
BTC
Support: 71300/68800/67135
Resistance: tentatively 75475-78425
For now, 74600/72750 are key levels to watch as the upper and lower bounds of a very short-term trading range;
ETH
Support: 1905-1920/1835
Resistance: tentatively 2215
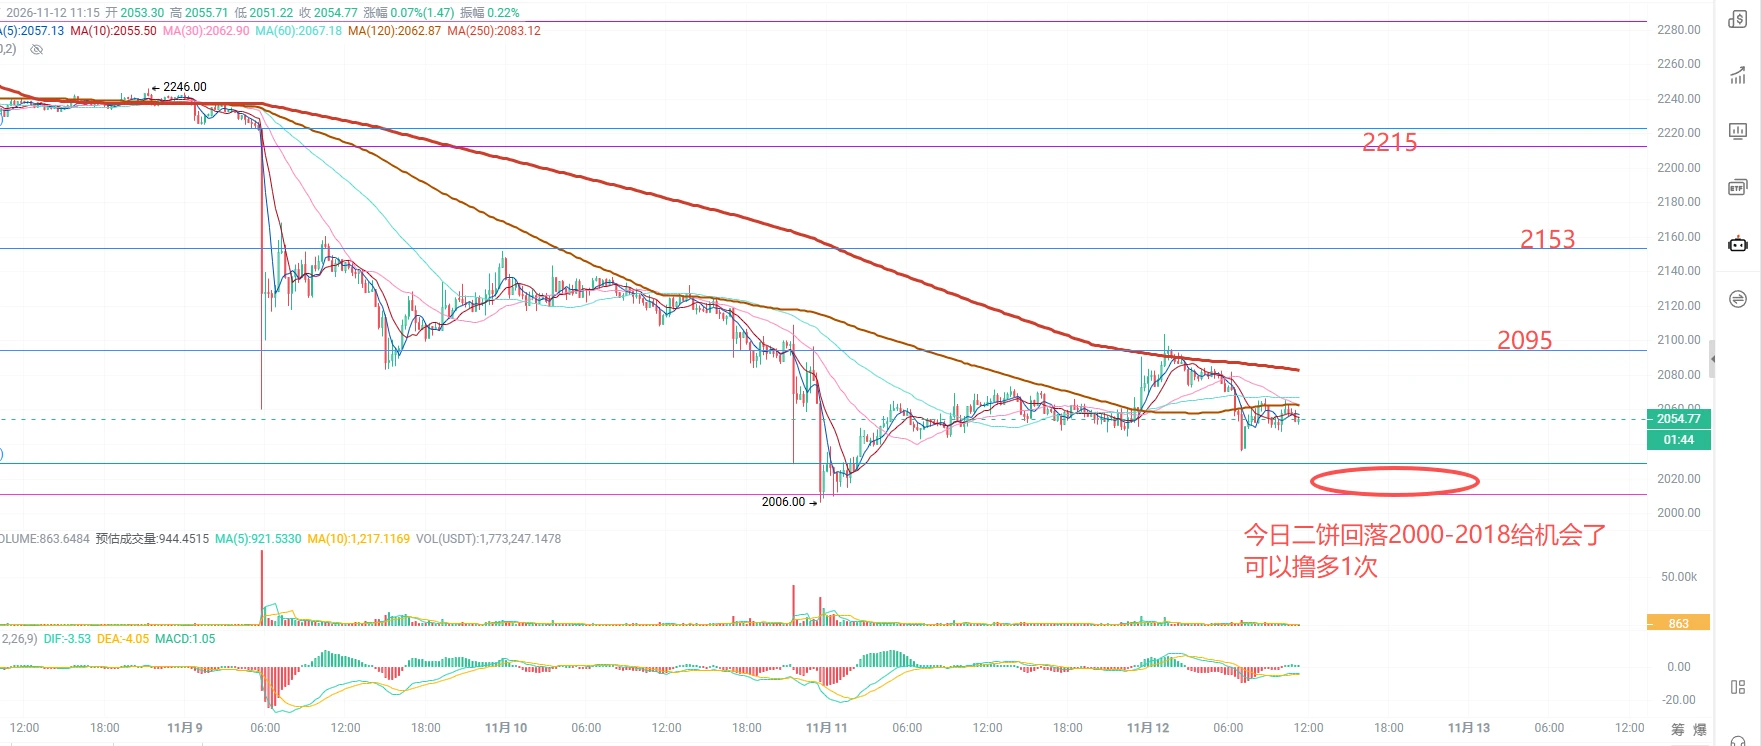
For now, 2010-2030/2095/2155 are key levels. ETH is currently in a high-volume trading zone, where turnover has been substantial over the past 2-3 years, so there are many support and resistance levels. Following BTC’s moves for a trade could work;
XAU is gradually coming under pressure as the probability of a Fed rate hike early next month rises. Will 3970-4000 see an incentive-driven contest during a second bottoming attempt, or will prices break down and test the reliability of support at 3900? Give it some time and see what the major players decide;
After surging to 1012 last night, SNDK is now pulling back in the very short term to test lower support. There’s no need to rush intraday; let’s see how far it pulls back. Opportunities usually come in the evening;
Trading suggestions do not constitute a basis for any investment decisions: This is a time to build spot positions in batches, but it’s not yet time for a reversal. Be sure to get your mindset right; when the market is quiet, learn to sit on your hands!
#Gate直通IPO第三期Anthropic
repost-content-media
BTC-0.67%
ETH-1.26%
GLDX-0.40%
PAXG+0.37%
XAG+0.47%
  • 2
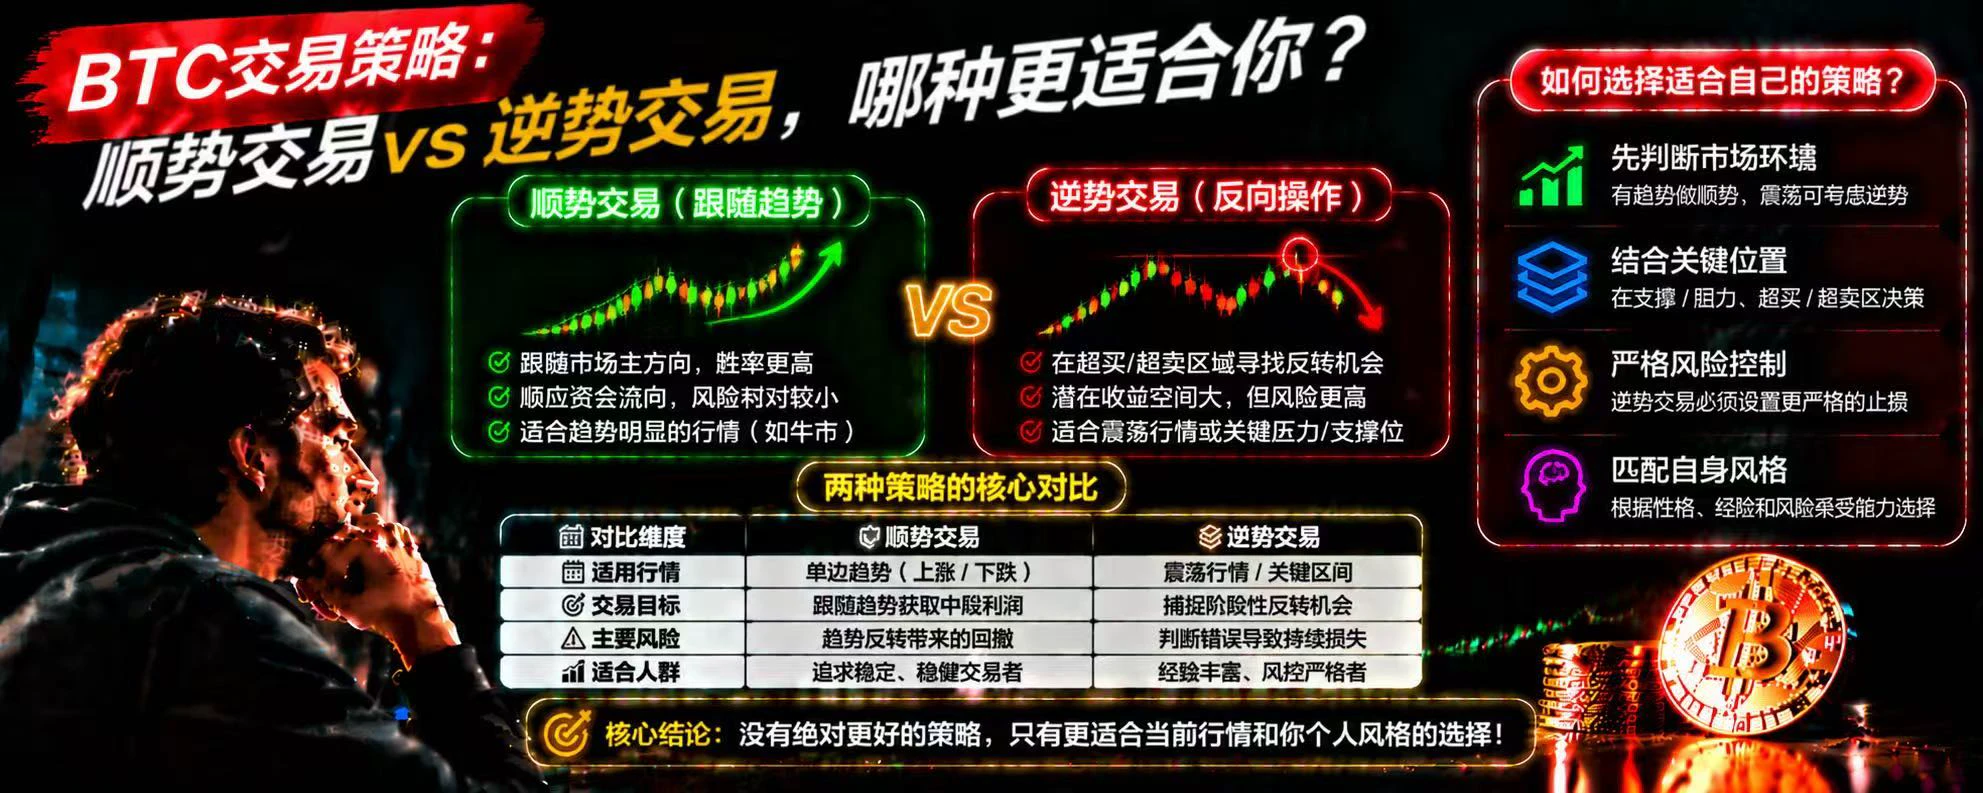
In BTC Trading, Which Suits You Better: Trend-Following or Countertrend Trading?

There are two very common trading strategies in BTC trading: trend-following and countertrend trading. Some traders like to follow the market trend, looking for opportunities to go long when prices rise and to go short when they fall; others like to look for market reversals after a sharp rise or drop in price. So, what exactly is the difference between these two approaches?

First, trend-following: follow the market’s main direction. The core of trend-following is identifying the current trend and trying to find
post-image
BTC-0.67%
When you buy an NFT, what do you actually own? The image, the copyright, or a record on the blockchain?

Many people encountering NFTs for the first time think of them as digital images that can be bought, collected, and resold.

But the core value of an NFT is not just the image itself. It lies in using the blockchain to record ownership and transfers of a specific token. The real question to understand is: What rights do you actually acquire when you buy an NFT?

I. Owning an NFT Does Not Mean Owning the Copyright

Buying an NFT usually means you gain control of that token on the correspondi
post-image
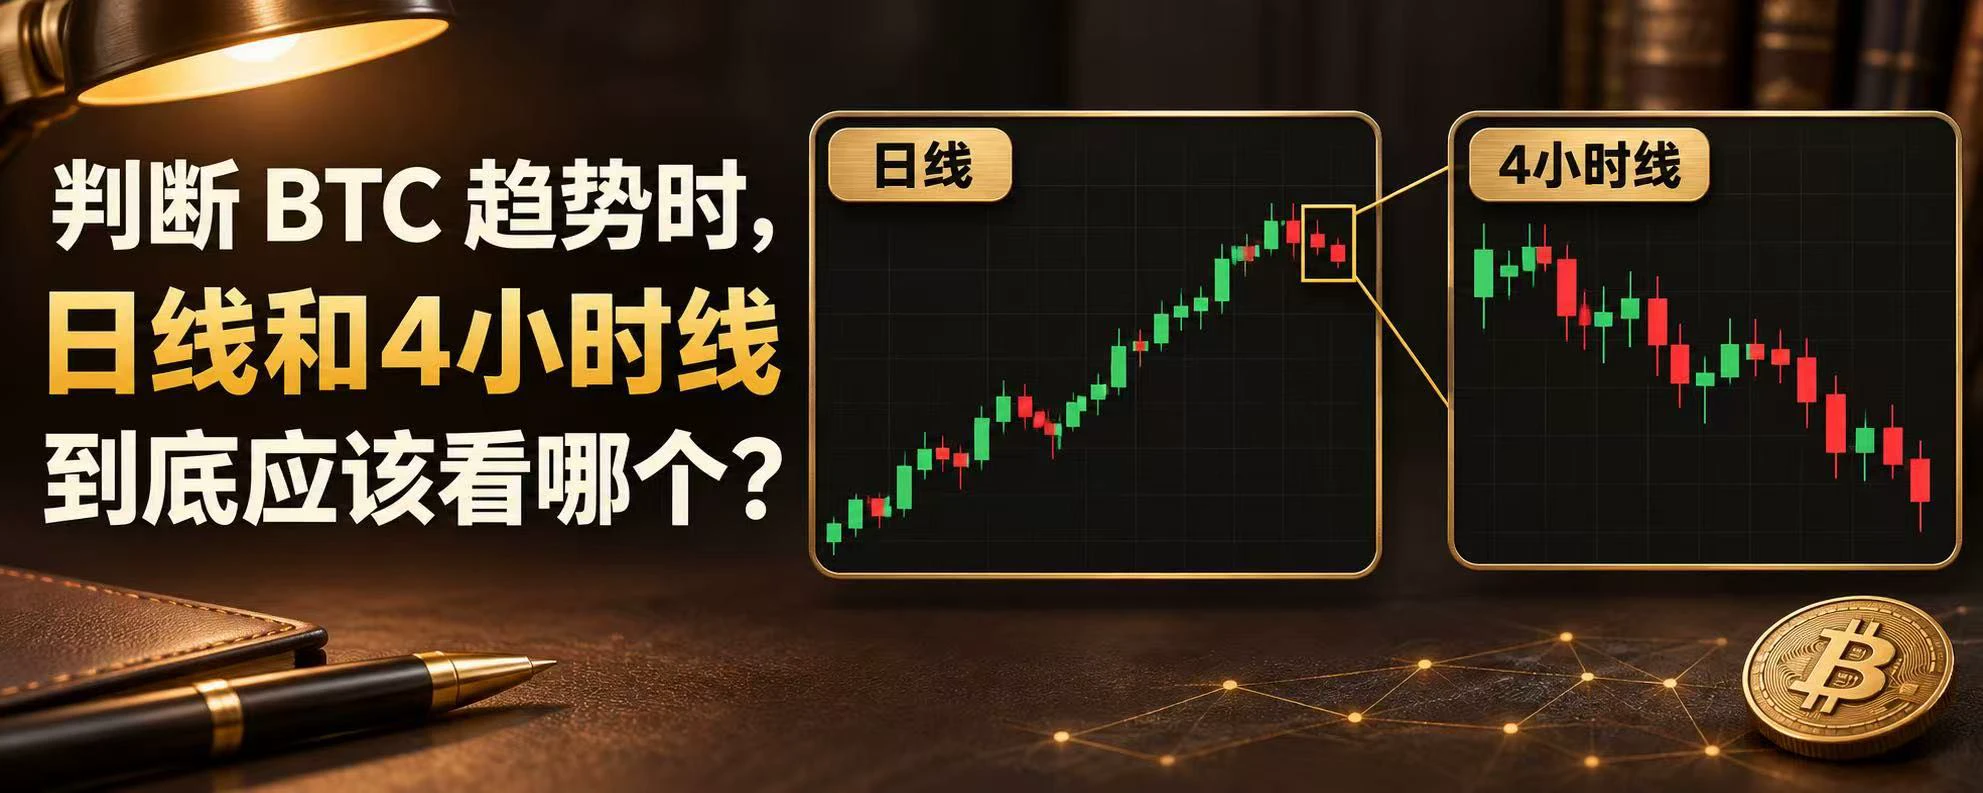
When judging the BTC trend, should you look at the daily or 4-hour chart?

In BTC trading, many people look at candlestick charts every day but often run into the same problem: the daily chart looks like it’s moving up, while the 4-hour chart has already started falling; the 4-hour chart shows a buy signal, while the daily chart is still in a downtrend.

Which timeframe should you trust?

In fact, the daily and 4-hour charts do not contradict each other; they serve different purposes.

First, the daily chart is mainly used to determine the overall direction. It can help us see whether the mark
post-image
BTC-0.67%
#美国10月PPI即将出炉 #每周来晒 Inflation through the roof, but rate hikes are already fully priced in: PPI is a blank shot

Tomorrow night at 21:30, the U.S. October PPI. The market expects the year-over-year rate to rise from 6.3% to 6.6%, marking its biggest increase since December 2022, while the seasonally adjusted month-over-month rate falls from 1.3% to 0.4%.

The year-over-year figure alone is certainly alarming. But break it down, and the year-over-year and month-over-month numbers are at odds. September's PPI surged because of energy: energy PPI rose 10.8% in a single month, and gasoline rose 20
GAS-0.81%
BTC-0.67%
  • 3
Crypto market update
live-cover
LIVE2,017
Load More

Join 40 M users in our growing community

⚡️ Join 40 M users in the crypto craze discussion

💬 Engage with your favorite top creators

👍 See what interests you

Trending Topics

GateIPOAccessAnthropic

248.72k Views2.31k Discussing

Gate IPO Access Phase 3 features Anthropic (ANT), with USDT subscription interest starting from 100 USDT. Successful allocations will be delivered as real shares to Gate Stock Accounts. Indicative price: $70–$78/share Subscription: Nov 12–17 (UTC+8) Allocation is not guaranteed. Please manage risk accordingly.

USJoblessClaimsTonight

166.1k Views32.82k Discussing

JensenHuangCouldFaceRemoval

220.19k Views2.43k Discussing

View More