Share your thoughts
placeholder
Article
No conviction, can't hold—the profit on this move is paper-thin, but I love it. While everyone was still watching from the sidelines, the wall above $CYS was pressing down loud and clear. Every rebound was pushed right back down. I opened a short at 0.4520 without overthinking it.

The logic was simple: the rebound lacked strength, support was insufficient, and volume failed to follow. Each push upward was weaker than the last—this kind of move is just handing the bears a knife. It kept choppy trading intraday, and I was honestly nervous too, but as long as the direction held, I kept holding
post-image
CYS-8.45%
ADA-4.17%
ZEC-9.88%
Nobody is talking about $VVV /USDT yet, and the setup is already live.

$VVV /USDT - LONG

Trade Plan:
Entry: 24.046 – 24.556
SL: 21.851
TP1: 26.139
TP2: 27.364
TP3: 29.202

Why this setup?
Why now? The daily trend is bullish, the 1h price sits at 24.301, the 15m RSI reads 51.94 and the 1h ATR is 1.021022, which together define a precise entry zone between 24.046 and 24.556. The bullish daily trend confirms directional conviction, while the mid-range RSI shows room to run without being overextended. The 1h ATR of 1.021022 sets realistic volatility-based targets at TP1 26.139 and TP2 27.364.
VVV-1.41%
$MET Signal】Long + 1H volume breakout/4H MACD expansion
$MET 1H volume breakout, current price 0.2468 above the 1H Bollinger upper band at 0.2405, RSI 75.98, order book depth -5.10%, with sell walls slightly thicker.
🎯 Direction: Long
⚡ Entry/limit order: 0.246060 - 0.246800
🛑 Stop-loss: 0.244332
🚀 Target 1: 0.250502
🚀 Target 2: 0.252353
🛡️Trade management:
- Execution strategy: Reduce the position by 50% after reaching Target 1, and move the stop-loss up to the breakeven level. If the price falls back to the entry level, exit automatically to protect the principal.
Depth logic: The 4H
post-image
MET+17.18%
BTC-1.24%
ETH-0.01%
SOL-1.75%
Why everyone piling into SOXL shorts right now might be about to get crushed

$SOXL /USDT - SHORT

Trade Plan:
Entry: 117.98 – 119.00
SL: 123.39
TP1: 114.81
TP2: 112.36
TP3: 108.68

Why this setup?
Why now? The 1D trend is range, which means the market is coiled and waiting for a decisive break, and the 1h ATR of 2.043247 confirms enough volatility to push through any zone. The 15m RSI at 62.05 shows momentum is not yet exhausted, so the entry zone at 118.49 offers a precise trigger for a short. The daily bias favors sellers targeting TP1 at 114.81 and TP2 at 112.36, where the 1h price acti
SOXL-3.72%
Currently 12 shots for the day, 2 bamboo-shoot shots, Luodai 1949🔪
It’s impossible to get your way every time. Don’t panic when setbacks arise, and seize opportunities decisively when they come. $XAU
post-image
XAU-1.13%
Tokenized equities proved exactly why putting stocks onchain was a great idea all along, ppl don’t need to wait for markets to open, 24/7 is the way to go.
The 42 largest tokenized equities did $1.01B in vol across Saturday + Sunday, basically matching Friday’s entire session.
🔸Robinhood Chain alone: $572.8M
🔸56.7% of all weekend vol
🔸Labor Day: another $398.3M
That’s over $1.4B traded while US markets were closed.
The interesting bit now is whether weekend pricing starts leading Monday’s open.
Cause if it does, tokenized equities aren’t just tracking the market anymore. They’re helping pr
post-image
🇺🇸 FED TO INJECT $2.12B LIQUIDITY TODAY!
The US Fed will inject $2.122 Billion into the economy today.
This settlement will provide a direct liquidity boost to the financial markets.
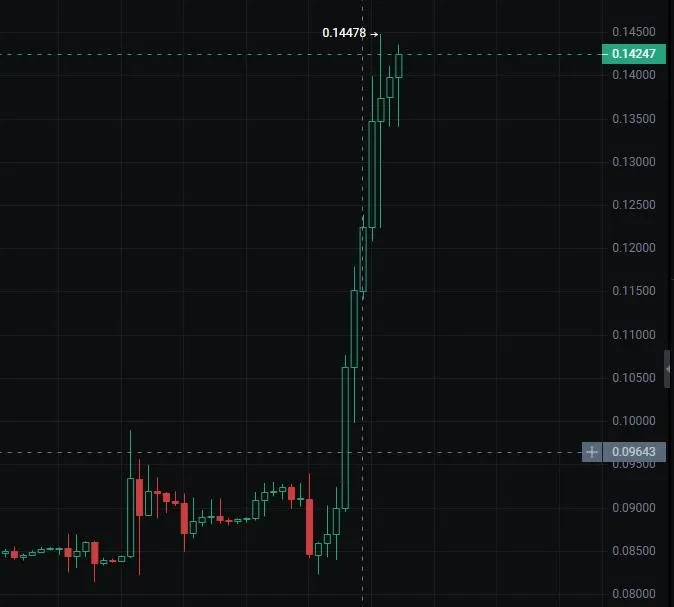
The profit margin is thin, but it grew on its own—I didn’t touch it. Before the market had fully started moving, I saw $AKE consolidating at the lows and judged that funds were quietly entering, so I waited for a pullback to stabilize and took a position around 0.0101698. No extra moves; I placed the order and went to handle other things.
When I came back, the price had already reached 0.0144903, with unrealized gains of +1040.27%. It felt great, but it was just a normal realization of profits. Staying out of the market isn’t a sin; opening positions recklessly is the mistake. Even if you only
post-image
AKE-8.08%
XRP-2.66%
ZEC-9.88%
Smooth @Plasma
post-image
XPL-3.04%
#GateMeme
Memes are not just jokes anymore. In crypto, a good meme can capture market sentiment faster than a long analysis ever could.
One minute the market is calm, the next minute Bitcoin moves, a token suddenly pumps, and the entire timeline turns into a meme factory. That is the culture of crypto: fast markets, unexpected moves and a community that knows how to turn almost every market moment into content.
Gate Meme brings that culture closer to the trading experience.
The interesting part is that meme culture and trading often move together. When sentiment becomes bullish, memes become
post-image
BTC-1.24%
  • 1
  • 1
Is this really a rebound, or CPR for my empty account? I just refreshed, and +1279.9% went straight into the account—5.249 versus 7.149, with the timing absolutely spot-on.

Back to the entry. When the market dumped early this morning, I knew something was off the moment $PROM was pulled back up: the volume was much lower than before, trading volume was pitifully low, and there was basically no one buying into the move. I opened a short at 7.149.

The signal at the time was crystal clear: insufficient buying support, don’t chase longs.

If you’re not confident in a trade, taking a look kee
post-image
PROM-5.08%
LAB+11.96%
SNDK-2.73%
This was purely the market being in a good mood, casually tossing out some gold coins that happened to hit me on the head. 😎

Right after lunch, while checking the charts, $OKB pulled back to a key level and held firm, with buying clearly more aggressive than in the morning. I judged that this wasn’t a fake rebound—someone was genuinely buying with real money. So I opened one long position at 96.30; if I’m wrong, I’ll admit it, and if I’m right, I’ll hold.

The current price has just reached 111.42, and the floating profit is already +384.53%. It really dragged beforehand, but the move tur
post-image
OKB+1.10%
SNDK-2.73%
BNB-0.59%
No big-picture thinking, I can’t hold on, and the profit on this move is paper-thin—but I love it. 😆 What you can take is yours; if you get too greedy, you often end up with nothing left. This may sound cowardly, but in futures trading, staying alive matters more than anything.

During the repeated intraday fluctuations, I kept my eyes on the $SNDK bottom area. The price pressed down several times but couldn’t break that line, and the signs of funds quietly entering were obvious. Building a base without breaking down is an invitation to enter. At around 1586.74, I went long directly. Don’t l
post-image
SNDK-2.73%
ZEC-9.88%
ADA-4.17%
Most traders are sleeping on this SHORT setup for $XAU /USDT right now.

$XAU /USDT - SHORT

Trade Plan:
Entry: 4350.34 – 4359.62
SL: 4399.49
TP1: 4321.60
TP2: 4299.34
TP3: 4265.96

Why this setup?
Why now? The 1h price sits at 4354.98, perfectly aligning with the entry zone between 4350.34 and 4359.62, while the 15m RSI at 57.82 shows neither overbought nor oversold conditions. The 1h ATR of 18.545588 confirms enough volatility to reach the first target at 4321.60 and push toward 4299.34 if momentum sustains. The daily trend being range-bound supports fading this move, but the invalidation
XAU-1.13%
Layout for Bitcoin, Ethereum, and Dogecoin
live-cover
LIVE1,332
【$Hajimi Signal】Long + 4H mid-band support / order-book sell-pressure absorption
$Hajimi is ranging above the 4H Bollinger mid-band at 0.0389, with the current price at 0.03982, RSI at 36.06, and ATR at 0.0057. The order-book buy/sell depth ratio is 0.78, with a depth imbalance of -12.29%; sell-side orders are heavier. The recent 4H buy-trade ratio is 0.43-0.50, OI Stable, and the latest volume is 23.6M, down from 216M in the previous candle.
🎯Direction: Long
⚡Entry/orders: 0.0397005 - 0.0398200
🛑Stop-loss: 0.0394218
🚀Target 1: 0.0404173
🚀Target 2: 0.0407160
🛡️Trade management:
- Executio
post-image
哈基米+42.52%
BTC-1.24%
ETH-0.01%
SOL-1.75%
#WLD5S , will it keep rising? Up and down, down and up.
post-image
WLD5S+13.65%
$ETH dropped to $2,406 after PPI yesterday, but the reaction got bought up fast and price reclaimed $2,464.
Now CPI is the next major test.
Oil is still above $100 and rate hike odds remain around 70%, so volatility could stay high.
For me, $2,350 is the key level.
Hold above it through FOMC and $2,800–$3,400 comes into play.
Lose $2,350 and ETH could see a much deeper move toward $1,900.
#GateTop4MainstreamCEX
#AugustCPIDropsTonight
post-image
ETH-0.01%
  • 4
  • 1
Section Chief's ICT Trading Cognition Course, Issue 03 (Market Structure)
90% of losing trades fail to answer one question before entry: Is the market currently in an uptrend, a downtrend, or a consolidation range? ICT calls this “reading structure,” and it is the foundation of all analysis.
1. ICT uses four letters to describe trends:
HH (Higher High) + HL (Higher Low) = uptrend. Each pullback low is higher than the previous one, showing that buyers are willing to step in at higher prices.

LH (Lower High) + LL (Lower Low) = downtrend. Each rebound high is lower than the previous one, showing
post-image
[CPI]🔹U.S. August CPI is about to be released, with the market expecting headline CPI to rise appr
live-cover
LIVE1,768
Load More

Join 40 M users in our growing community

⚡️ Join 40 M users in the crypto craze discussion

💬 Engage with your favorite top creators

👍 See what interests you

View More