Share your thoughts
placeholder
Article
Everyone is sleeping on SYMBOL while the daily trend screams bullish.

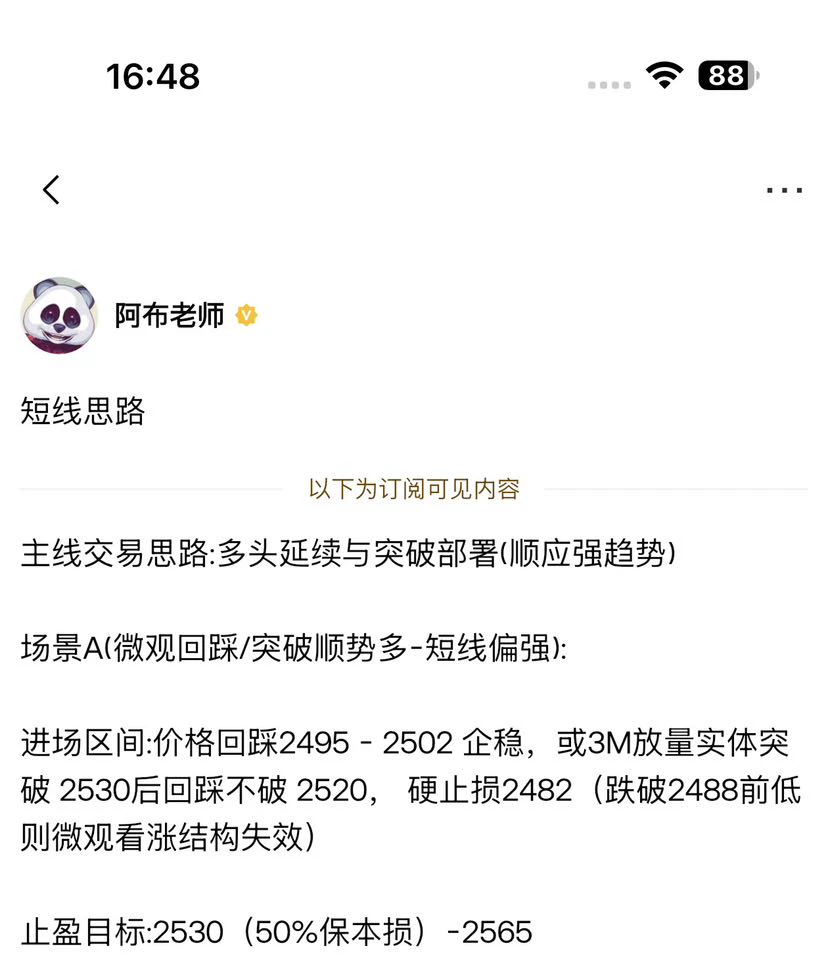
$ETH /USDT - LONG

Trade Plan:
Entry: 2506.23 – 2520.33
SL: 2445.59
TP1: 2564.05
TP2: 2597.89
TP3: 2648.65

Why this setup?
Why now? The daily trend is firmly bullish, giving the long bias a strong macro foundation. The 15m RSI at 37.32 shows the short-term pullback still has room to bounce without being overextended. The 1h ATR of 28.20 means a single candle can cover meaningful ground, so patience at the 2506.23 to 2520.33 entry zone rewards those who wait for confirmation. Targets sit at 2564.05 for TP1 and 2597.89 fo
ETH+2.56%
#每周来晒 #8月CPI数据出炉 The overall U.S. CPI data for August was broadly in line with expectations (3.4% year-on-year), but the month-on-month increase (0.4%) hit a new high since June, while core CPI month-on-month (0.3%) rebounded above expectations, indicating that the pace of inflation cooling has slowed and stickiness remains. Combined with recently stronger employment and PPI data, the report significantly boosted expectations for a September Fed rate hike and had a clear differentiated impact on various asset prices.
I. Impact on Federal Reserve policy expectations
1. Rate hike expectations ro
USIDX0.00%
GLDX+0.43%
PAXG+0.40%
XAUUSD+0.74%
  • 8
  • 1
#AugustCoreCPIBeatsExpectations
#每周来晒 #8月CPI数据出炉
August CPI: Has the Fed’s Rate Path Changed?
The latest U.S. CPI report has changed the short-term macro picture significantly. August headline CPI increased 0.4% month over month, while annual inflation remained at 3.4%, unchanged from July. Core CPI, excluding food and energy, increased 0.3% month over month and 2.4% year over year. The headline and annual numbers were broadly in line with expectations, but the monthly core reading was firmer than expected.
For me, the most important point is that inflation is still well above the Federal Re
post-image
Nobody is talking about this SYMBOL setup hiding in plain sight

$XAU /USDT - SHORT

Trade Plan:
Entry: 4354.83 – 4362.59
SL: 4396.00
TP1: 4330.74
TP2: 4312.10
TP3: 4284.13

Why this setup?
Why now? The daily trend is range, which means the price is coiling for a directional move and the 1h ATR of 15.536692 confirms enough volatility to fuel a strong breakdown. The 15m RSI sitting at 48.73 shows the short-term momentum is neither overbought nor oversold, giving the setup room to breathe before extension. The entry zone anchored at 4358.71 with a tight spread between 4354.83 and 4362.59 prov
XAU+0.44%
The hand that set the stop-loss a few days ago trembled slightly; this morning I realized that was unnecessary filial piety.
The last thing I saw before bed, $SOXL was moving sideways near the bottom around 116.25, grinding out a base without breaking down, while funds quietly entered. I saw that the buying support was solid, so I casually suggested a long setup. When others were still watching from the sidelines, this kind of level tested patience the most—hold on, and there would be more to the story.
When I opened the chart this morning, it had already reached 123.05, with the long positio
post-image
SOXL+7.98%
BNB+2.46%
ADA+0.92%
market update
live-cover
LIVE615
Everyone is sleeping on SYMBOL while the daily trend screams bullish.

$HYPE /USDT - LONG

Trade Plan:
Entry: 78.540 – 79.146
SL: 75.937
TP1: 81.022
TP2: 82.475
TP3: 84.654

Why this setup?
Why now? The daily trend is firmly bullish, giving us a higher-timeframe tailwind that most traders are ignoring right now. Meanwhile the 15m RSI sits at just 33.64, meaning short-term sellers have overextended and a bounce is statistically overdue. The 1h ATR at 1.210681 tells us normal volatility can carry us through entry zone 78.540 to 79.146 without getting chopped out. From there TP1 at 81.022 and
HYPE+0.12%
👀 $HYPE is loading the $LUNA pattern: 99% complete. Only move left is to come back home to ZERO
post-image
HYPE+0.03%
LUNA+3.80%
Most traders will miss this ETH setup hiding in plain sight

$ETH /USDT - LONG

Trade Plan:
Entry: 2504.14 – 2518.24
SL: 2443.50
TP1: 2561.96
TP2: 2595.80
TP3: 2646.56

Why this setup?
Why now? The daily trend is bullish while the 1h price sits at 2511.19, the exact entry_ref level where momentum is shifting. The 15m RSI at 41.59 shows room to run before overbought, and the 1h ATR of 28.203027 confirms enough volatility to push toward TP1 at 2561.96 and beyond to TP2 at 2595.80. The entry zone between 2504.14 and 2518.24 offers a tight, high-confidence range for a LONG position, but the lin
ETH+2.56%
The moving averages are weighing on the price, and the rebound was met with resistance near the key level, so I chose to short rather than wait for a breakout and chase longs. The longer $ROBO grinds in this range, the greater the probability of a downside break.
After entry, there was a small wick that brought the price close to the stop-loss without triggering it. I chose to hold through this kind of fake move for a while longer. When the actual breakdown came, there was no hesitation—the bearish candle continued pushing the price lower, and nearly every rebound failed to reclaim the previou
post-image
ROBO-0.95%
BTC+0.53%
DOGE+1.27%
I was just about to go to the forum and rant, but then I saw my balance and gave up—the market daddy is always right🙏.
Since the top started forming, I’ve been watching $BEAT . Every intraday push higher fell just short, while trading volume visibly shrank, clearly showing heavy resistance overhead. A few afternoons ago, I decisively opened a short at 0.1345 and warned people not to chase longs. When I opened the chart this morning, the price had already dropped to 0.0938, with floating profit at +603.13%. I nailed the rhythm on this move🎯.
Take profits when it’s time: I closed 80% first, lea
post-image
BEAT+19.35%
SOL+2.61%
SNDK-2.89%
Trending topics updated!
Apple's event just wrapped, SK Hynix hit a new high, and US stocks saw their sixth-largest inflow since 2008… A lot of headlines today. Which one are you watching?
Trending posts get a traffic boost — post on Square with the hashtag and share your take. The market is moving — don't let your view sit idle.
👉 https://www.gate.com/post/topic
AAPL+1.71%
SK Hynix-2.21%
SKHY+1.00%
SKHYV-0.98%
  • 8
market prices updaes of $MEME COINS
live-cover
LIVE88
Thanks to the teachers for taking us to chase dog coins these past two weeks
Finally, over the weekend
you’re making money and going on vacation
while I’m starting work
#rohinhood #bsc #solana #Base
post-image
SOL+2.49%
JUST IN: Blockstream won’t pay ransom for Liquid Network theft, vowing to track and recover stolen Bitcoin via legal channels and forensics if needed. $BTC
post-image
BTC+0.46%
All the mid cap memes like a-meme-coin:native and boner-coin:native got crushed
Be careful out there
MEME+3.39%
BONER-19.83%
I was just about to curse it out, but then I looked at the account and thought, forget it—let it pump however it wants, I’ll keep quiet. When I opened the charts this morning, $DOGE had already left DOGE’s bottoming zone, with funds quietly flowing in, and I flagged a long position around 0.07003.
It feels so good—when you get the timing right, 0.08417 puts +1878.26% right in front of you. Those who endured the grind should understand.
Take profit on 80% first, move the stop-loss up to the entry price, and keep holding the remaining 20%. If it keeps pushing, let the profits run.
Have a strate
post-image
DOGE+1.27%
ZEC+5.93%
ADA+0.92%
#bitcoin
The price of long-term money has already undone the trade that lifted Bitcoin. The 30-year Treasury yield closed at 5.37% on Thursday, its highest level since before the 2008 financial crisis. Three weeks ago, a sudden drop in that same yield set off Bitcoin's 25% squeeze, and the squeeze is what finally pulled the 50-day moving average back above the 200-day for the first time since November.
post-image
BTC+0.46%
  • 2
A dip-back spike was triggered in the morning. After that lower wick appeared, I noticed an opportunity to go long, and the price gradually stabilized afterward, which served as a validation of my judgment. After entering, there was no particularly rapid trend; it mainly maintained a staircase-like rise. This pace is actually more reliable than a sharp rally, because every upward move has a key level where positions change hands.

My buy order was completed within the long-entry range. Since then, I have observed no obvious loosening of positions in the market, so I have remained calm while h
post-image
ADA+0.92%
BNB+2.46%
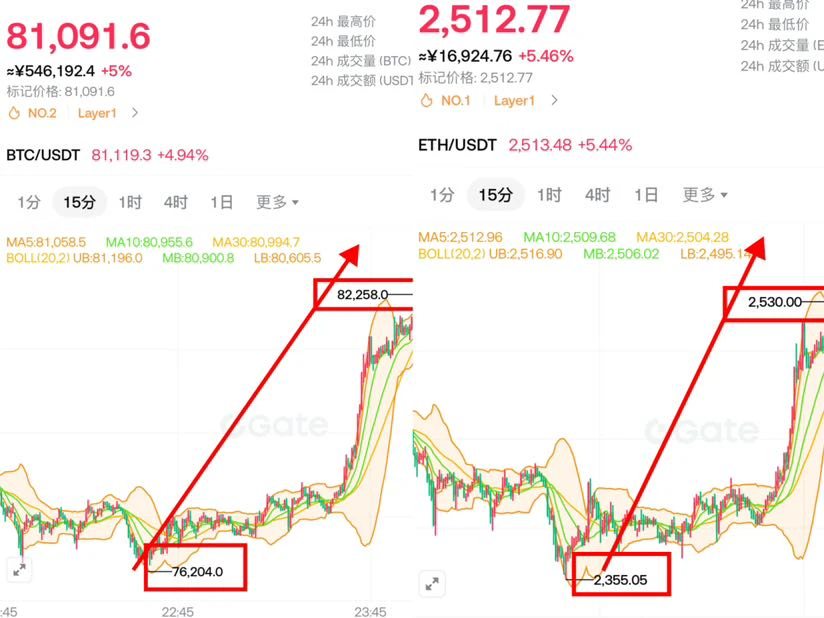
The buzz around the RWA sector from yesterday hasn’t faded yet, but today all eyes are on tonight’s CPI data. BTC is currently fluctuating around $79k, with a major divide between bulls and bears.
🟢 If CPI comes in below expectations: Expectations for an interest-rate cut will rise, and BTC will likely move directly upward to test the $80k mark.
🔴 If CPI comes in above expectations: The dollar index may strengthen, and BTC may need to pull back to test support around $76k.
As a beginner exploring the space at zero cost, my strategy right now is not to invest any money—just check the market o
post-image
RWA+2.59%
BTC+0.46%
USIDX0.00%
Load More

Join 40 M users in our growing community

⚡️ Join 40 M users in the crypto craze discussion

💬 Engage with your favorite top creators

👍 See what interests you

View More