
Square
Following
Hot
News
Profile
Share your thoughts
placeholder
Article
#Altcoins dominance is breaking out
post-image
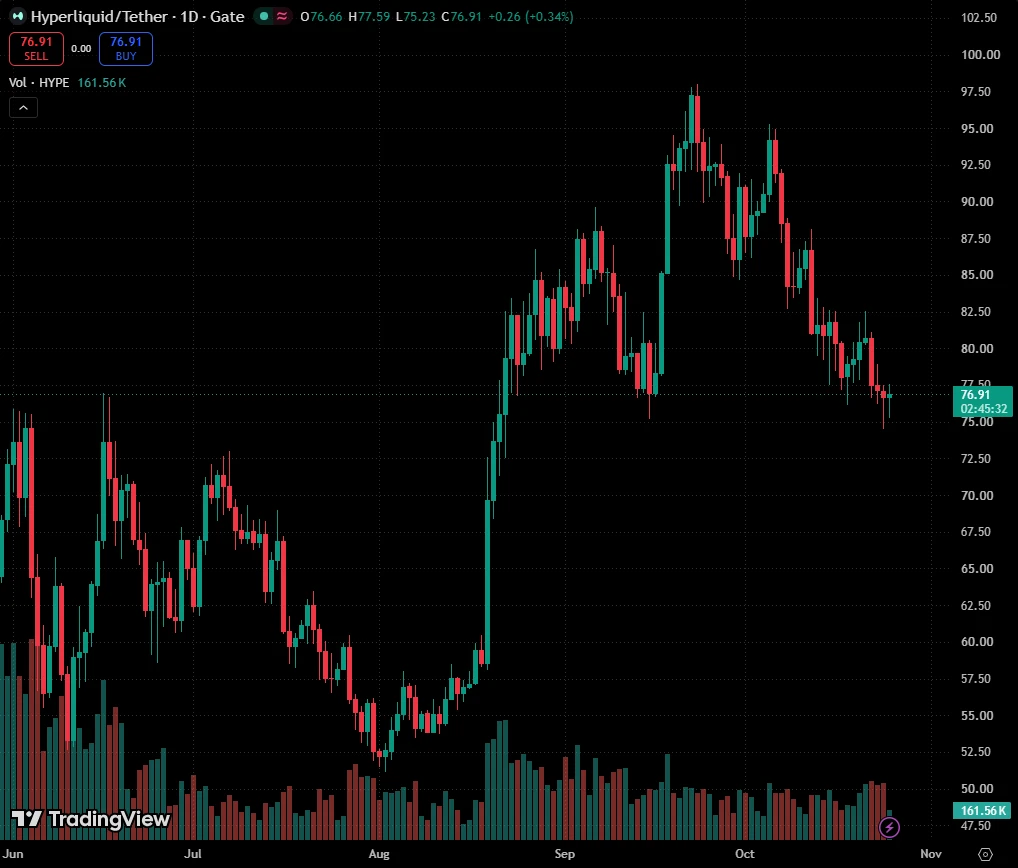
$HYPE buying zone hype?
hype holds strong on the support zone, it could be a buy zone for spot if holds
post-image
HYPE+0.51%
Trenches
STONK
S
bade
b
STONK
6GmA...UNgx
Market Cap
$.
Change
.
24h Vol
$.
Holders
.
BTC
B
bade
b
BTC
C5xp...pump
Market Cap
$.
Change
.
24h Vol
$.
Holders
.
CNPY
C
bade
b
CNPY
0xc6...ddd2
Market Cap
$.
Change
.
24h Vol
$.
Holders
.
LAUNCH
L
bade
b
LAUNCH
AhBi...Qj6C
Market Cap
$.
Change
.
24h Vol
$.
Holders
.
ZIG
Z
bade
b
ZIG
0x8c...1145
Market Cap
$.
Change
.
24h Vol
$.
Holders
.
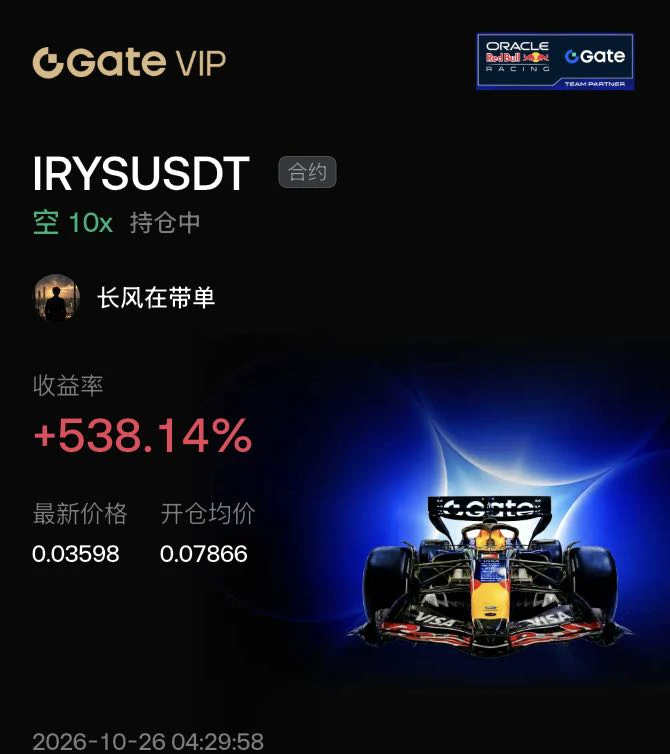
Remember that day when we said “$IRYS was about to explode”?
You hesitated; I took action.
I’d already made a big score on the short that day. Though I reduced my position later, trust me, taking profits is just part of everyday life.
Technical analysis is just a tool; conviction is what matters.
This run with Gate made me believe: those who persevere will ultimately succeed'. $JCT
post-image
IRYS-16.41%
JCT-4.08%
  • 1
A whale/institutional entity holds ETH long positions worth over $270 million that are now on the ve
live-cover
LIVE1,546
#美股财报季
Honestly, strip away the macro narratives and the clichés about “bull-bear transitions,” and the most realistic picture of the market right now is:
For short- and medium-term traders, this is a “bear market,” or what you could call “dead time.”
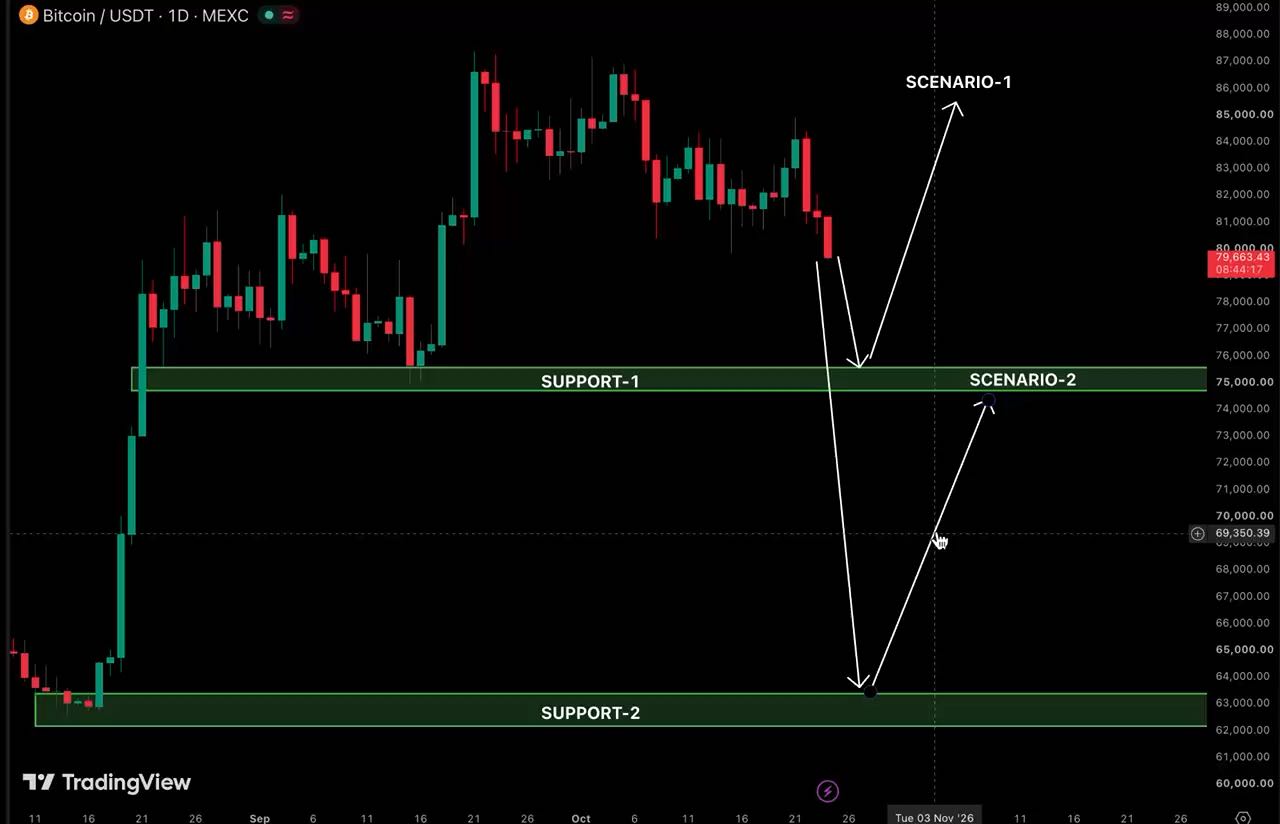
Don’t be fooled by the fact that the larger trend is still up (up 26% over 90 days). The reality is that the current market is extremely grueling. Let me lay out the truth in the chart and the reality of the market:
1. The chart is a textbook “descending channel”
It’s crystal clear in your chart: since the high of 87,374, each rebound has peaked
BTC+0.01%
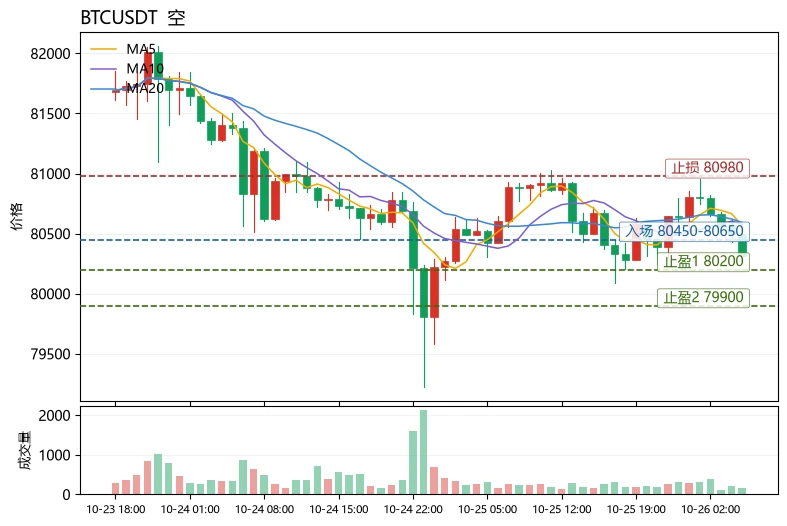
$BTC Short-term bias is bearish; favor shorting bounces. The core rationale is funding: BTC’s funding rate remains positive at +0.0033%, meaning longs are paying to hold positions, while the price has barely moved over 24h (-0.05%). This shows longs are crowded but unable to push the price higher, a typical “longs pay, shorts collect rent” setup. Any pullback could easily trigger a cascade of long stop-losses and liquidations. Technicals point the same way: MA5=80568 has fallen below MA20=80592.5, RSI=41.3 is in the weak zone, and the MACD histogram at -3.343 remains bearish. The price is nea
post-image
BTC+0.01%
AVAX+0.15%
AAVE-0.17%
When gold prices are hitting new highs, I’m actually reducing my position. Don’t rush to argue. The 20-, 50-, and 200-day moving averages are all trending upward, so the short-term trend is still intact. But chasing it at these levels offers a poor risk-reward tradeoff. After doing this for so long, I’ve learned that position sizing always matters more than calling the direction. Save this call and come back tomorrow to see if it holds. If you’re watching, follow #Gold
post-image
GLDX-0.69%
PAXG+0.26%
XAU+0.29%
#WillFedPauseInOctober
Don’t focus only on the word “pause”—the market has already priced in a 92.8% probability. The real variable lies in Powell’s wording on December. October’s PMI surged to a 53-month high, and the prices component posted its fastest increase since August 2022, making a dovish tone increasingly hard to justify. Even with rates held steady, a “hawkish pause” and a purely dovish pause for
post-image
Guys, although 2377 wasn't reached, that's even better news: it means buying pressure is weaker than we thought, and an M top has formed. Enter a short at 2335 to 2340, take profit at 2295. More conservative traders can close half at 2320 and set a stop to breakeven (70~100x leverage recommended), with a stop loss at 2460
post-image
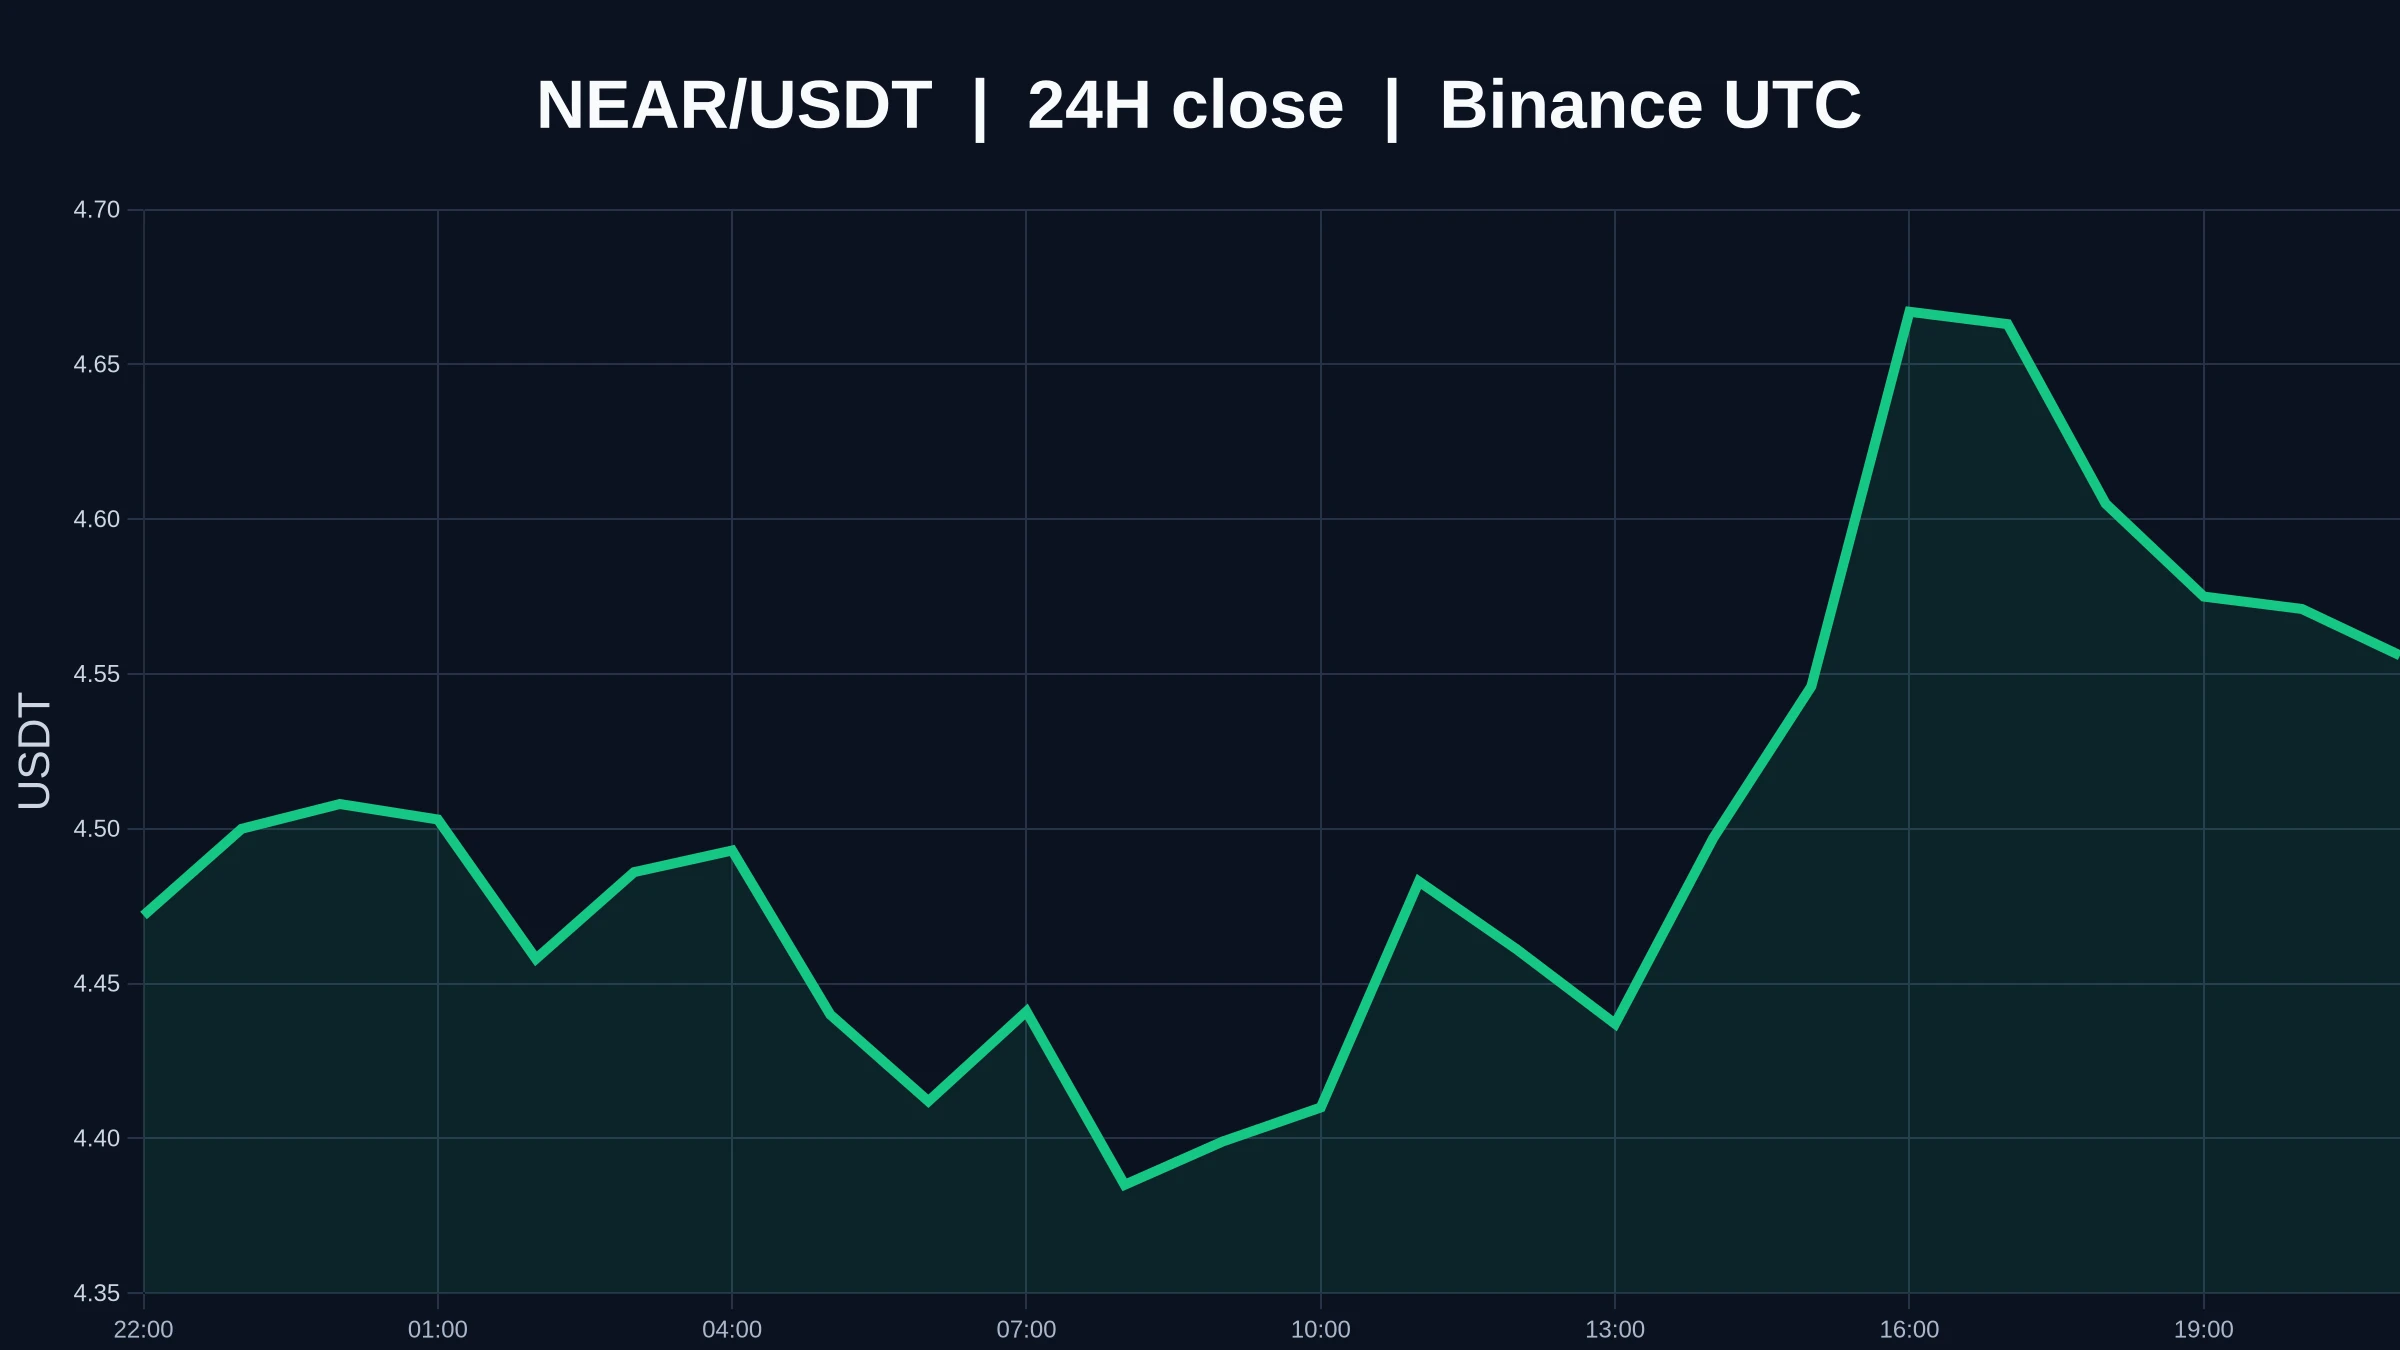
$NEAR Diverges Between Short and Long Timeframes: Which Will Change Direction First?
$NEAR is currently trading at 4.56 USDT, up +2.98% over 24 hours, and fluctuating between 4.351 and 4.699. The 1-hour support is at 4.351, with resistance at 4.699; the 4-hour direction is weak, and trading participation is only 0.10x. In this snapshot, the price has already broken above the 24-hour high, but volume has not increased significantly.
My view is that I’d rather see this as a direction that remains unconfirmed than rush to label it a rebound or a pullback.
Starting with the 1-hour chart, the pric
post-image
Will this ever happen again?
Be honest
post-image
$SNDK Consensus EPS is around $46.2, already above the top of the company’s $44 to $46 guidance range, yet the share price has slid from its 52-week high of $2,354.39 on June 22 to $1,238.03, a pullback of about 47%. Earnings estimates are still being revised upward, but the stock is already being priced as if the cycle has peaked. $MU $WDC
STX SKHY
First, the timing: results are due after the market close on October 29 Eastern Time, with the conference call at 4:30pm EDT, or 4:30am on October 30 Beijing time. AMZN and INTC are also reporting that night.
Let’s break down the numbers.
Fiscal Q
post-image
SNDK-1.90%
MU+2.39%
WDC-2.93%
STX-1.81%
SKHY+4.01%
In the past I've pointed out how most people will not take $BTC seriously until it's back above $100k as this is a psychological number
They will only become bullish at this pivot point
post-image
BTC+0.01%
🚨 Kevin Warsh is walking into one of the most dangerous Federal Open Market Committee (FOMC) meetings in modern history. The FOMC meeting is scheduled for Wednesday, and this time, any stance the Fed takes could trigger a massive market sell-off. Both the Consumer Price Index (CPI) and Producer Price Index (PPI) rose more than expected, and core inflation continues to climb. Meanwhile, the U.S.-Iran war has driven up energy prices, further intensifying inflationary pressures. And that is only half the problem. The U.S. economy is already showing signs of weakness. The housing market is strugg
post-image
BTC+0.01%
CL-1.03%
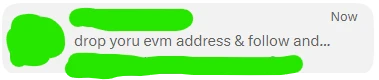
Warning!
I see hundreds of X accounts got hacked and sending this DM to their followers.
Be careful with this kind of DMs!
post-image
$HYPE bears are already celebrating the head and shoulders breakdown
but hold on, we still need proper confirmation
wicking below the neckline and closing back above it could turn this into a nasty bear trap
if the neckline actually breaks, though, the bears might get their payday
no need to marry a bias here
HYPE+0.53%
🤩
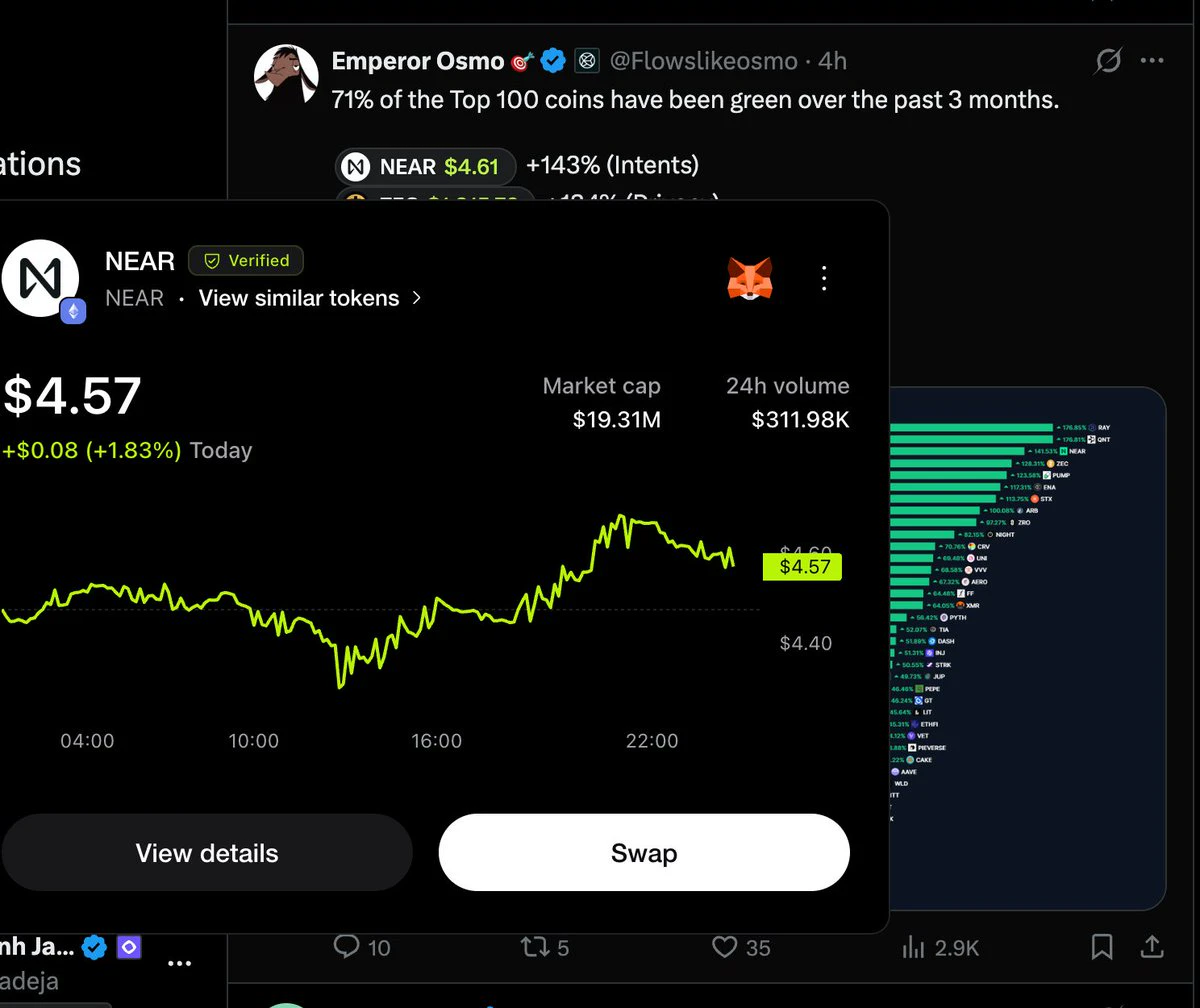
Discovered a new feature in M*****sk, however over a ticker on X and you can swap for it!
post-image
SWAP+2.31%
Market update BTC
live-cover
LIVE459
$BTC Now that the election and midterms are behind us, why hasn’t the price moved? There’s no single explanation. Market depth has clearly thinned recently, with a layer of orders missing from the order books. For example, the cumulative orders across the top few levels on major exchanges are down from a few weeks ago. The same market order for a few dozen BTC might have moved the price by just a few dozen dollars before; now it’s more likely to move it by over a hundred dollars. In this kind of market structure, prices are easiest to push around with small orders, and they’re also most likely
post-image
BTC+0.01%
NAS100+0.42%
  • 2
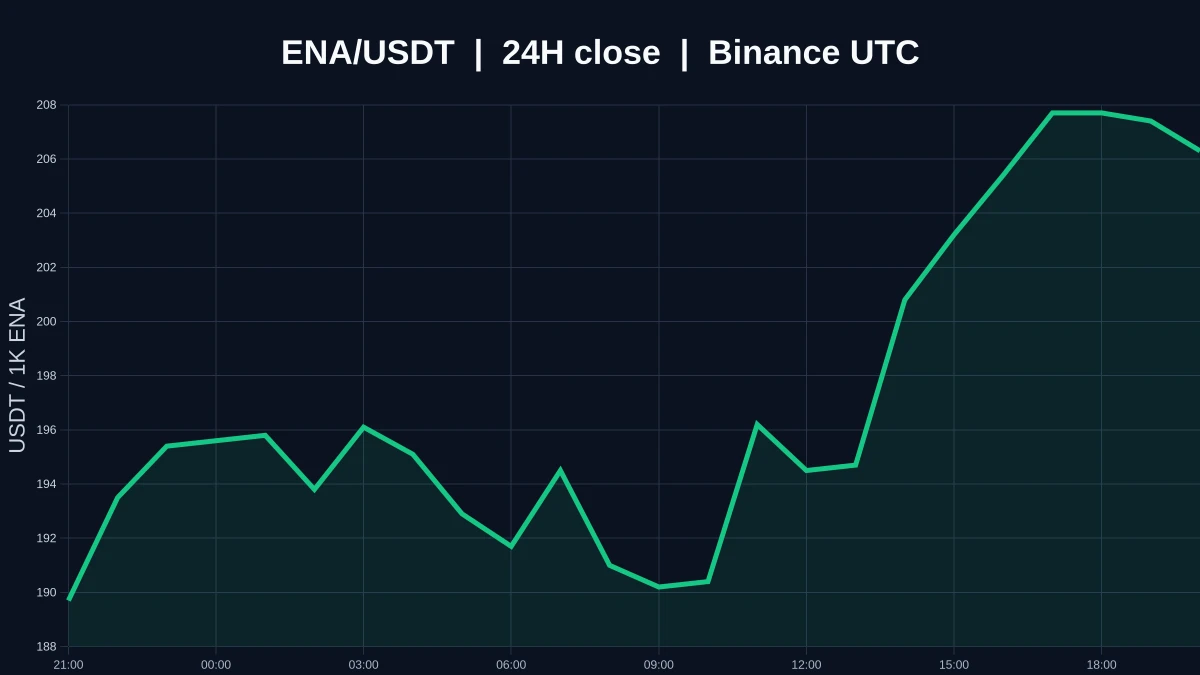
$ENA Current price: 0.2064, up 8.8% over 24H. The 1H trend is strong, with RSI at 74.8; the 4H trend is also relatively strong, with RSI at 49.2. Watch whether the price can hold above the 0.209 resistance and rebound after losing the 0.1887 support. Trading volume is only 0.28x the average, so confirmation is needed. Market volatility is high; for observation only.
post-image
ENA+8.45%
Load More

Join 40 M users in our growing community

⚡️ Join 40 M users in the crypto craze discussion

💬 Engage with your favorite top creators

👍 See what interests you

Trending Topics

USEarningsSeason

105.05k Views3.54k Discussing

The U.S. Q3 earnings season is in full swing, with major tech companies including Tesla and Meta reporting results. Market focus is shifting beyond revenue and profit toward AI spending, capital expenditure, margins and forward guidance. Which company’s earnings are you watching most closely?

GateWCTCS9GlobalTradingCompetition

738.16k Views8.12k Discussing

USConsumerSentimentNearRecordLow

13.15k Views306 Discussing

View More