
Share your thoughts
placeholder
Article
The biggest change this week is that the market has started pricing in rate hikes again.
Previously, the market was pricing in rate cuts, but then came the August nonfarm payrolls report.
August added 162k jobs, far exceeding expectations of 56k, and expectations of a rate hike in September returned to above 60%.
At the same time, the U.S. dollar strengthened again, the Japanese yen also entered the market's focus, and global bond yields generally rose.
This is more worth watching than whether BTC rises or falls.
Because when the market gradually shifts from asking when rate cuts will come to
post-image
BTC+0.35%
$ZEC Signal】Long: 4H momentum continues + 1H momentum remains intact
$ZEC RSI 4H 81.95, 4H MACD histogram expanding, 1H MACD histogram narrowing but remaining positive. Funding rate 0.0091%, OI flat, and short-term fuel is not yet exhausted. Price at 1225.08 is hugging the 4H Bollinger upper band, while the 1H upper band at 1254.90 is also opening upward. Continuous buying emerged in the 1215-1222 range, with the price recovering within an hour after the sharp drop. The order book has relatively thick sell orders but has not formed one-sided suppression.
🎯Direction: Long
⚡Entry/limit order:
post-image
ZEC+15.99%
BTC+0.35%
ETH+1.07%
SOL+2.74%
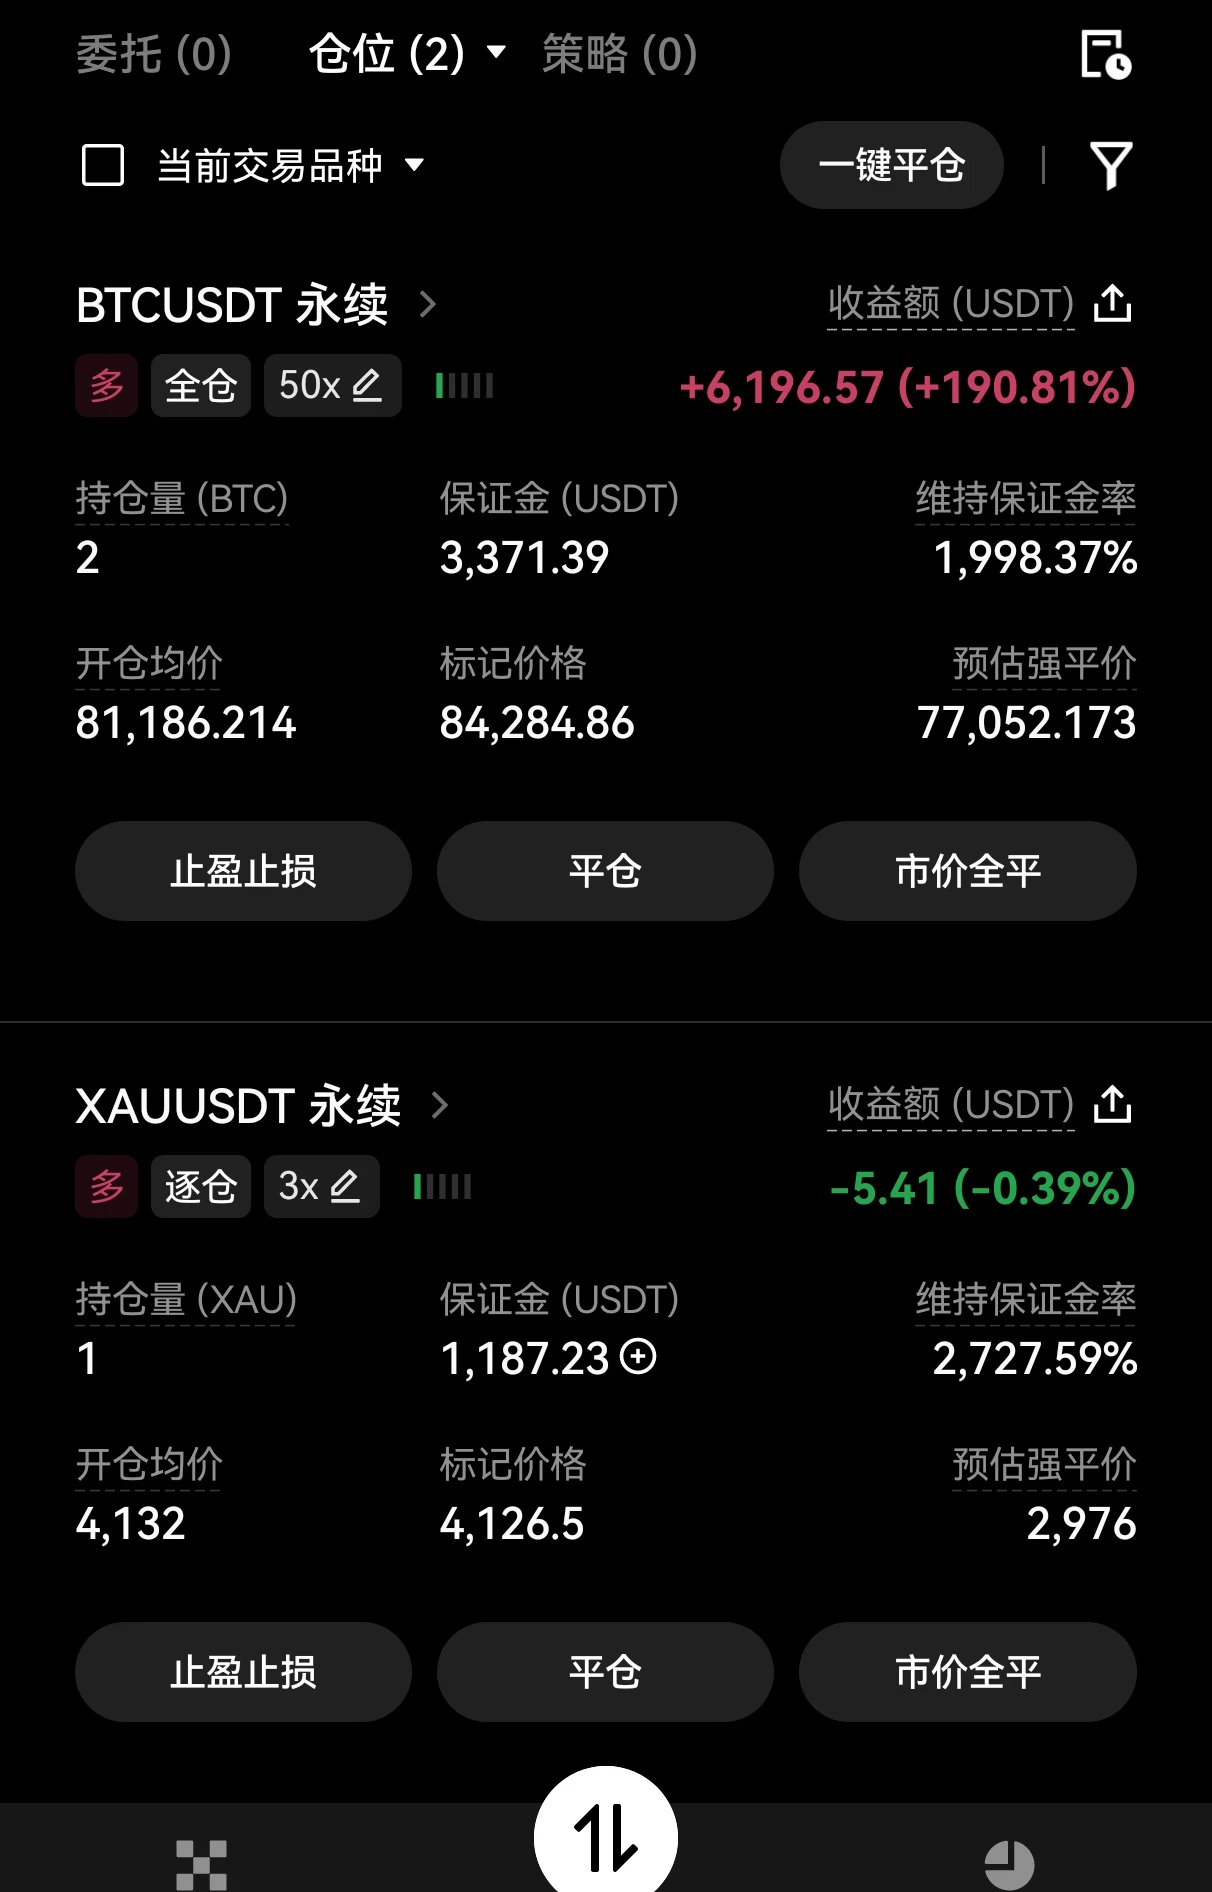
I was quite comfortable holding this BTC long position. The reason for entering was that a strong bullish candle appeared on the hourly chart and directly broke through the upper boundary of the previous consolidation range. I judged at the time that this was not simply a wick spike, but genuine capital entering the market, so I decisively followed up with a long position after the pullback confirmation.

After entering, the market did not put me through much of a grind and basically moved upward along the moving averages. I closed 70% of the position around +594.43%, and left the rest with a
post-image
BTC+0.38%
SOL+2.77%
LAB-5.46%
9.7 BTC analysis.
Good morning, friends. The early bird gets the worm, and the weekend's light long position delivered the good news of 895 points.
BTC's early-morning price pierced the upper band before pulling back. Selling pressure outside the upper band was effective, limiting the breakout. Bulls and bears are locked in a stalemate around 80300. Unable to hold above the upper band, a return to the middle band is the most basic Bollinger Bands move. When this kind of “lightning rod” pattern appears at a high level, combined with resistance from the upper band, the probability of a pullback
post-image
BTC+0.35%
Trader 0x362a shorted 15,785 $ZEC ($18.95M) 3 days ago and is now sitting on a $5.27M loss.
This trader had an excellent track record before, with 26 wins in a row.
ZEC+15.99%
Most people of our generation have been disciplined by the notion of “frugality.”
Our elders came from times of scarcity and taught us to compare prices and live economically. There is nothing wrong with such survival wisdom, but when “looking for a bargain” becomes a habitual way of thinking, it quietly eats away at the breadth of our outlook. Many people spend their entire lives trapped in the mental trap of “looking for a bargain,” habitually chasing low prices, discounts, and special offers, treating “saving money” as the first principle of consumption while overlooking the essence of cons
post-image
My hand trembled slightly as I set the stop-loss a few days ago, only to discover this morning that the filial piety was unnecessary. This $LINK move was simply meant to be mine. The last thing I saw before bed was it pulling back to the key level and holding firmly, with the signs of buyers stepping in at the bottom impossible to miss. At the time, I thought that even if I was wrong, I would only lose a small stop-loss by sticking to the plan. I never expected to get rich overnight, but then it started putting on a show all by itself.

When I opened the chart this morning, the price had alre
post-image
LINK+8.75%
DOGE+0.91%
XRP+0.35%
I originally wanted to cut my losses and offer them to heaven, but before I could, the meat roasted itself. 😂
During the repeated intraday swings, $ACE fell just short every time it pushed higher, and the resistance above was all too obvious. I had just one thought: with this kind of price action, it would be absurd for shorts not to participate. I entered directly at 0.1847 and didn’t expect an immediate result—who knew it would give me an answer in the middle of the night.
Now at 0.1681, up +221.71% from entry, I’ve fully realized the short position’s gains. It feels fantastic. I was still
post-image
ACE-4.23%
XRP+0.35%
BTC+0.38%
JUST IN: White hats reportedly moved 4,000 BTC from Liquid’s sidechain amid a major security breach. ETFs enjoy their best three weeks of inflows in 2026. $BTC $ETH
post-image
BTC+0.35%
ETH+1.07%
Most traders think ARB is dead—that’s exactly why this range is about to break.

$ARB /USDT - SHORT

Trade Plan:
Entry: 0.18821 – 0.19175
SL: 0.20696
TP1: 0.17725
TP2: 0.16876
TP3: 0.15603

Why this setup?
The 4h chart says SHORT with 55% confidence, but the 1D trend is flat—meaning no one’s paying attention. RSI on 15m is 57.6 (not overheated), and ATR is tight at 0.007. That’s a coiled spring. The entry zone (0.188–0.192) sits right under resistance. Why now? Because low volatility after a range always precedes a violent move—and the data points to downside targets at 0.177, then 0.168.
ARB-1.03%
With this move, I don't even need to think—the account is dancing on its own. 💃

While everyone was still watching from the sidelines, it was still pushing higher during the intraday plunge, looking like a bull trap. In reality, order-book support was especially weak; this kind of rally may fool people for a while, but not forever. I opened a short near the highs, using 0.4520 as the reference level, and placed the stop-loss slightly above. If wrong, I’ll accept it.

Just refreshed: price has already been pushed down to 0.2307, and the short is showing +966.19% unrealized profit. Those on b
post-image
ZEC+15.99%
SNDK+1.17%
$US30 BNB SEASON, ALL GAINERS!
$4 I told you a few days ago that since BNB was still cheap, there was a high likelihood of a rally. That’s why I said it could go up. Here’s the result and it will continue.
$BULLA To be honest, it’s the only coin on the BNB side that I don’t like. I’m not a fan of the team behind it, but BULLA will also rise during a broad market rally.
$B It’s actually special because it was the first memecoin to launch and list on the USD1 pair, but I don’t think the reason for its rise is the network’s overall growth I don’t believe it’s one of the network’s leading coins
US30+0.09%
JUST IN: Iran says it will sign an agreement with Oman on Strait of Hormuz shipping in the coming days. If the pact stabilizes regional shipping routes, watch for potential relief in oil and energy-linked markets. $BTC not directly affected.
post-image
BTC+0.35%
BTC returns to $81,000! The market rebounds after finding suppor
live-cover
LIVE576
#BTC. The previous move dipped to a low near 79100, followed by the formation of a 30-minute consolidation center【79600‑80000】;
2. It has just completed an upward move out of the center, surged to 80500, and then formed a minor top fractal; it is now pulling back for confirmation;
3. Current characterization: a rebound following the pullback, not yet evolved into a complete new upward segment, currently in the pullback confirmation stage after leaving the center, with two possible developments:
• Path A (bullish continuation): The pullback does not fall back into the center, forming a 30-minut
post-image
BTC+0.35%
9.7 BTC Analysis
After an impulsive surge on the BTC one-hour chart, the price pierced the upper Bollinger Band, while RSI6 reached around 75 and entered the overbought zone. Although the MACD red bars are expanding, bullish momentum shows signs of exhaustion, indicating a need for a technical pullback. U.S. stock markets are closed today for Labor Day, creating a vacuum in external news. Market movements are being driven entirely by funds in on-platform contracts. Key resistance is around 80400, while strong support is near 79832, along the Bollinger middle band. In the short term, stop losse
post-image
ETH+1.07%
BTC+0.35%
This return has me feeling nervous, afraid the market will come to its senses tomorrow and blacklist me🙈. The last thing I saw before bed a few days ago was that the key level for $LINK was still holding firmly; after several pullbacks failed to break it, I knew the position could safely be held overnight.

I didn't predict much—there were buyers, volume hadn't contracted, and the risk-reward at 11.416 was good enough, so I went long with the trend. The rest was best left to time.

Refreshing the price first thing in the morning, 13.253 had already written the performance report for me: +11
post-image
LINK+8.75%
XRP+0.35%
BTC+0.38%
Everyone’s staring at BULLA’s range—but the 4h tape is screaming a trap most will miss.

$BULLA /USDT - SHORT

Trade Plan:
Entry: 0.074511 – 0.077631
SL: 0.091045
TP1: 0.064841
TP2: 0.057354
TP3: 0.046124

Why this setup?
- RSI 15m is dead neutral at 50.5—no momentum to fake a breakout upward.
- ATR 1h (0.0062) is thin; price is coiling, and the short setup targets a 15-25% drop to TP1/TP2.
- 1D trend is *range*—but confidence 55 leans bearish, meaning the path of least resistance is down toward 0.0648 first.
- Why now? Entry ref 0.076 is right at the range middle—a perfect spot for a
BULLA-8.53%
Load More

Join 40 M users in our growing community

⚡️ Join 40 M users in the crypto craze discussion

💬 Engage with your favorite top creators

👍 See what interests you

View More