Square
Following
Hot
News
Notifications
Profile
Share your thoughts
placeholder
Article
What Is Trading Expectancy? How Can You Tell Whether a Strategy Has an Edge Over the Long Run?

In cryptocurrency trading, some people review their win rate and look for better entry points every day, while overlooking a more fundamental question: If you repeatedly trade according to the same set of rules, how much will you earn or lose per trade on average over the long run?

That is the question trading expectancy aims to answer.

First, what is trading expectancy?

Trading expectancy is the theoretical average return per trade under a given strategy and set of statistical conditions. It ana
Why do you need a 100% gain to break even after a 50% loss?

In cryptocurrency trading, many people see their assets fall by 50% and think that a 50% price rebound will restore their original capital.

But this is a common mathematical misconception.

Losses and the gains needed to break even are not symmetrical. The greater the loss, the higher the return needed to restore the original capital. That is why controlling drawdowns is more important than trying to make up for losses afterward.

First, why doesn’t a 50% gain make up for a 50% loss?

Suppose you initially invest 1,000 USDT.

After
post-image
Trenches
ZIG
Z
bade
b
ZIG
0x8c...1145
Market Cap
$.
Change
.
24h Vol
$.
Holders
.
BTC
B
bade
b
BTC
C5xp...pump
Market Cap
$.
Change
.
24h Vol
$.
Holders
.
GM
G
bade
b
GM
0x13...7777
Market Cap
$.
Change
.
24h Vol
$.
Holders
.
Diamond
D
bade
b
Diamond
5VCE...pump
Market Cap
$.
Change
.
24h Vol
$.
Holders
.
STONK
S
bade
b
STONK
6GmA...UNgx
Market Cap
$.
Change
.
24h Vol
$.
Holders
.
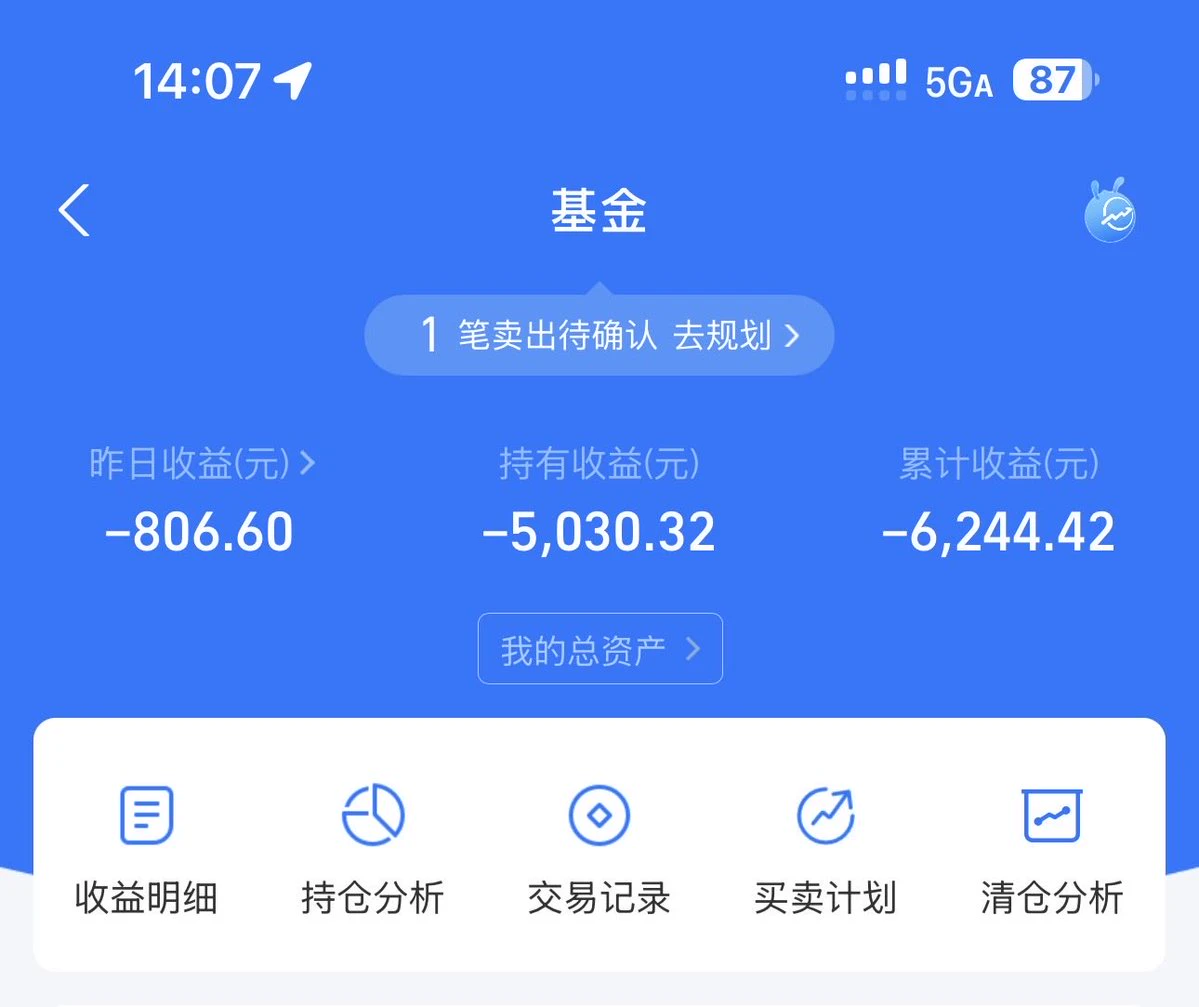
Bought Funds on Alipay, Lost 6200 in 3 Months
post-image
Shorts are trembling, and longs are starting to brag? The battle for BTC at $76,000 is heating up!

BTC's recent price action has been like a tug-of-war with no referee. Just as bulls pulled the price above $76,000, bears began looking for a chance to strike back.
Who will have the last laugh?
I think we can't just look at price—we also need to watch market flows and leverage. The market has seen large-scale liquidations before, showing that highly leveraged traders are under considerable pressure. In this environment, concentrated position closures could cause rapid price swings.
If bulls can
BTC-0.65%
  • 30
BTC | ETH | Gold | Crude Oil
live-cover
LIVE3,979
#USNonfarmPayrolls
US Nonfarm Payrolls (NFP): Stronger Than Expected – What Does It Mean for the Markets?
The US Nonfarm Payrolls (NFP) report remains one of the most important economic indicators for global financial markets. Released monthly by the US Bureau of Labor Statistics (BLS), it measures the number of jobs added or lost across the US economy, excluding agricultural employment.
The latest October 2026 employment report, released on November 6, delivered a stronger-than-expected result, signaling renewed strength in the US labor market.
📊 Key Highlights of October NFP
Nonfarm Payro
XAU+0.38%
"Holy shit Ansem just aped my token"
post-image
TOKEN-0.16%
Being good at painting a rosy picture isn’t enough! When choosing a company, I care more about whether it can actually make money!

Investing in stocks sometimes feels like taking part in a grand speech contest.
Some companies write strategic plans more compelling than novels, with market opportunities seemingly big enough to encompass the entire universe. But here’s the question: Where’s the money? The profits? The cash flow?
I believe a company truly worth paying attention to must be able to turn business plans into actual revenue.
First, its products need to meet market demand; second, the
  • 42
When a strategy starts losing money, the most dangerous thing to do is neither stop immediately nor stubbornly keep going, but repeatedly change parameters without evidence.

Many traders go through this process:

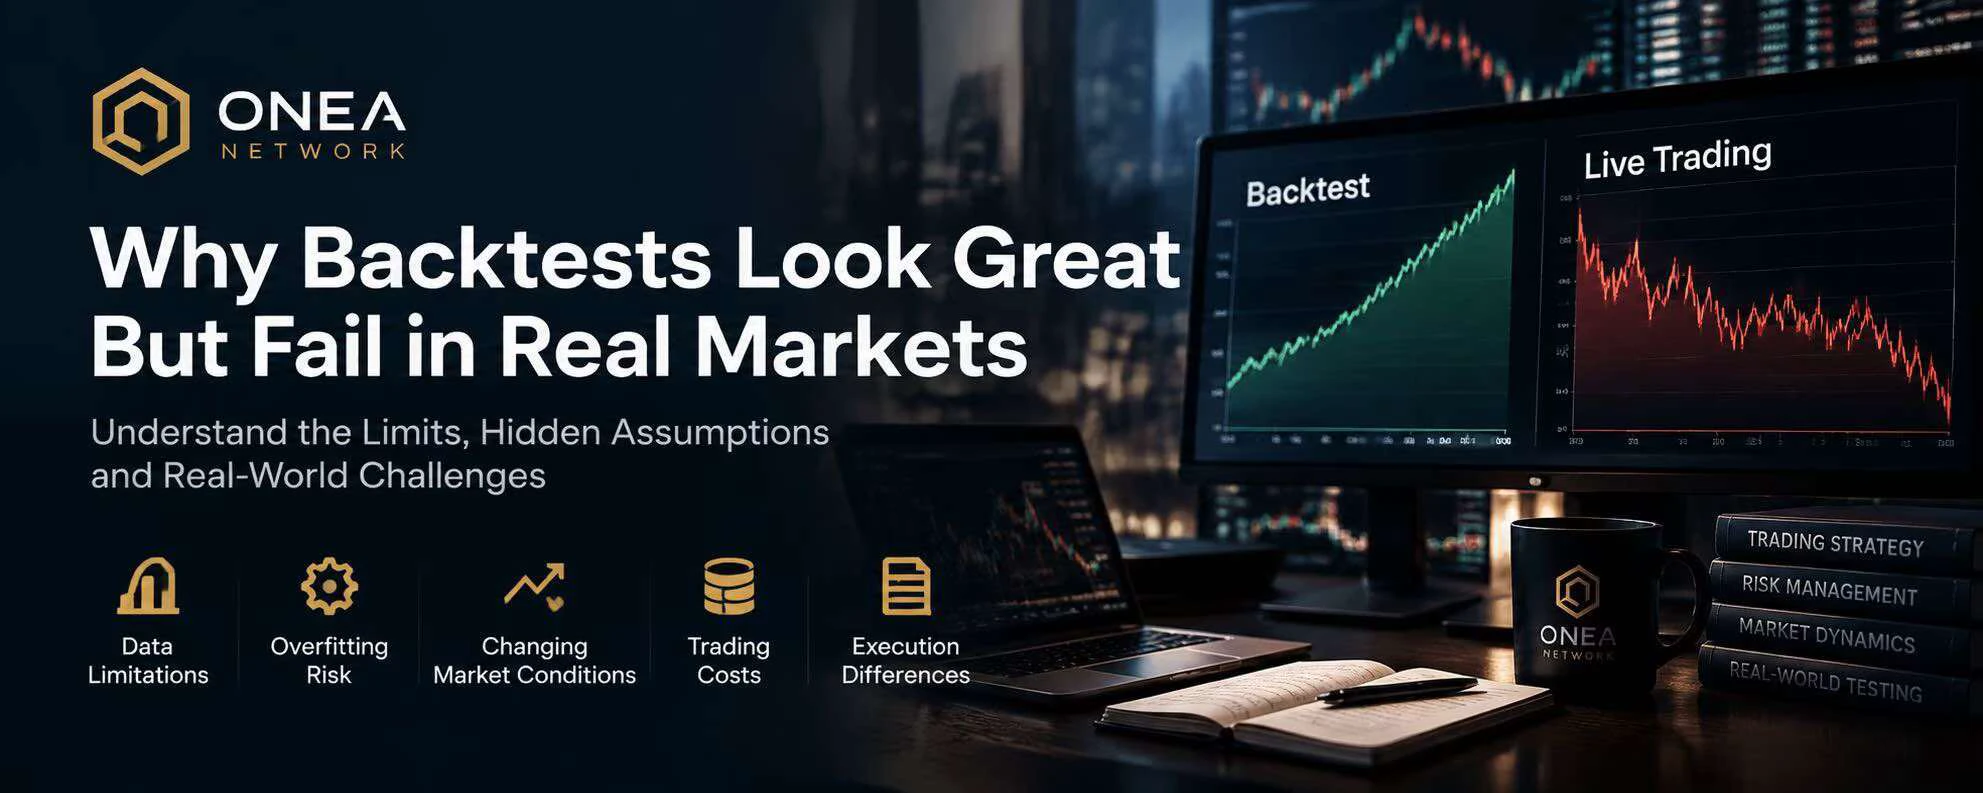
A strategy performs well in backtests and even makes consistent profits in live trading. But after a while, losses start to mount.

At this point, three reactions are common:

First: assume it’s just bad luck and keep trading.

Second: keep adjusting parameters in the hope of restoring the equity curve.

Third: start doubting the entire strategy and even abandon a trading system that
post-image
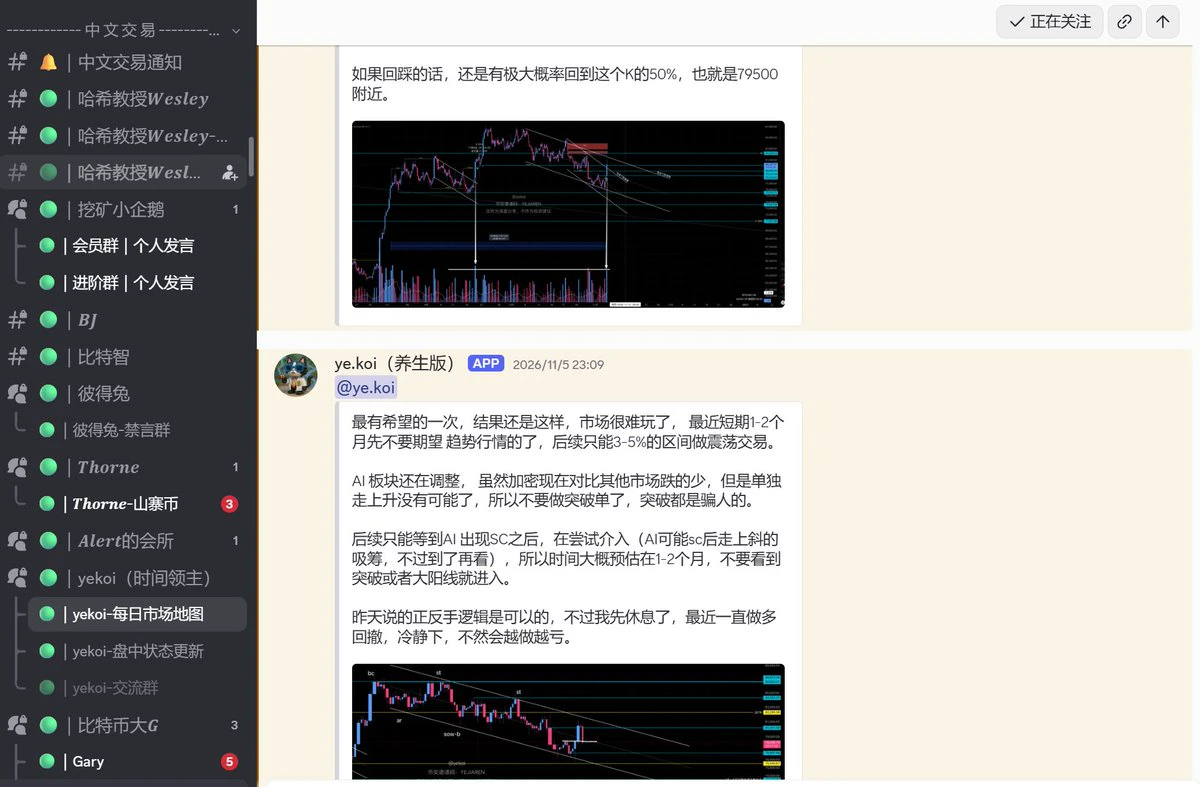
Automated, real-time reposting of group updates from 100+ bloggers, 24/7
Including: Yan Chi, Ao Ying, Bit Wisdom, Peter Rabbit, Crypto Cat, Ye.koi, Professor Wesley, Theophilus, Alert Club, Feng Xun, Below Zero Two, and others
Free trial available | Contact on TG:
post-image
Nasdaq falls into a technical correction! This isn’t an ordinary shakeout—AI investors should wake up!

The Nasdaq plunged 5.52% on Thursday, retreating about 12% from its October high and officially entering correction territory. Hot stocks such as Nvidia and AMD faced heavy selling, and market sentiment quickly shifted from excitement to panic.
In my view, this downturn involves at least three factors: First, AI trades had become overly crowded, leading profit-takers to cash out en masse; second, the market is concerned that data center construction may face policy and financing pressures; t
AMD+11.55%
  • 19
#USStocksFaceHistoricSelloff #ShareWeekly
My Take on the Historic US Stocks Selloff: Why AMD and AI Chips Got Hit Hard, What’s Really Going On, and Where I See Opportunity Next

On Thursday, November 5, 2026, the American stock market delivered
one of its sharpest single-day declines in recent memory. The Nasdaq Composite plunged 5.52% to close at 24,315, its biggest daily drop in 19 months and enough to push the index into formal correction territory (more than 10% below its October 6 record high).

The S&P 500 fell roughly 4.36%, the Dow dropped about 3.44%, and roughly $2.5–3 trillion in
ARIA | Long 🟢 | Bullish | 15-minute 24-hour: +12.83% | Volume: 35.5M USDT. Long rationale: Price above EMA200; EMA20/50/200 in bullish alignment; RSI14 at 67.8; MACD histogram positive; ADX14 at 21.8; volume is 1.44 times the 20-candle average; breakout from the 20-candle range. Entry: 0.15503 Stop-loss: 0.143574 Take-profit 1: 0.16935 | Take-profit 2: 0.177942 | Take-profit 3: 0.189399Entry price is for reference only; do not chase. The strategy is invalidated if the stop-loss level is hit. Technical analysis strategy only; not investment advice. $ARIA
post-image
ARIA+22.03%
#Analytics

#PUMP Price remains in a weak position

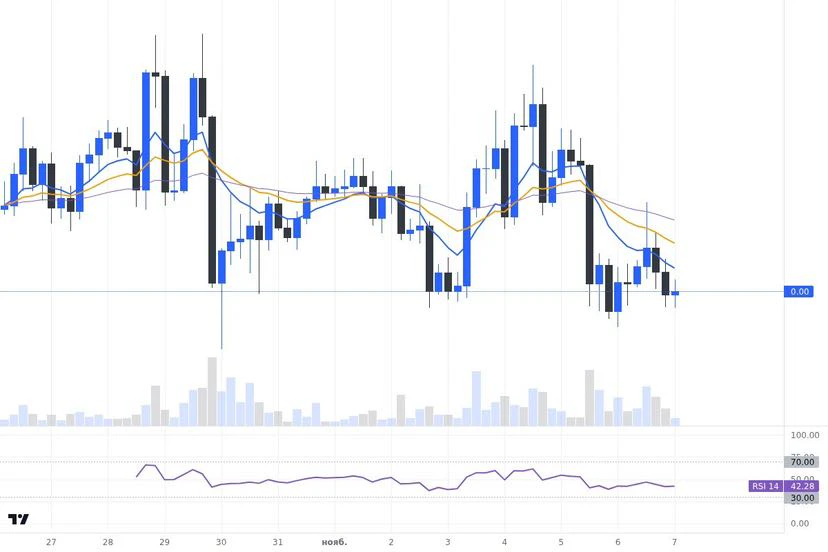
PUMP’s current outlook is negative: on the four-hour chart, the price of $0.003922 is below the EMA 20 ($0.00405711) and EMA 50 ($0.00414857), with the short-term average below the long-term one. RSI 14 on the same chart is 37.9: momentum is also tilted to the downside.

At the same time, the volume of the latest closed four-hour candle is below the average volume of the previous twenty candles. This is an important detail: price weakness is not accompanied by elevated trading volume. There is no basis for calling the current situation a stro
post-image
PUMP-1.06%
A high win rate does not equal high profitability. What truly determines trading results is the ratio between each gain and loss.

Many trading strategies look excellent: an 80% win rate, multiple consecutive wins, and a very attractive backtest curve.

But if each win earns just $10 while a single loss costs $50, a problem emerges.

Suppose you make 100 trades:
• 80 wins, earning $10 each, for a total gain of $800.
• 20 losses, losing $50 each, for a total loss of $1,000.

Final result: a loss of $200, before fees, funding rates, and slippage.

This shows that win rate is only one part of a t
post-image
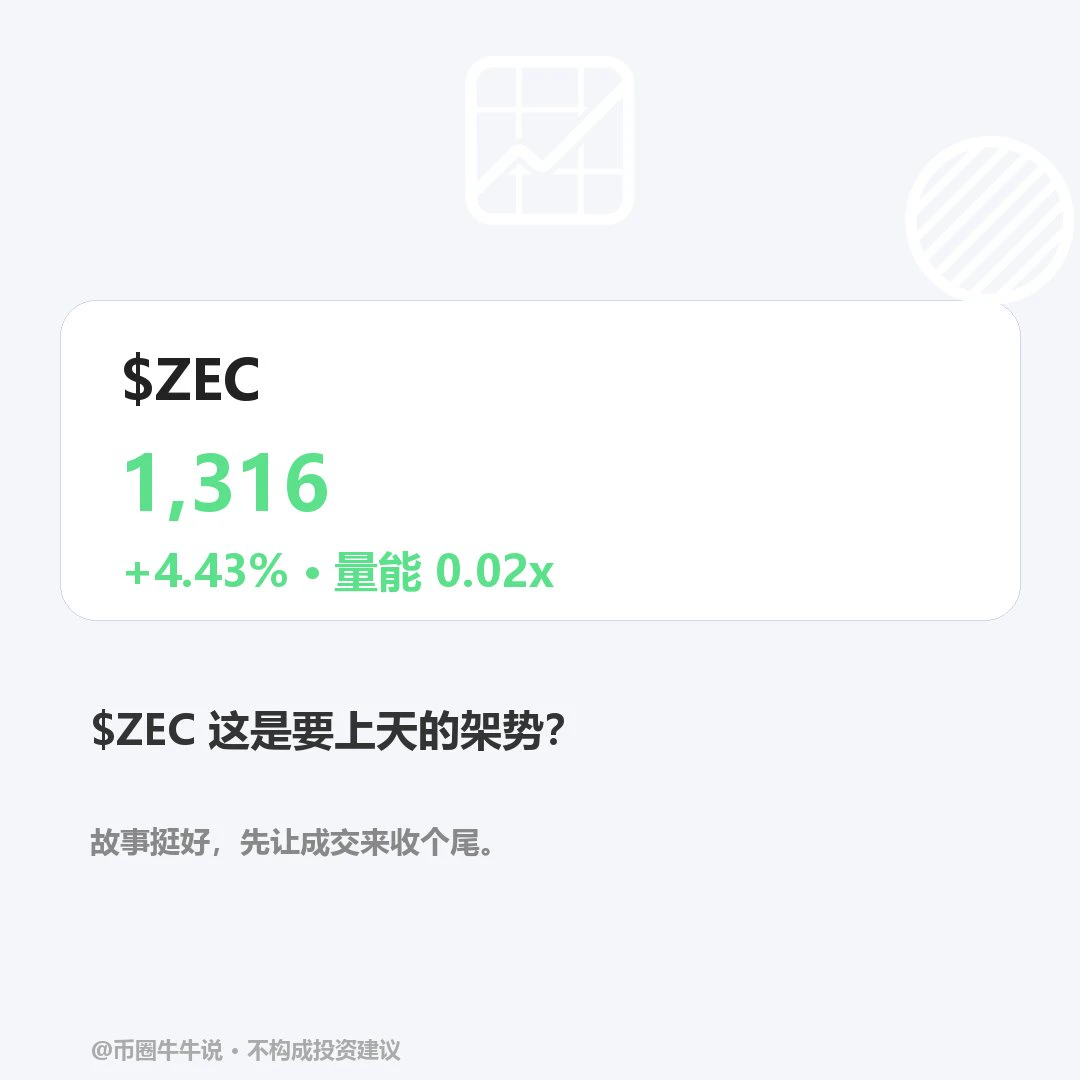
$ZEC Current price: 1315.89, 24H +4.43%, range 1247.89–1387.89, trading volume 88.1641 million. The 1H trend is weak (RSI 30.35, price below EMA20 at 1323.59); the 4H trend is strong (RSI 53.13, price above EMA20 at 1291.67). The volume ratio is 0.015. Holding above the 1387.89 resistance could signal continuation, while a break below the 1247.89 support would weaken the short-term outlook. On review, confirm that 1387.89 holds and that price reclaims 1247.89; volume is only 0.015x, so a single move across either level requires confirmation of participation. Failure to reclaim the level invali
post-image
ZEC+1.16%
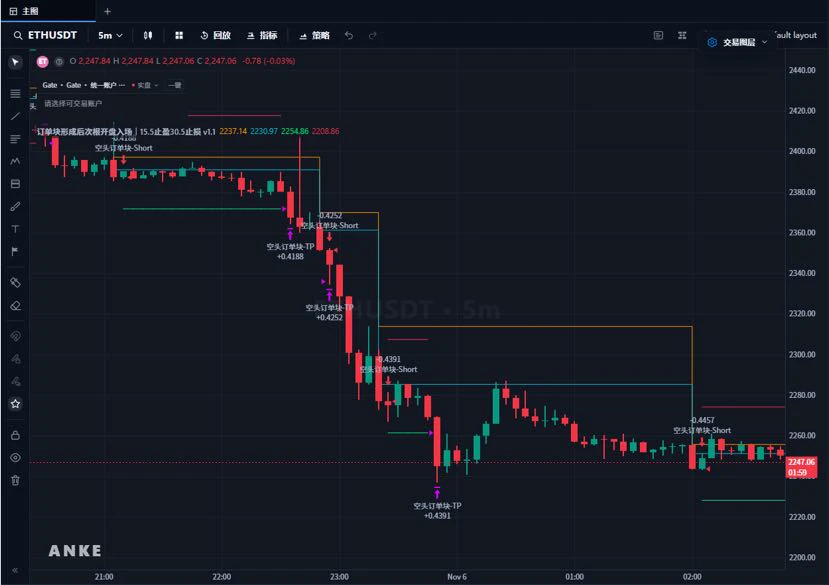
📊 ANKE AI — An AI-assisted charting platform for traders

Trading shouldn’t require spending a lot of time writing indicators and debugging code.

ANKE AI aims to lower the barrier to developing indicators and strategies, allowing traders to describe their trading ideas in natural language and use AI to generate indicators and standalone strategy code.

From trading charts to strategy development, bringing technical tools closer to traders’ real-world needs.

Make it easier to turn ideas into strategies and simplify strategy development.
post-image
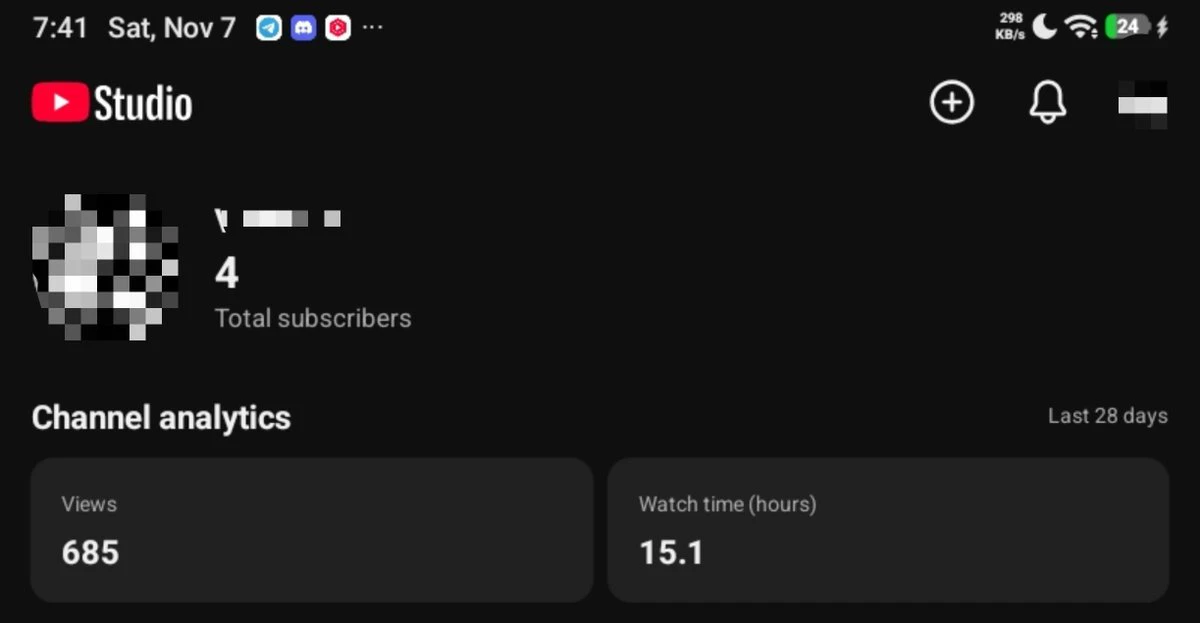
After leaving YT automation for months
I'm back at it and building again
Nigeria was my biggest turn off on this
Majorly, network
Many times I have been trying to stay consistent but you see this network issues?
It comes like plague and it annoys the hell out of me
But here we are anyways
I can't let a bad economy dictate how I build or live
Cheers to growth and getting monetised in few days or weeks
post-image
#WCTCS9 #$XAU
Gold at $4,100: Why Reclaiming It Matters More Than Hitting It

Gold is sitting just below a level that matters. XAUT, the gold-backed token I'm using as a spot proxy on Gate, last traded around $4,060.60 on the live snapshot, with a 24-hour range of $4,045.40 to $4,124.90. The latest completed daily candle closed at $4,073.30, up about 0.56% on the day and roughly 1.65% over seven days. The live 24-hour figure is slightly negative (about -0.54%), so the two readings disagree depending on the window. That gap is itself a signal: the market is undecided and buyers have not yet pu
XAUT+0.30%
(NEW STREAMER) BTC PREDICTION
live-cover
LIVE44
Load More

Join 40 M users in our growing community

⚡️ Join 40 M users in the crypto craze discussion

💬 Engage with your favorite top creators

👍 See what interests you

Trending Topics

USAIStocksHitHard

15.28k Views3.64k Discussing

U.S. stocks sold off sharply on Thursday, November 5 (UTC). The Nasdaq closed down around 5.5%, entering correction territory, while the Philadelphia Semiconductor Index plunged roughly 12%, with chip stocks including $NVDA and $AMD posting steep losses. Beyond profit-taking, investors are growing concerned about the pace of AI data center construction, capital spending, and future returns on investment. The key question now is whether the AI sector’s lofty growth expectations need to be repriced. Where do you think the next opportunities will emerge: chip stocks, tech giants, or other sectors?

USNonfarmPayrolls

22.89k Views4.25k Discussing

StakeOnLaunchpoolToShare450KVLX

2.02k Views773 Discussing

View More