
Square
Following
Hot
News
Profile
Share your thoughts
placeholder
Article
The Gate Learn to Earn incentive campaign is now live. Keep learning and keep earning. Join now and unlock a new learn-while-you-earn experience. https://www.gate.com/competition/learn-to-earn/18?ref=VQBFVLXBAQ&ref_type=173&ch=8641&utm_cmp=8641
Crypto and #Alts are looking VERY bullish for the next few days
Beautiful rejection on $USDT.D!
Don’t sell your alts for just a few % gains. We’re aiming for 100%+ moves, just like we did last month
If you’re ready, LIKE & RETWEET
post-image
[New Streamer]whales Moves in Sync!
live-cover
LIVE2,034
Retail investor: Oil’s back over $100 & they’re hitting tankers in Hormuz again. I’m thinking about going to cash till it calms down
Me: When does it calm down?
Retail investor: idk... when the war’s over?
Me: Brent oil hit around $118 back in March when the strait shut down. Everybody was saying exactly what you’re saying...
Retail investor: & what happened?
Me: Nasdaq made a new all time high a few weeks later and now up over 30% from that point.
Retail investor: with all this still going on??
Me: Yep. The market doesn’t wait for the all clear. It moves as soon as it figures out earnings are
post-image
BZ-0.32%
NDAQ+1.41%
The Fear & Greed Index is only 53, yet $ZEC has already risen above the Bollinger upper band at 1218.45, with the current price at 1229.64—this is the most unusual detail in today’s market: sentiment is merely neutral, but the price has reached the top of the channel, indicating that bulls actively bought it up rather than being driven by sentiment.
To determine whether the trend is healthy using moving averages, look at two things: alignment and slope. MA5=1194.01 is above MA20=1129.5, and the two lines are diverging upward, forming a standard bullish alignment; the MACD histogram is +18.93,
post-image
ZEC+7.43%
OSMO+17.42%
ZAMA+10.41%
Bruh over 100+ degens showed up & turned up in Phuket tonight 🌴✈️🇹🇭🌎
Appreciate all the homies flying in sponsors supporting & the hosts for a smooth night 👌
We just getting started 😈
post-image
Buy $SKHY
now! 📈Entry range: 142.46 - 143.49First target: 149.73Second target: 155.13Stop-loss: 138.19The price has reclaimed MA7 and MA25 on the 15-minute chart. After holding the 135.82 support level, the short-term trend has turned bullish. RSI(12) is 61.83, and momentum is strengthening. This pattern favors short-term trading, with the target at the 146.50 resistance level. Click here to trade 👇👇👇Quick market overview: $SOL : Current price 105.99 - 24-hour change: +1.17%$ZEREBRO : Current price 0.053009 - 24-hour change: +38.60%
post-image
ZEREBRO+16.23%
$PI Unless I provide hard evidence, the folks in the square really won’t believe me. Does trust between people really have to be proven with screenshots? Normally, 24 people click, but I don’t notify them in the middle of the night. Let those haters see—I wasn’t bragging, was I? This is just my alt account; I have a main account too.
post-image
PI+0.34%
Open a long position here $W . 🚀Entry: 0.014565 - 0.014679Take profit 1: 0.015308Take profit 2: 0.015857Stop loss: 0.014128 W shows signs of a short-term reversal on the 15-minute chart. After rebounding from the low of 0.013949, the price has moved back above MA7 and MA25. RSI(12) is 53.84, and the price is currently testing MA99, so it is highly likely to retest the 0.015200 liquidity zone. Click here to trade 👇👇👇Hot tokens: $ZEREBRO : Current price 0.051489 - 24-hour change: +33.32%$ZEC : Current price 1,230.23 - 24-hour change: +6.33%.
post-image
ZEREBRO+16.23%
ZEC+7.43%
✨ US equity futures traded mixed on October 15 as technology and AI-related stocks faced renewed pressure.
🔹 Futures tied to the tech-heavy Nasdaq 100 fell about 1.2%, while S&P 500 futures slipped 0.3%. Dow Jones Industrial Average futures held relatively firm, trading slightly positive. The divergence reflects a selective risk rotation rather than a uniform selloff.
📊 The data behind the market's sharp reaction:
🔹 Inflation pressures are broadening
▪️ US September PPI rose 1.3% month-over-month and 6.3% year-over-year, far exceeding the 5.3% forecast and marking the largest annual increas
NAS100-0.33%
SPX500+0.24%
US30+1.16%
GAS-5.53%
MU+0.22%
  • 1
Ok what the hell one more time!
LFG!!!!
Which step in this $INJ rally is the easiest to get fooled by?
When I looked at $INJ again, I first covered up the 24-hour +8.79%. It’s not that this number is unimportant, but it is too easy to let it steal your attention. What really needs explaining right now is that $INJ remains strong, while crowding has also been put plainly on the table. I admit the trend is strong, but what needs watching next is not how much higher it can surge, but whether anyone steps in on the first pullback.
The most convenient—and easiest to get wrong—reading is to mistake hype for support during a rise. Real su
post-image
INJ+8.42%
Bottom-fishing: As the night session begins, the market enters the countdown
Stage One: Studying technical analysis.
Watching candlestick charts, moving averages, and MACD every day, while studying all kinds of trading strategies and indicators. The more I learned, the more excited I became, always feeling that I understood a little more than others and was a little closer to making money.
Stage Two: Becoming obsessed with tools.
I started switching software, buying data, and adding indicators, practically wanting to cover the entire screen. I now also use TradingVane to view charts and browse
post-image
BTC+0.90%
The market volatility brought by $NEAR is much greater than I expected when I entered. I don't want to take any more risks. Closing my position here. Monitoring $SKHYNIX and $ZEREBRO simultaneously.
post-image
NEAR+11.70%
SKHYNIX-5.83%
ZEREBRO+16.23%
$ACU is showing promising bullish momentum on the 15minute chart.
After consolidating around $ACUpricebroke out with strong upward movement and reached a local high near $0.1030.
$ACUis now trading around $0.1000,withthe $0.1011levelremaining important to watch.
Holding above the $0.0970 $0.0975supportzone could help maintain the current recovery structure while a strong move above resistance may bring another test of the recent high.
Watching volume and price action closely as the next move develops.
Patience and confirmation matter more than chasing the pump.#ACU #USSeptemberPPIBeatsExpecta
post-image
ACU+3.24%
  • 2
  • 1
they're longing Celestia?
post-image
TIA+6.96%
Which #Coin are you Holding?
1. Hold #DROVER
2. Hold $CKOM
3. Hold #HYDRACHAIN
4. Hold $WIF
5. Hold $PAWS
6. Hold $PI
7. Hold $SOL
8. Hold $CORE
9. Hold #PEPE
What did I miss? 👇
post-image
WIF+0.59%
PI+0.34%
SOL+1.79%
CORE+2.95%
PEPE+2.03%
"Silent moves, billionaire dreams. 🖤
post-image
💵📉 THE U.S. DOLLAR TAKES A ROLLER-COASTER RIDE!
All post-CPI gains have been wiped out! Why is the market no longer buying the stronger-inflation, stronger-dollar narrative?
🔥 In Today's Livestream:
🔹 Why did the U.S. dollar initially rise after the CPI report?
🔹 What could explain the reversal in dollar strength?
🔹 How are Federal Reserve rate expectations shaping market sentiment?
🔹 What could changing dollar momentum mean for gold and Bitcoin?
🔹 Which economic signals should traders watch next?
📊 Is the dollar's reversal a temporary move or a sign that market expectations are shift
post-image
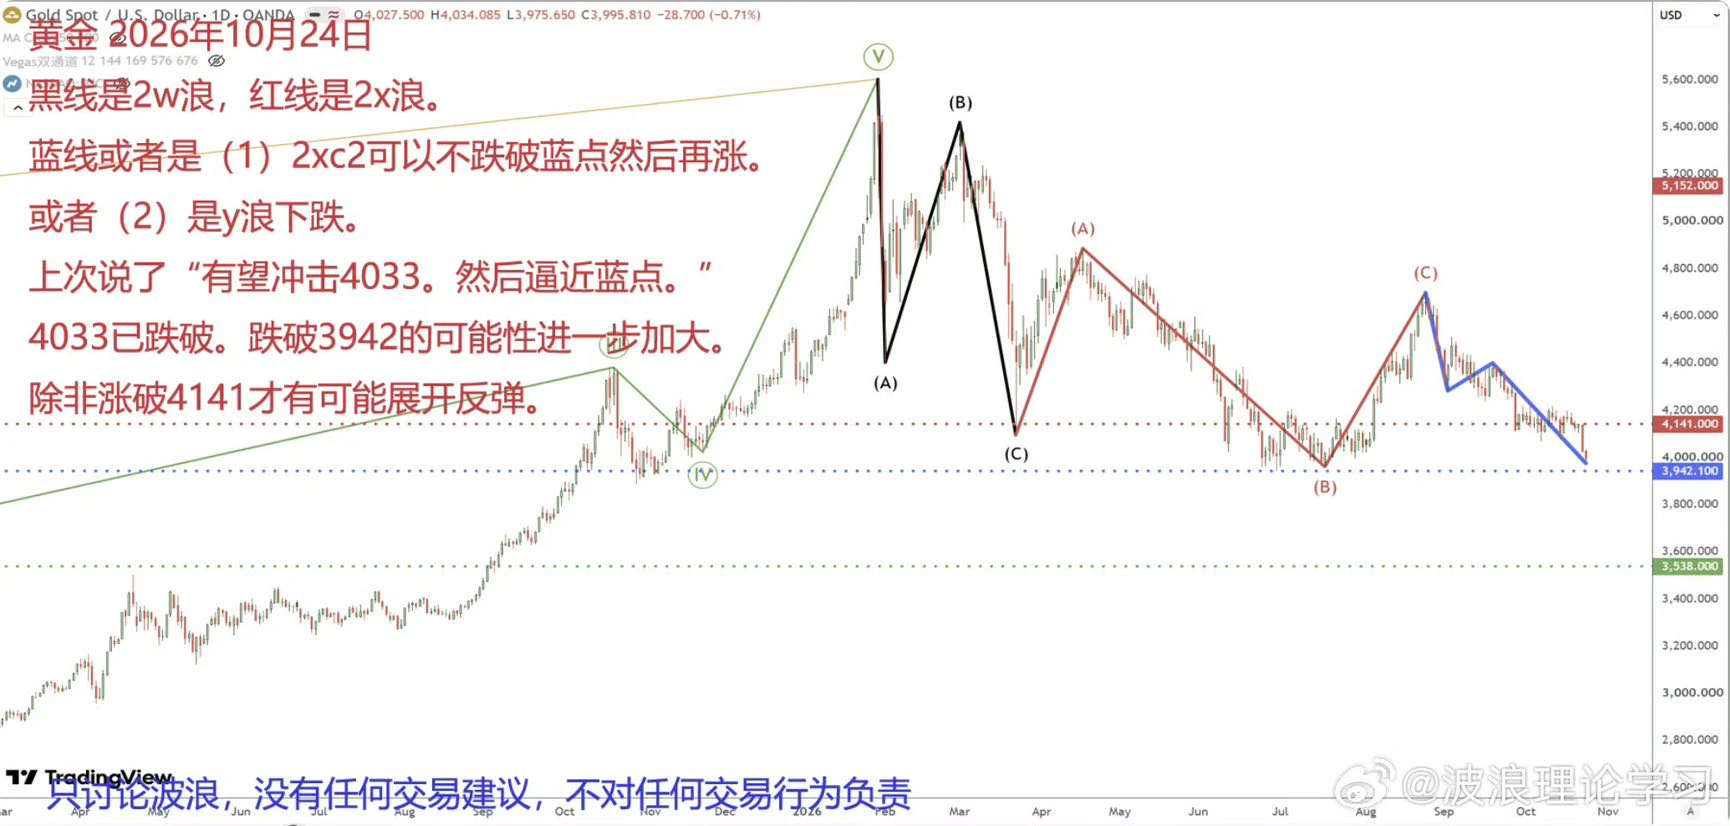
XAU+1.50%
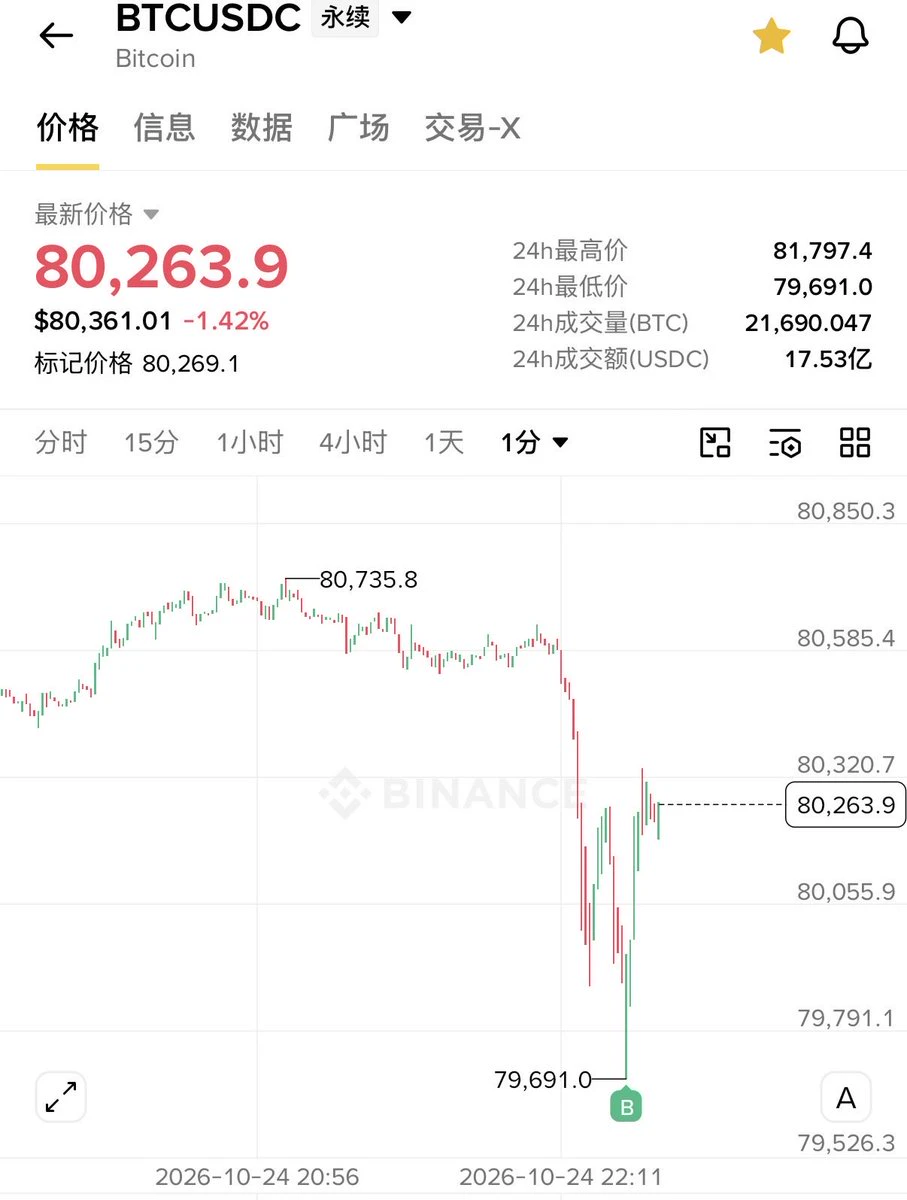
BTC+0.90%
  • 2
Load More

Join 40 M users in our growing community

⚡️ Join 40 M users in the crypto craze discussion

💬 Engage with your favorite top creators

👍 See what interests you

Trending Topics

USSeptemberPPIBeatsExpectations

91.35k Views1.86k Discussing

US September PPI came in at 6.3% YoY, well above the 5.3% market expectation, pointing to renewed producer-side inflation pressure. Weekly jobless claims were 199K, broadly in line with forecasts. Could hotter inflation further reduce room for rate cuts, and what does it mean for $BTC, US stocks, and gold?

DrLinHanSpeaksAtOxfordUnion

135.63k Views1.86k Discussing

JapanAndKoreaStocksPlunge

47.27k Views1.76k Discussing

View More