






Square
Following
Hot
News
Notifications
Profile
Share your thoughts
placeholder
Article
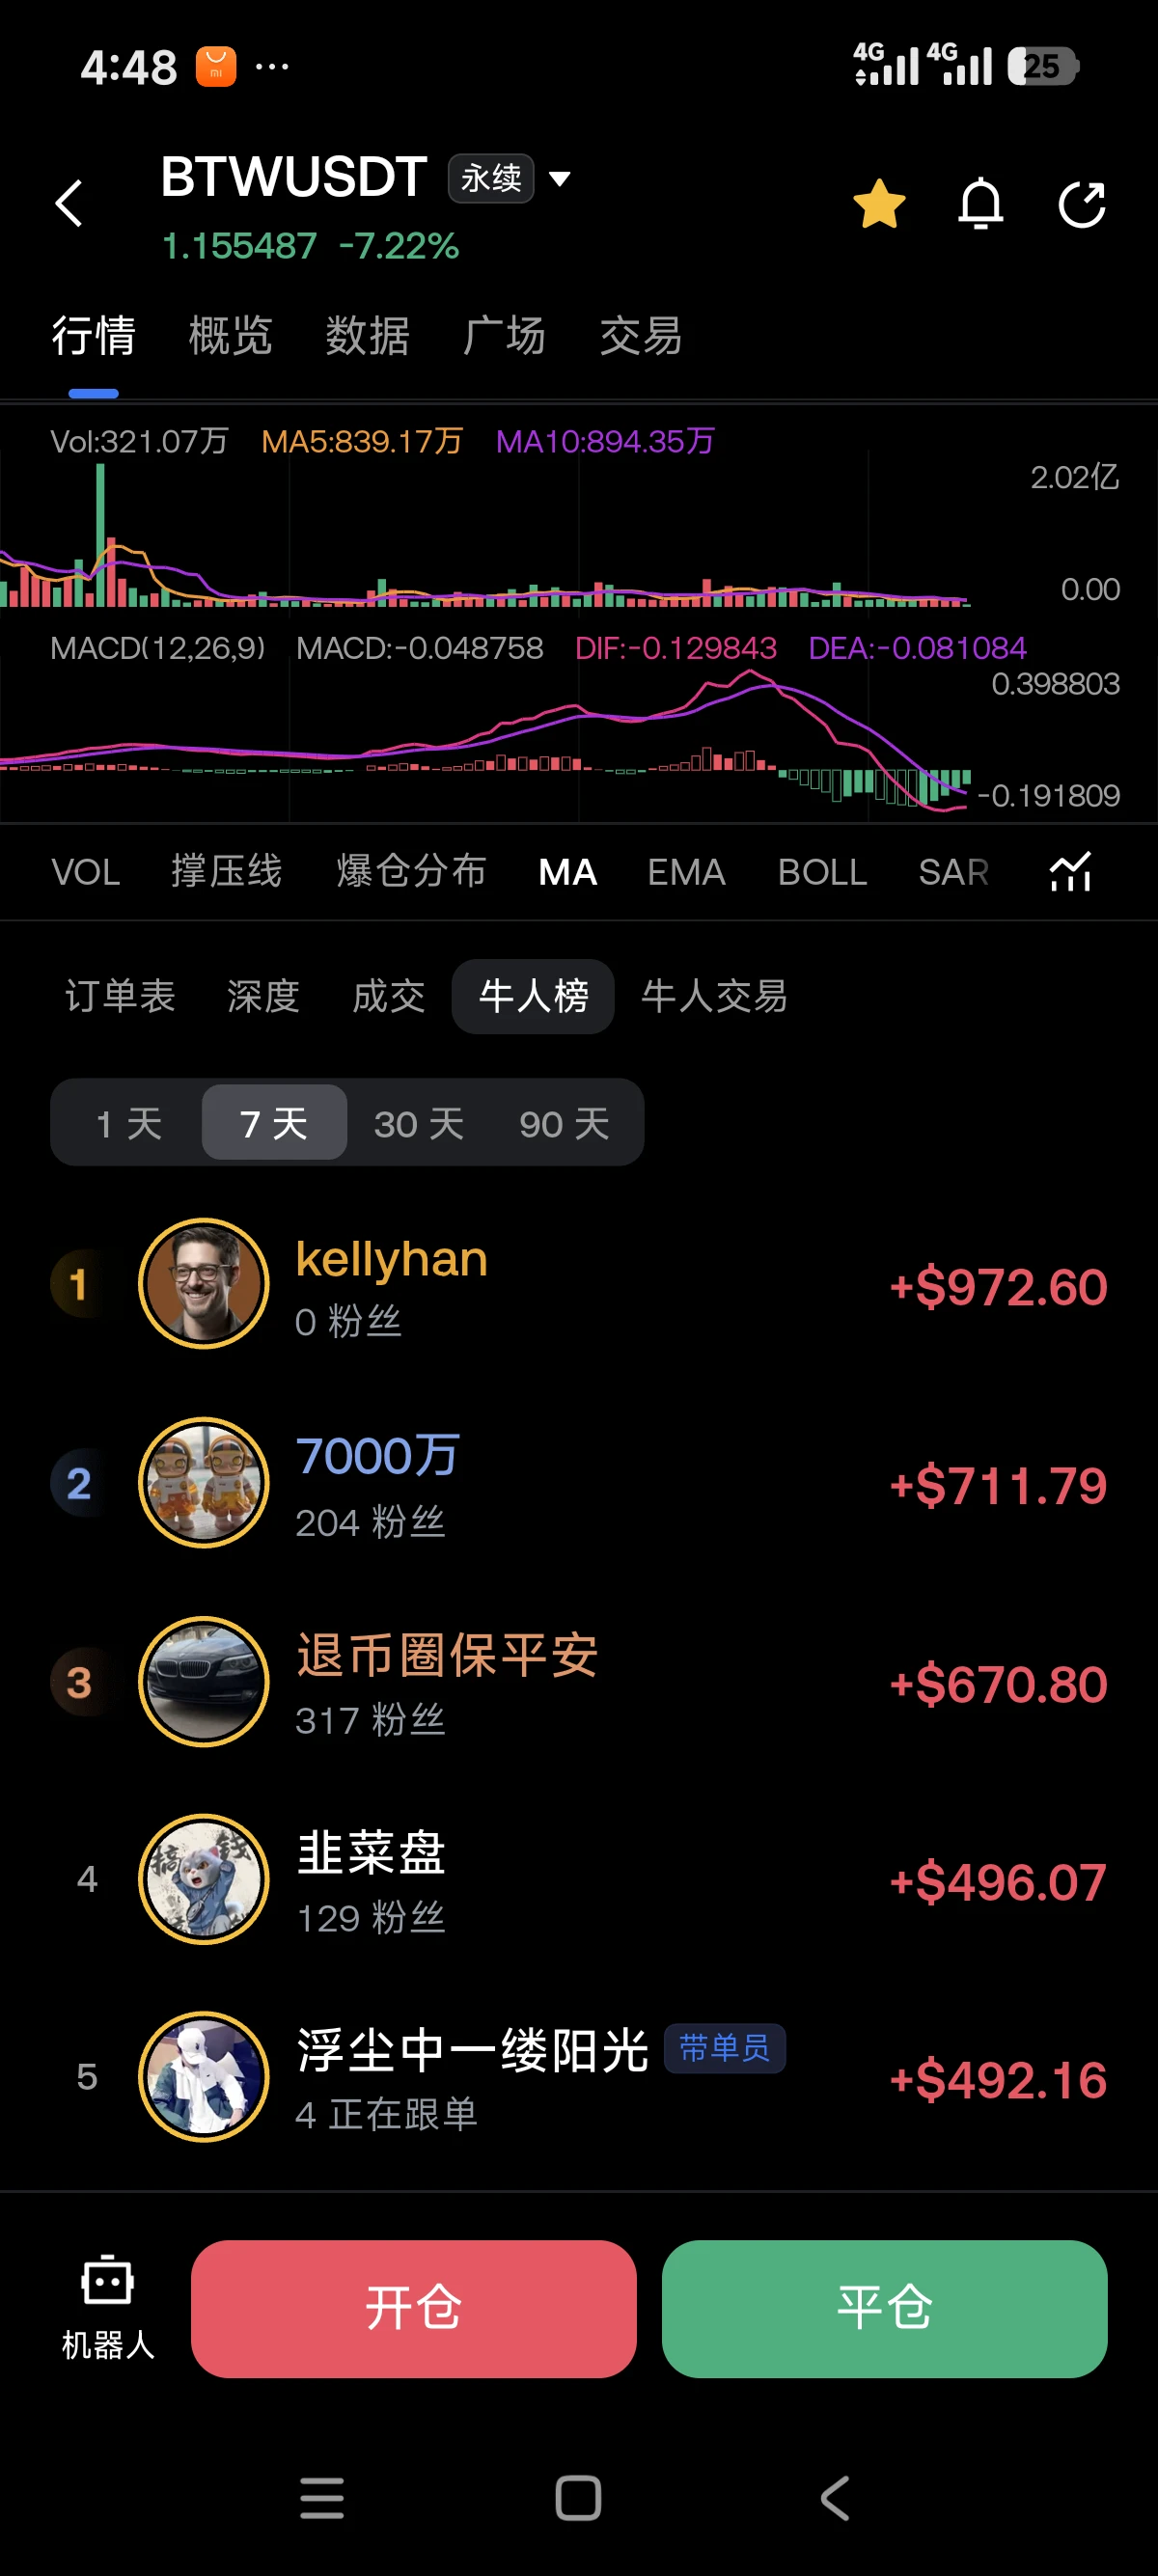
$BTW The data must be fake, right? How can a nobody like me, who earned so little, make the leaderboard
post-image
BTW-7.42%
The post-2000 generation won't put up with you.
Work during the day, then make her work as a drinking hostess at night.
She was so angry that she quit the next day.
Trenches
ZIG
Z
bade
b
ZIG
0x8c...1145
Market Cap
$.
Change
.
24h Vol
$.
Holders
.
BTC
B
bade
b
BTC
C5xp...pump
Market Cap
$.
Change
.
24h Vol
$.
Holders
.
Diamond
D
bade
b
Diamond
5VCE...pump
Market Cap
$.
Change
.
24h Vol
$.
Holders
.
DOGE
D
bade
b
DOGE
DoGE...fm7R
Market Cap
$.
Change
.
24h Vol
$.
Holders
.
STONK
S
bade
b
STONK
6GmA...UNgx
Market Cap
$.
Change
.
24h Vol
$.
Holders
.
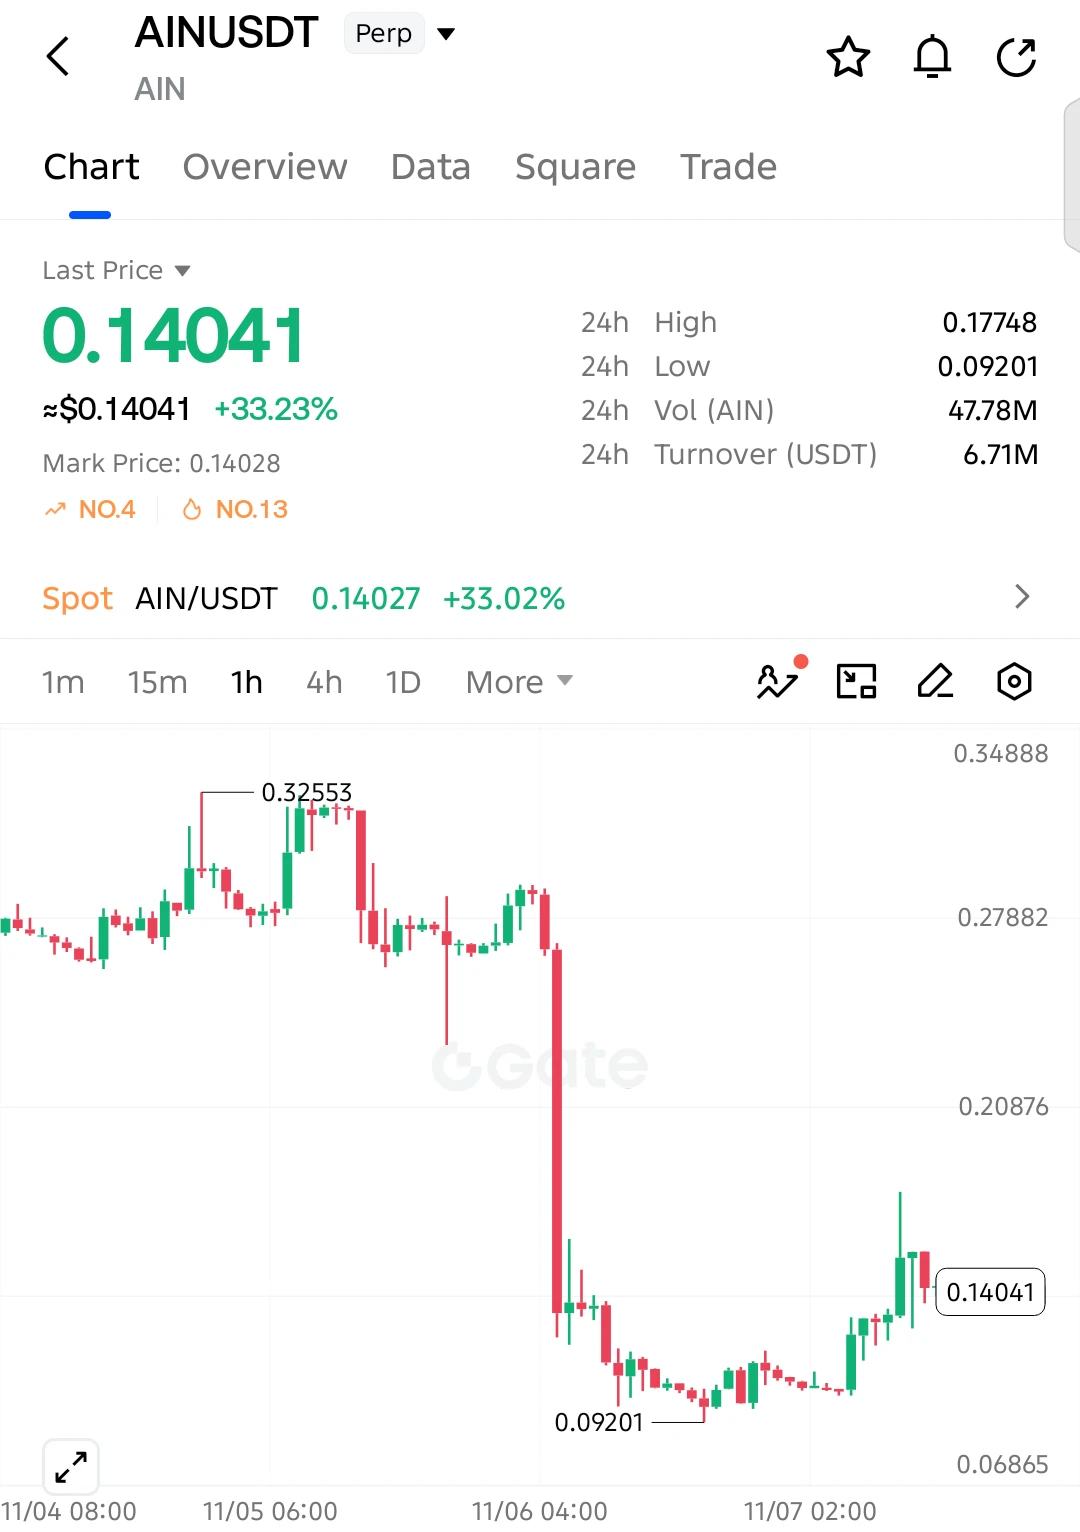
$AIN SHORT SETUP — BIG PUMP, STRONG REJECTION!

$AIN surged 33.23%, but the sharp rejection from 0.17748 suggests sellers are stepping back in. Another correction could be developing!

Entry: 0.14041
SL: 0.15850

TP1: 0.12800
TP2: 0.11500
TP3: 0.10200
Final Target: 0.09201

After a massive rally, $AIN faced aggressive selling near its recent high. The broader trend remains bearish, and if buyers fail to defend 0.1350, selling pressure could accelerate toward 0.1150 and potentially retest the previous low.

Invalidation: A sustained recovery above 0.15850 weakens the bearish setup.
post-image
AIN+3.85%
The best thing to do on a Saturday afternoon:
Nothing at all.
Keep scrolling on your phone until you get sleepy,
wake up again,
then keep scrolling.
A perfect cycle, no improvements needed.
post-image
Can There Be Sharp Pullbacks Even in a Bull Market? How Can You Distinguish a Normal Correction from a Trend Reversal?
In the cryptocurrency market, many traders have experienced this: BTC rises continuously for a while, then suddenly takes a sharp dip. Some believe it is a normal correction and continue holding; others think the bull market is over and rush to sell.
But how can you tell?
First, observe market structure. In a healthy uptrend, prices typically form progressively higher highs and higher lows. Even if a pullback occurs, as long as important lows are not decisively broken, the upw
post-image
BTC-0.67%
#StakeOnLaunchpoolToShare450KVLX

Gate is bringing another exciting opportunity to the crypto community with its Launchpool campaign, where users can stake supported assets and participate in sharing a reward pool of 450,000 VLX tokens. This campaign gives users another reason to explore the Gate ecosystem and discover new earning opportunities.

Launchpool is an interesting feature for crypto users because it allows participants to stake eligible assets and receive rewards according to the campaign rules. Instead of simply watching the market, users can explo
VLX+0.00%
  • 3
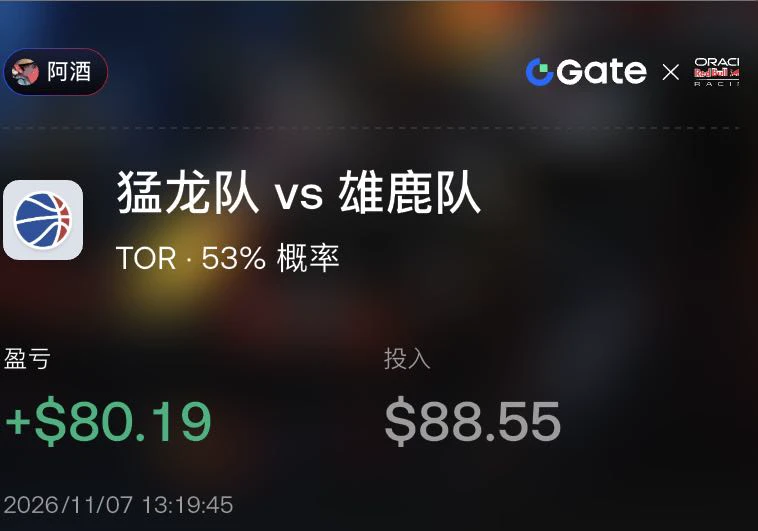
Thanks Gate, thanks NBA, thanks the Raptors, thanks myself!

#事件市场
post-image
$PUMP The coin is falling rapidly. Sell at 0.003955 and 0.003985. Targets: 0.003910, 0.003876, and 0.003840. Stop loss: 0.004065
post-image
PUMP-1.06%
Goldman Sachs is bullish on AI infrastructure, but investors are busy fleeing: Behind $125 billion lies a dangerous signal!

The current AI market is a bit schizophrenic.
Investors are worried that tech stock valuations are too high, yet have to admit that demand for AI infrastructure is still growing. Goldman Sachs has even raised its forecast for US data center construction spending, expecting it to reach $125 billion in 2028.
At first glance, this looks like a shot in the arm for the AI industry.
Cloud providers still have demand, backlogs remain, and tighter regulation is more likely to de
SPCX+8.74%
  • 13
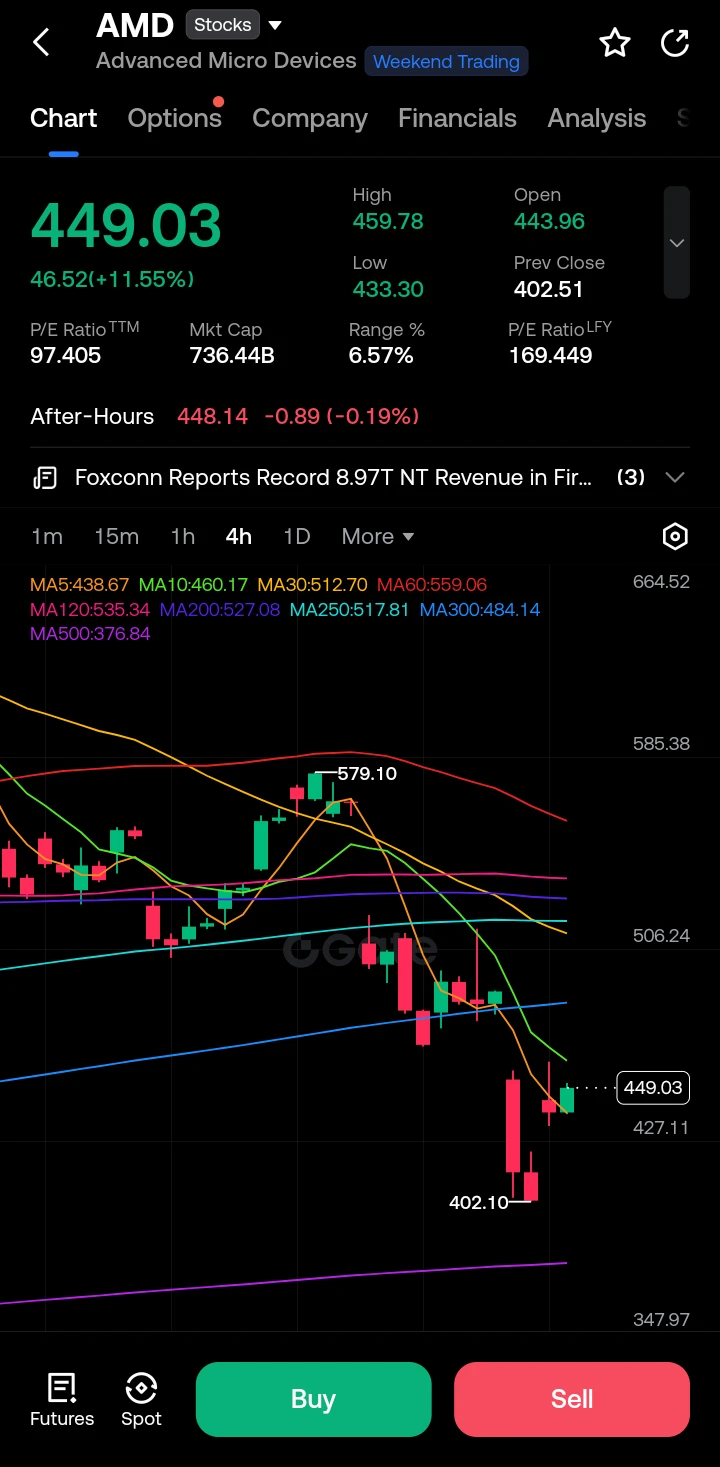
$AMD ‌
AMD closed at 449.03 (+11.55%) after a violent washout. Price dumped hard from the 579 zone into the 402 low, then staged a sharp recovery. After-hours is slightly softer at 448.14. Volume was heavy on both the sell-off and the bounce. Overall structure remains corrective after the October peak near 658.

Support: 433–430 (day low cluster) → 402.10 (major low)
Resistance: 460 (MA10) → 480–490 → 512–520 (MA30 zone)
Immediate pivot: 449–452

Clear distribution after the 579 high. Series of lower highs and aggressive red candles into the 402 low. The bounce produced a strong green candle
post-image
AMD+11.55%
  • 3
Weekend Afternoon Market Updates
live-cover
LIVE1,973
#BTCETFOutflowsContinue #BTCETFOutflowsContinue

Bitcoin is facing another important challenge as outflows from Bitcoin ETFs continue to attract attention across the cryptocurrency market. This development has become an important topic for investors because spot Bitcoin ETFs provide traditional financial investors with an easier way to gain exposure to Bitcoin without directly holding the cryptocurrency.

ETF inflows and outflows are important indicators of institutional investment sentiment. When Bitcoin ETFs experience strong inflows, it can show that more money is entering the market throu
BTC-0.31%
  • 3
The U.S. added 165,000 nonfarm payroll jobs in October, far exceeding expectations.
live-cover
LIVE2,772
U Sister 11.7 Weekend BTC $BTC Strategy

Current market: After a sharp drop, the market has entered a low-level sideways range. The 1-hour moving averages are tangled, with short-term bulls and bears battling and no clear one-way direction. This is a post-drop recovery and bottoming phase, with shrinking volume and a weak rebound.

Short entry: Go short if price stalls in the 76200-76500 range
Stop-loss: Above 76850
Targets: 75400-74900

Go long if price pulls back to 74800-75000 and holds firm
Stop-loss: Below 74500
Targets: 75800-76200

Selling pressure from the earlier sharp drop has not b
BTC-0.65%
What Is Volume-Price Divergence? How Can You Spot a Trend Reversal Early?
In crypto trading, many people watch candlestick charts every day and assume that an uptrend will continue when they see prices repeatedly hitting new highs.
But sometimes, a warning sign has already appeared: prices are still rising, while trading volume and technical indicators are starting to weaken.
This is what traders often call volume-price divergence.
What Is Volume-Price Divergence?
Simply put, it is a mismatch between price movements and trading volume or momentum indicators.
For example, in an uptrend, BTC may
post-image
BTC-0.67%
Goldman Sachs Bets $125 Billion, but AI Investors Are Starting to Sweat: Is Computing Power or Borrowing to Build Data Centers More Profitable?

There’s an interesting phenomenon in the AI industry: everyone is talking about how smart artificial intelligence is, but few are seriously calculating how much it costs to train this intelligent system.
Recently, tech stocks have plunged, and investors have begun reassessing the AI industry’s high-investment model. Goldman Sachs, however, has not changed its optimistic stance. Instead, it has raised its forecast for U.S. data center construction spen
AMD+11.55%
  • 29
#On-chain metrics analysis
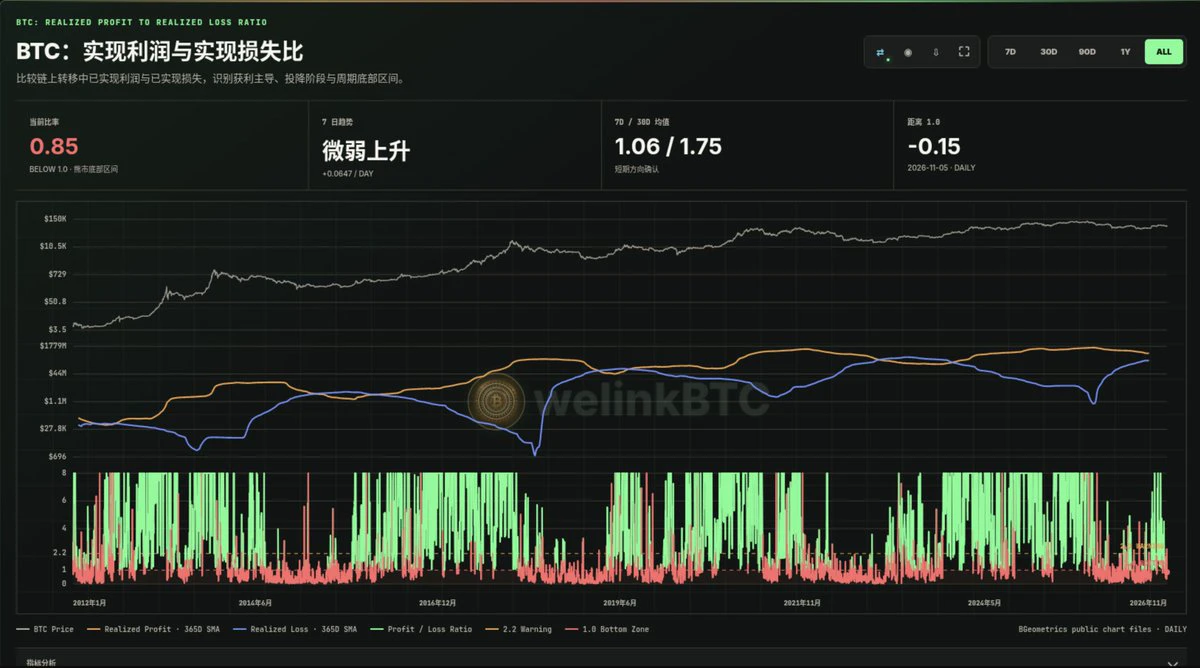
BTC: Realized Profit to Realized Loss Ratio
When losses outweigh profits, market sentiment warrants a degree of caution.
As of November 5, 2026, the daily profit-to-loss ratio for BTC was 0.85, falling below the 1.0 break-even point, placing it in the bear market bottom observation zone. The 7-day and 30-day moving averages were 1.06 and 1.75 respectively, while the 30-day moving average had already fallen below the 2.2 cooling-off period observation line on November 3, 2026.
How do we interpret this indicator? It is calculated by dividing realized profits from on-ch
post-image
📣 November 6 Daily Top Posts: Good insights deserve to be seen
When will heavy AI investment deliver returns? Does an index rebound mean the market is strengthening? After making a bad trading call, how should you reassess your thinking?
These 8 posts cover everything from market analysis to trading reflections. Let’s take a look at what creators are observing👇
🔹 @赚钱吃肉肉: Ongoing AI investment: Can profits and cash flow keep up?
https://www.gate.com/zh/post/status/curated/25443255
🔹 @龙抄手: Rebound or reversal? A video anal
GateSquare
📣 November 6 Daily Top Posts: Good insights deserve to be seen
When will heavy AI investment deliver returns? Does an index rebound mean the market is strengthening? After making a bad trading call, how should you reassess your thinking?
These 8 posts cover everything from market analysis to trading reflections. Let’s take a look at what creators are observing👇
🔹 @赚钱吃肉肉: Ongoing AI investment: Can profits and cash flow keep up?
https://www.gate.com/zh/post/status/curated/25443255
🔹 @龙抄手: Rebound or reversal? A video analysis of BTC / ETH
https://www.gate.com/zh/post/status/25417274
🔹 @币靠普: Beyond the AI growth story, what else are investors watching?
https://www.gate.com/zh/post/status/curated/25443260
🔹 @云享财富讲堂: Tech stocks under pressure: What else needs to be confirmed before the Nasdaq rebound?
https://www.gate.com/zh/post/status/25442782
🔹 @山顶Ryak: Understanding PoSEC and asset verification from the user’s perspective
https://www.gate.com/zh/post/status/25427269
🔹 @阿炼CryptoView: BTC / ETH strength and key levels after the pullback
https://www.gate.com/zh/post/status/25443539
🔹 @初心实盘: After a trading mistake with SanDisk, reassessing mindset and judgment
https://www.gate.com/zh/post/status/25433936
🔹 @分析师Ansem: How do news events affect market sentiment and short-term volatility?
https://www.gate.com/zh/post/status/curated/25437719
🎁 Selected authors receive 3 days of traffic support + featured content
💬 Which post gave you a new perspective?
Visit the original post to share your questions, additions, or differing views. You’re also welcome to recommend yourself or others for great content in the comments.
The next top post might be yours.
The author’s views are for reference only and do not constitute investment advice or a promise of returns.
‍#每日神贴 #Gate Square
repost-content-media
BTC-0.67%
ETH-1.26%
NDAQ+0.28%
INDEX+0.00%
  • 2
What should you do after the sell-off? — My “Three-Layer Response Framework”

When the market falls this hard, the least useful thing is saying “if only I’d known.” What matters is what your positions and plan look like after the sell-off.

I’ve set up a three-layer framework for myself and want to share it with you guys.

Layer one: Don’t catch a falling knife; wait for “declining volume and a bottom.” The Philadelphia Semiconductor Index could fall 12% in one day, then rebound the next day—or keep falling. Trying to buy the dip during a “high-volume sell-off” is like catching a knife with yo
AMD+11.55%
  • 1
With funding rates this deeply negative, most of the people longing $SOL are basically stuck holding their positions. The fact that futures longs are so deep underwater points to one thing: the meme coins that actually break out aren’t about who shouts the loudest, but who has something real.
post-image
SOL-0.74%
MEME-0.94%
Load More

Join 40 M users in our growing community

⚡️ Join 40 M users in the crypto craze discussion

💬 Engage with your favorite top creators

👍 See what interests you

Trending Topics

USAIStocksHitHard

16.49k Views3.65k Discussing

U.S. stocks sold off sharply on Thursday, November 5 (UTC). The Nasdaq closed down around 5.5%, entering correction territory, while the Philadelphia Semiconductor Index plunged roughly 12%, with chip stocks including $NVDA and $AMD posting steep losses. Beyond profit-taking, investors are growing concerned about the pace of AI data center construction, capital spending, and future returns on investment. The key question now is whether the AI sector’s lofty growth expectations need to be repriced. Where do you think the next opportunities will emerge: chip stocks, tech giants, or other sectors?

USNonfarmPayrolls

24.51k Views4.27k Discussing

StakeOnLaunchpoolToShare450KVLX

3.17k Views781 Discussing

View More