Square
Following
Hot
News
Notifications
Profile
Share your thoughts
placeholder
Article
#UNI

UNI Moves 2.6% Higher: The Price Is Rising, but Is the Bigger Story Just Beginning?

The Before-and-Now Picture

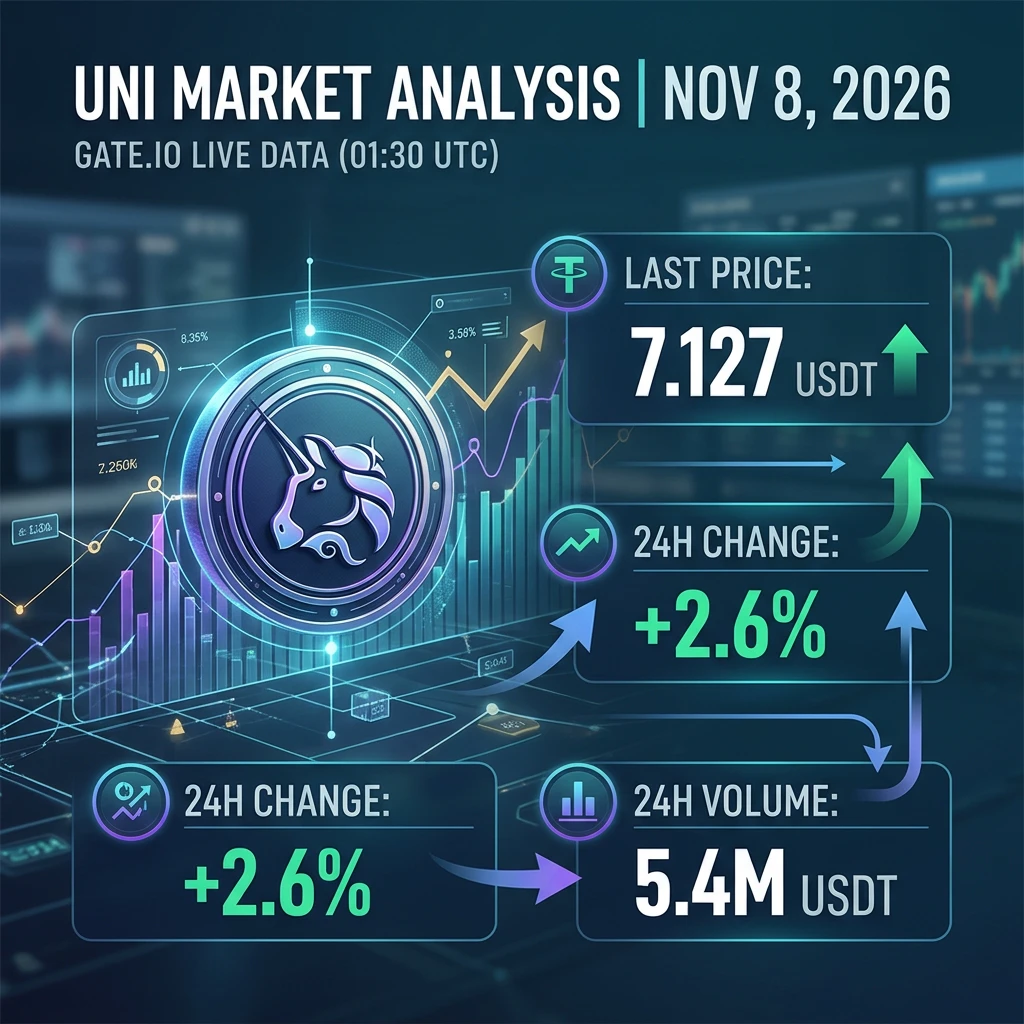
UNI is showing stronger short-term momentum. At the latest reported market snapshot on November 8, 2026, UNI/USDT was trading at $7.127, up 2.6% over 24 hours, with approximately $5.49 million in trading volume.

The change is positive, but the important question is not simply how much UNI has increased. It is whether buyers can maintain this momentum or whether the market is experiencing a temporary recovery.

For traders, this is where looking beyond the percentage change b
post-image
UNI+3.05%
  • 3
  • 1
Our merits before God arise from His initiative and our free cooperation.
“The merit of man before God in the Christian life arises from the fact that God has freely chosen to associate man with the work of his grace. The fatherly action of God is first on his own initiative, and then follows man’s free acting through his collaboration…”
CCC 2008
post-image
Trenches
ZIG
Z
bade
b
ZIG
0x8c...1145
Market Cap
$.
Change
.
24h Vol
$.
Holders
.
STONK
S
bade
b
STONK
6GmA...UNgx
Market Cap
$.
Change
.
24h Vol
$.
Holders
.
IDOL
I
bade
b
IDOL
0x3b...ab07
Market Cap
$.
Change
.
24h Vol
$.
Holders
.
BTC
B
bade
b
BTC
C5xp...pump
Market Cap
$.
Change
.
24h Vol
$.
Holders
.
FLOAT
F
bade
b
FLOAT
Bv1a...BMmr
Market Cap
$.
Change
.
24h Vol
$.
Holders
.
⛽ Dragon and Loran Gas: What the Agreement with Trinidad Means for P2P
Trinidad and Tobago is confident that OFAC licenses for the Dragon and Loran gas fields will remain in effect despite the election-related noise in Washington. Prime Minister Kamla Persad-Bissessar said her government will continue working with the United States to keep the licenses in effect. For Venezuela, every phase of gas development that moves forward also affects foreign currency flows, exchange-rate expectations, and sentiment in the USDT market.
🔹 The hard facts
• Dragon: 4.2 trillion cubic feet of gas, about 40 k
post-image
CVX-0.14%
SHEL-1.02%
Near market update
live-cover
LIVE2,151
Many traders see the RSI above 70 and assume the market has risen too much and prices are about to fall, so they rush to open short positions. But in real market conditions, especially during a strong uptrend, BTC can continue rising even after the RSI enters overbought territory, and may even remain at elevated levels for a long time.
Why does this happen?
First, the trend is strong. In a clear uptrend, buying pressure remains stronger than selling pressure, and the RSI may stay above 70 for an extended period. This does not mean prices are about to reverse; it may instead indicate that bulli
BTC-0.67%
On Sunday, I was hoping for a little peace and quiet
Opening on-chain monitoring put an end to that
An address was labeled as the Drift attacker
About 9 hours ago, it withdrew 3,100 ETH from Tornado
Swapped it for about 6.92 million USDC
Deposited it into Hyperliquid
Then immediately opened opposing positions at 20x leverage
Long about 169 BTC
Notional value about 12.84 million
Short about 5,740 ETH
Notional value about 12.83 million
The two sides combined came to a little over 25 million
Later, someone also saw the positions continue to grow
The long position reached 263 BTC
The short positio
post-image
DRIFT-2.72%
ETH-1.26%
USDC+0.01%
BTC-0.65%
  • 1
  • 1
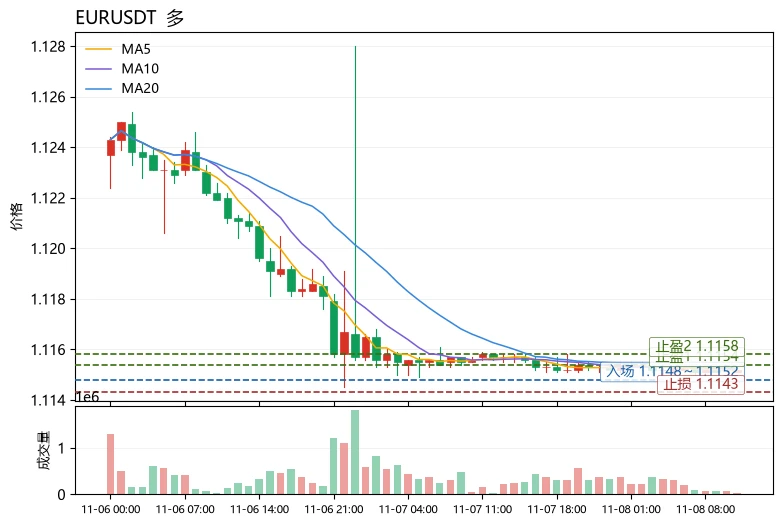
$EUR Current price 1.1152, 24h -0.04%. The range across 30 candlesticks is only about 0.1%, with volatility extremely compressed. On the moving-average front, MA5=1.11516 is slightly below MA20=1.11526; the short- and medium-term moving averages are converging and flat, with no clear direction. RSI=37.6 is in the weak zone but not oversold. The MACD histogram=+0.0001182 remains slightly bullish, but momentum is insufficient. The Bollinger Bands [1.11508,1.11544] are extremely narrow, and the price is trading near the lower band. The Fear & Greed Index is 28, indicating fearful market sentiment
post-image
eur
eureur
Gate.Fun
MC:$5.55KHolders:3
0.06%
LTC-0.07%
UNI+3.05%
post-image
HYPE+0.33%
$AKE Go short now—a crash is imminent!!! After two rallies marked by price-volume divergence, now is the time to enter. Go short and sit tight, waiting for it to hit new lows
post-image
AKE+6.07%
#Gate股票畅聊季 #美股财报季 What’s next for U.S. stocks?

Global market risks are building, and core AI assets may face a repricing of volatility. U.S. stocks have undergone a round of risk unwinding, so what comes next for the market?

The sharp swings in U.S. stocks recently reflect a shift in the market’s focus: investors are watching AI revenue growth while also asking when massive investments will translate into profits and cash flow. As of November 6, Eastern time, I’m more inclined to characterize the current market as being in a high-volatility correction phase, with room for a short-term reboun
NAS100-0.07%
AMZN-0.44%
MSFT-0.95%
AMD+11.55%
INTC+8.00%
  • 4
#USCPIDataIncoming

Will the Next U.S. CPI Report Trigger a Major Move in Bitcoin, Stocks and Gold?

The Key Question

Will U.S. inflation cool enough to improve market sentiment, or will another hot reading create fresh pressure across financial markets?

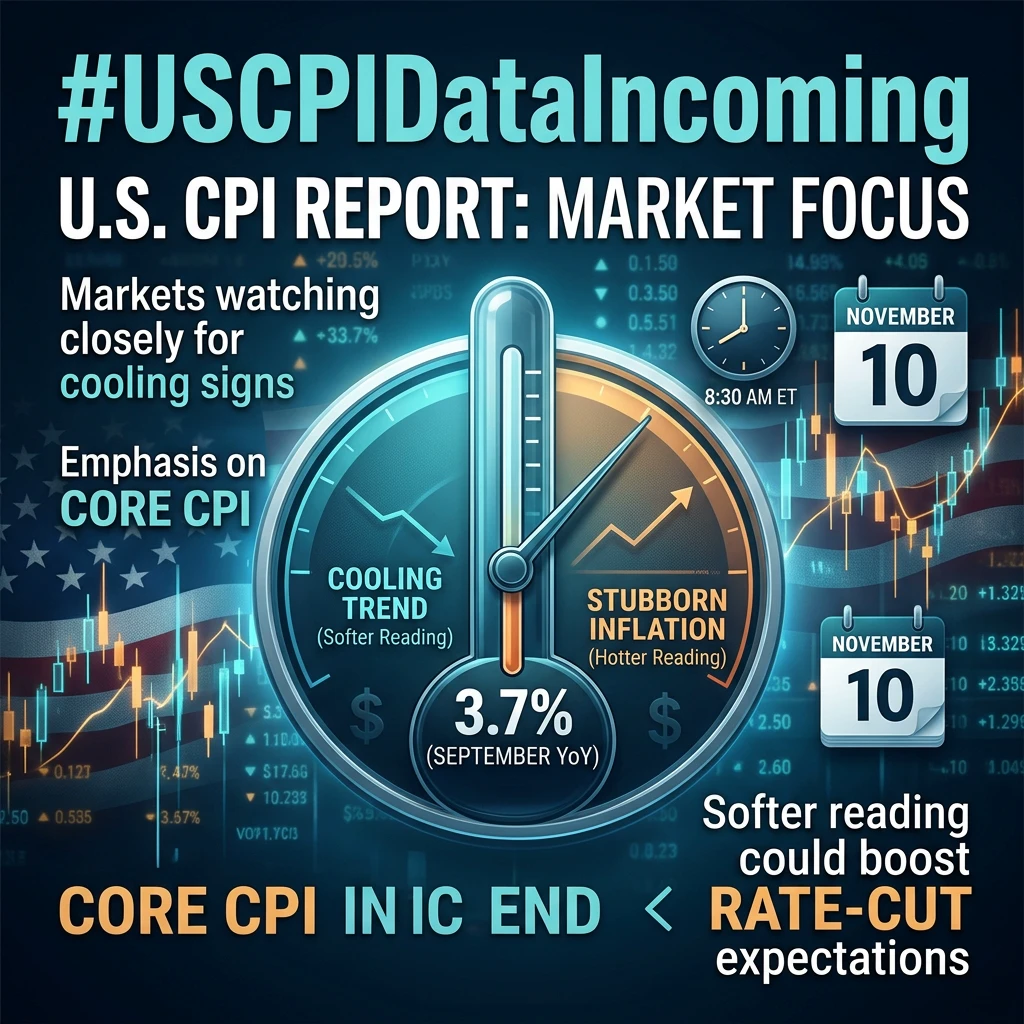
Investors are preparing for an important economic release on November 10. The October U.S. Consumer Price Index (CPI) report is scheduled for 8:30 a.m. Eastern Time. Its results could influence expectations about future Federal Reserve interest-rate decisions and create volatility across Bitcoin, U.S. stocks and gold.

The important point i
post-image
BTC-0.67%
$ERA The daily chart has seen two rounds of high-volume choppy trading, and the uptrend has resumed. The rally is about to begin—go long now!!!
post-image
ERA+24.21%
The cleaning lady said that young couple from yesterday really knew how to have fun!
Oh my God.
Ah, to be young...
$BCH Fell to the weakest in the sector—is this a risk or an opportunity? The answer leans bullish—this is relative weakness amid panic-driven indiscriminate selling, not a fundamental collapse.

Comparing across the sector: NEAR is currently at 3.688, down just 2.12% over 24h; MA5 has crossed above MA20, RSI is neutral at 47.6, and the MACD histogram has turned positive, with a much smaller decline than BCH. MITO is even up 21.26% against the trend, with a relatively strong RSI of 60.6. Of the three, BCH is relatively the weakest: down 6.24% over 24h, with its price of 248 below MA5 at 248.62
BCH+0.95%
MITO+8.51%
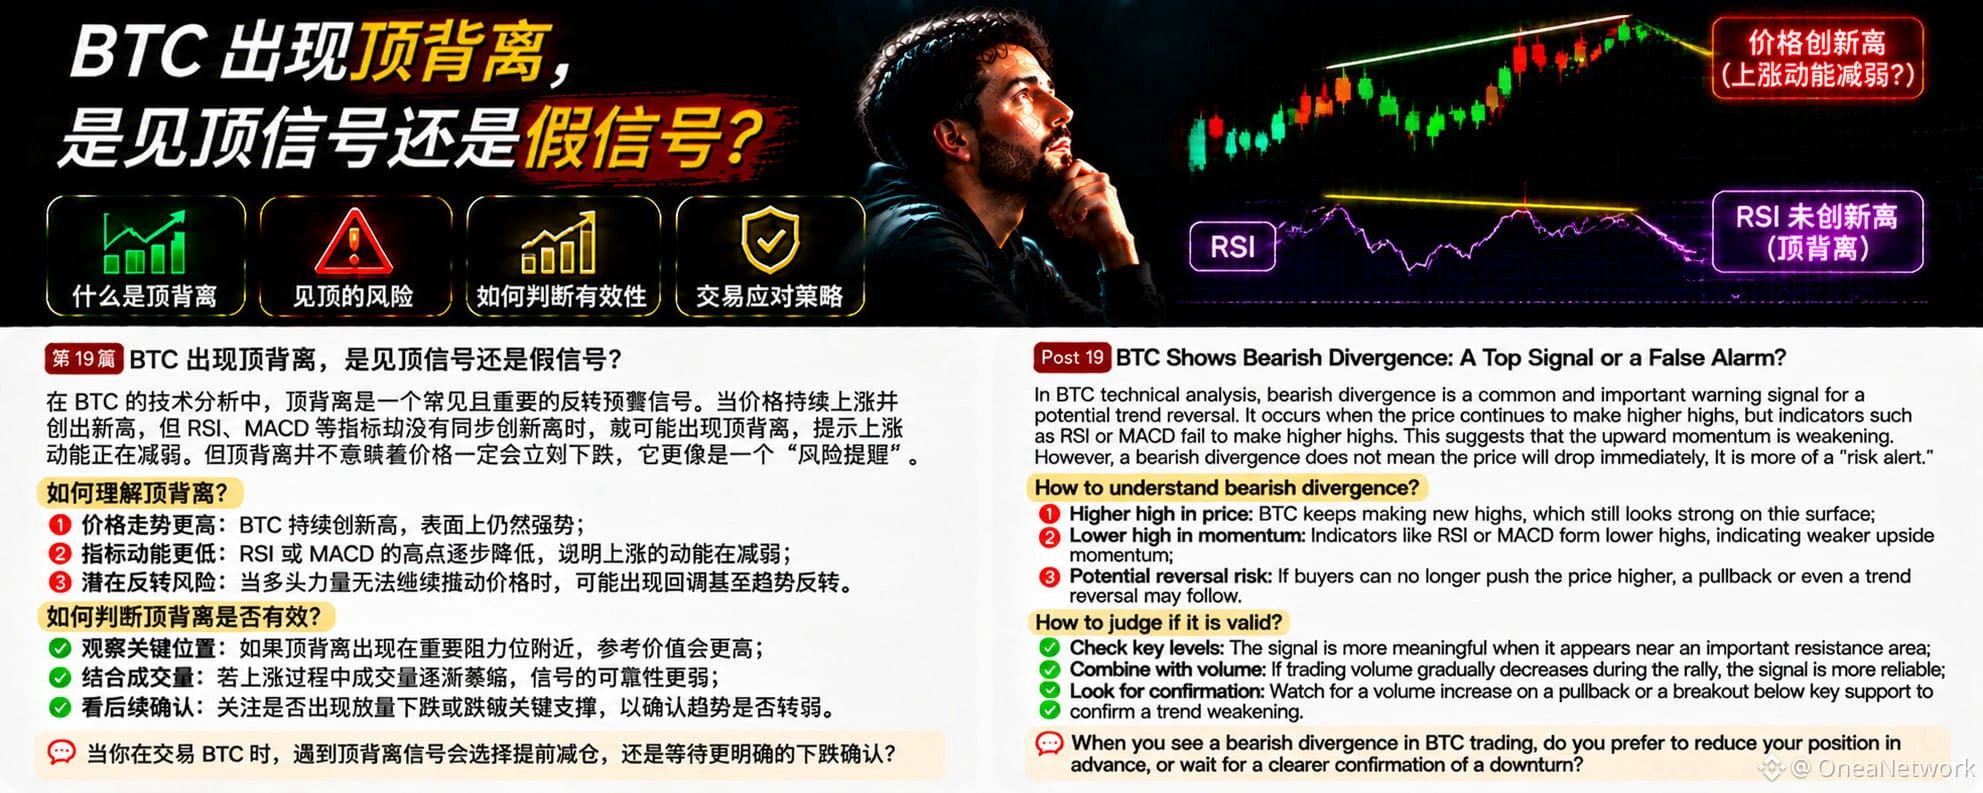
In BTC technical analysis, bearish divergence is a risk warning signal worth watching. Many traders see prices continually making new highs and assume the uptrend remains strong. But if prices continue to rise while indicators such as RSI or MACD fail to make new highs, bearish divergence may occur.
What is bearish divergence?
Simply put, it is when the price makes a higher high, but the technical indicator forms a lower high. This suggests that although the price is still rising, the momentum driving the rise may be weakening.
Why is bearish divergence worth watching?
First, upward momentum m
post-image
BTC-0.67%
🔹 Bitcoin Doesn’t Need Banks, but Strategy Wants to Become a Bitcoin Bank
live-cover
LIVE2,644
I did it @MetaMask where’s my $100k prize?
post-image
$PI Cut your losses; the great waves wash away the sand and reveal gold too
post-image
PI-0.60%
  • 3
Why has the Ahr999 dropped below 0.45, and what does this signify?

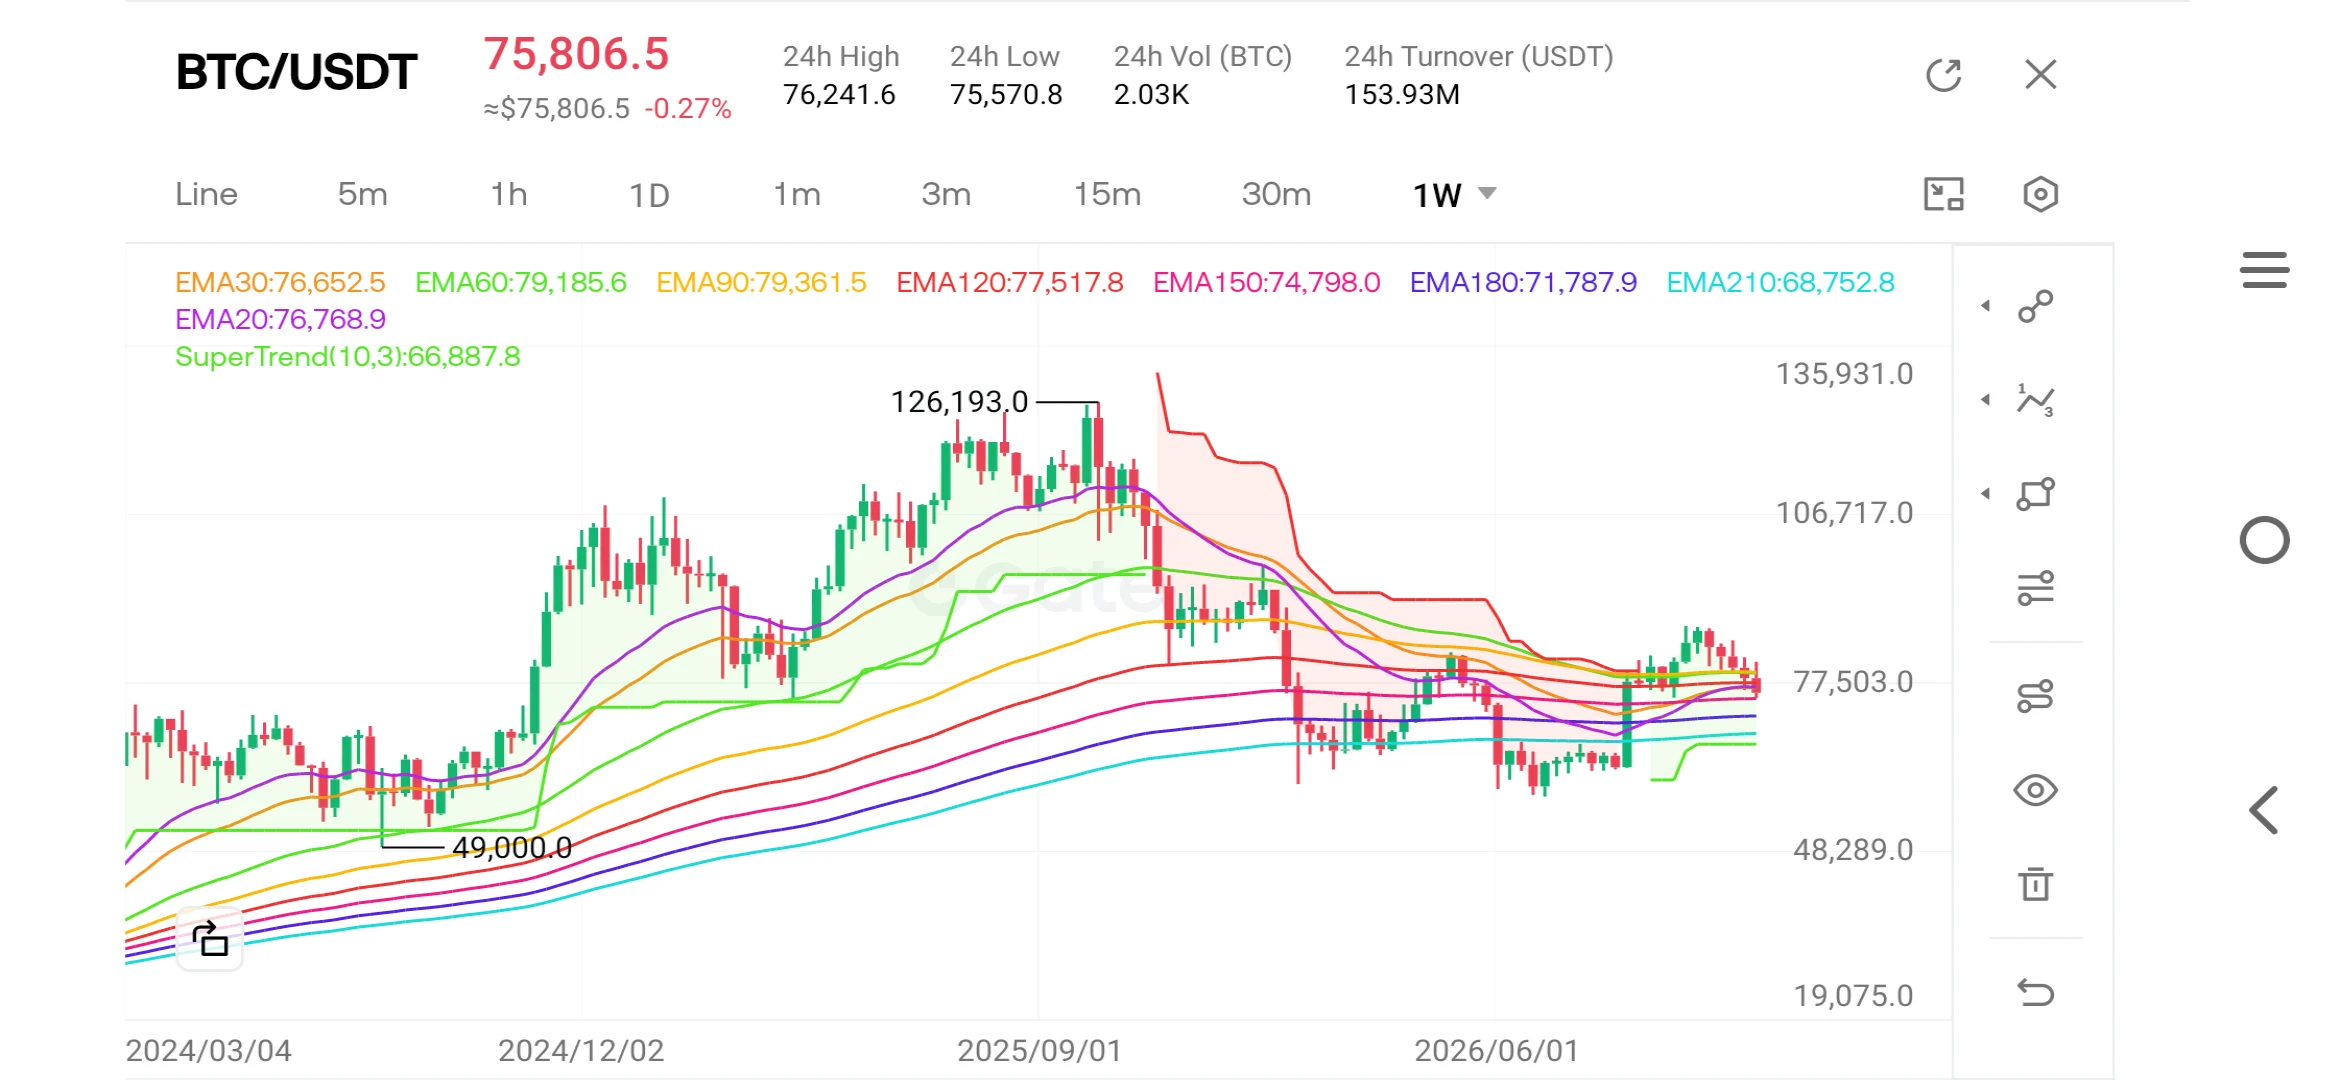
As Bitcoin trades within the $75,000–$76,000 range, the Ahr999 indicator has fallen below the 0.45 threshold to approximately 0.43—a level historically identified as a "buy-the-dip" zone. It has been confirmed that previous instances where the indicator dipped below 0.45 coincided with the market bottoms seen in late 2018, early 2020, and the 2022 bear market. Furthermore, it is noted that Bitcoin is currently attempting to defend the $75,000 support level, with the market’s focus fixed on the U.S. Consumer Price Index (CPI) d
post-image
BTC-0.67%
  • 1
Will This Week’s CPI Data Bring a Reversal?❓
This Week’s (11.9–11.15) Major Web3 Events⭐️
November 9
Release date moved to November 9, allowing Polymarket Protocol V2 to avoid U.S. midterm election week;
Hyperliquid L2 network Elysium to launch on November 9;
Uniswap confirms V4 Hooks support on Elysium, with mainnet expected to launch on November 9
Mercado Bitcoin: Platform to resume in phases on November 9, with compensation paid from its own funds
November 10
U.S. October CPI to be released on November 10 at 21:30;
Bitcoin payment acceptance expands to more than 4 million merchants, with Sq
post-image
HYPE+0.24%
UNI+3.05%
BTC-0.67%
MSCI-2.25%
BLUR-5.93%
  • 2
Load More

Join 40 M users in our growing community

⚡️ Join 40 M users in the crypto craze discussion

💬 Engage with your favorite top creators

👍 See what interests you

Trending Topics

USCPIDataIncoming

1.04k Views1.47k Discussing

The U.S. October CPI report will be released on November 10 at 8:30 a.m. ET. September CPI came in at 3.7% year over year, and markets will be watching closely for signs that inflation is cooling, especially in core CPI. A softer-than-expected reading could strengthen rate-cut expectations, while hotter inflation may pressure risk assets through higher Treasury yields and a stronger dollar. How do you think this CPI print will move $BTC, U.S. stocks and gold?

USAIStocksHitHard

23.56k Views3.69k Discussing

USNonfarmPayrolls

40.34k Views4.38k Discussing

View More