Square
Following
Hot
News
Notifications
Profile
Share your thoughts
placeholder
Article
What Is Feature Engineering? How Can More Valuable Trading Signals Be Extracted from Price, Volume, and Volatility?

In crypto quantitative trading, the performance of machine learning models depends not only on the algorithm, but also on the quality of their input data. Raw price and volume records capture market movements, but may not directly express trends, momentum, and risk. Feature engineering is the process of transforming raw data into information that is more suitable for models to learn from.

First, how can price features be constructed?

You can calculate returns over different pe
post-image
What Is the Brier Score? How Can Mathematical Methods Evaluate the Quality of a Trading Model’s Probability Predictions?

In crypto quantitative trading, even if a model often correctly predicts whether prices will rise or fall, that does not mean the probabilities it gives are reliable. For example, if a model predicts a 90% chance that BTC will rise, but prices rise only 60% of the time after similar predictions, it may be overconfident. The Brier score can help us evaluate the error between probability predictions and actual outcomes.

First, what is the Brier score?

For binary predictions
post-image
BTC-0.67%
Trenches
PIEVERSE
P
bade
b
PIEVERSE
0x0e...25a9
Market Cap
$.
Change
.
24h Vol
$.
Holders
.
牛逼
牛
bade
b
牛逼
0x96...7777
Market Cap
$.
Change
.
24h Vol
$.
Holders
.
ON
O
bade
b
ON
0x0e...1d48
Market Cap
$.
Change
.
24h Vol
$.
Holders
.
STONK
S
bade
b
STONK
6GmA...UNgx
Market Cap
$.
Change
.
24h Vol
$.
Holders
.
FLOAT
F
bade
b
FLOAT
Bv1a...BMmr
Market Cap
$.
Change
.
24h Vol
$.
Holders
.
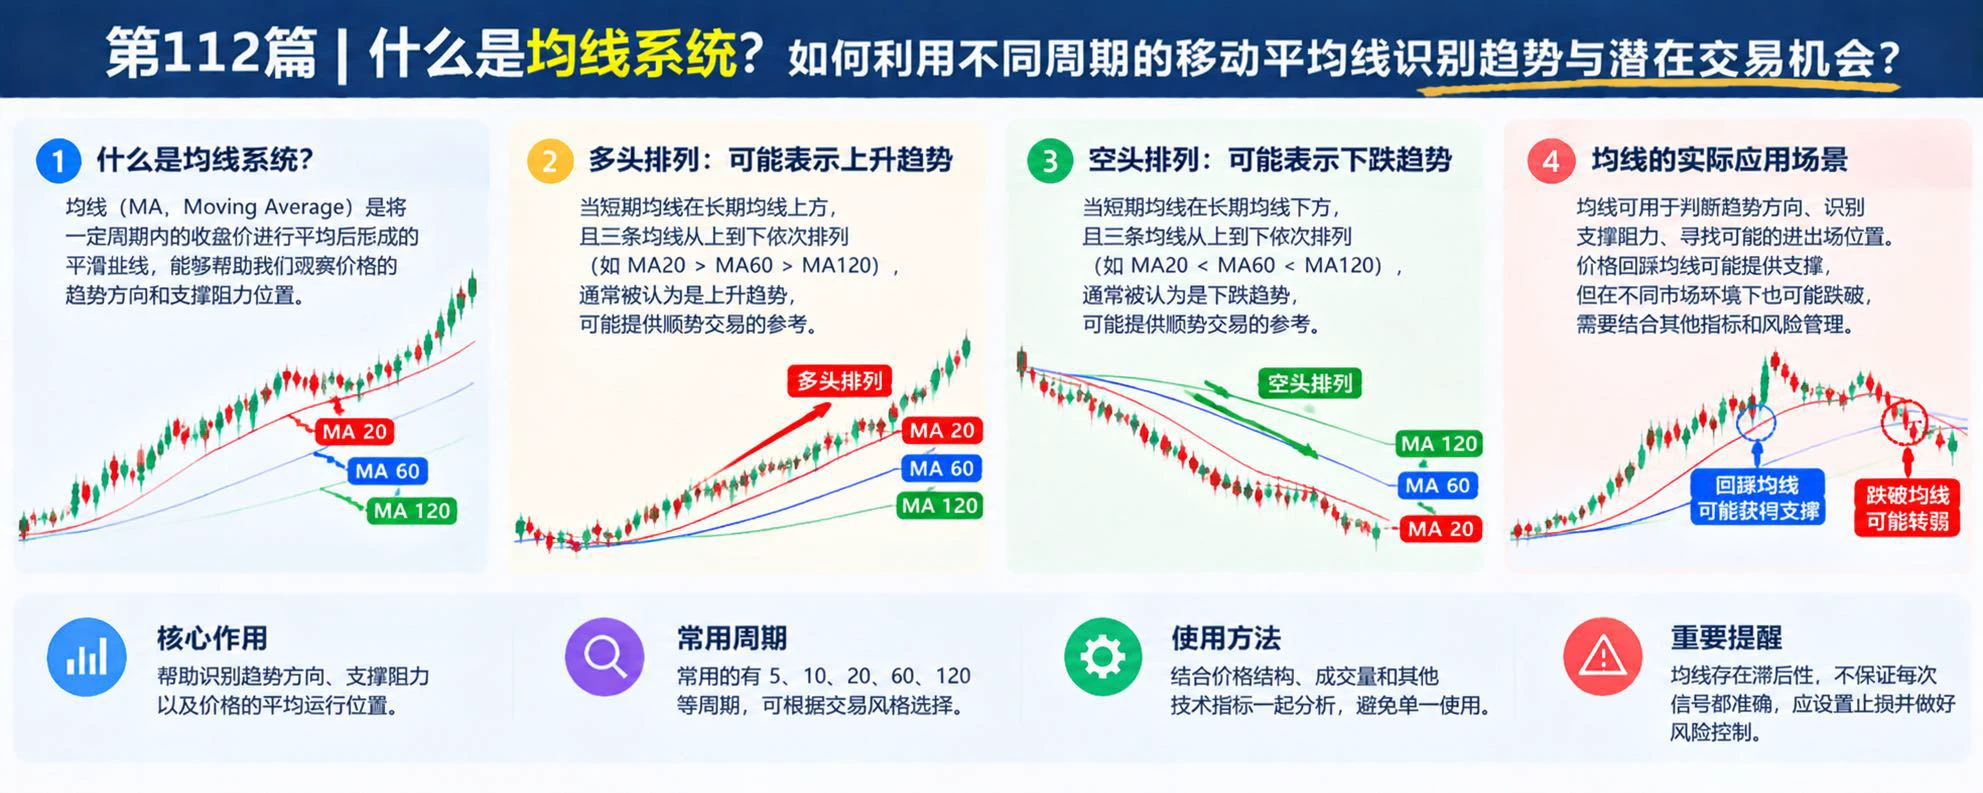
What Is a Moving Average System? How Can Different Moving Average Periods Be Used to Identify Trends and Potential Trading Opportunities?

In cryptocurrency trading, BTC’s short-term volatility often makes it difficult to judge the overall direction. Moving averages (MAs) smooth price data over a period of time, helping traders observe trends, identify potential support and resistance, and avoid overreacting to short-term noise.

First, what is a moving average system?

A moving average is the average closing price over a given period. Common periods include MA5, MA20, MA60, and MA120. Short-p
post-image
BTC-0.67%
What Is Multi-Timeframe Analysis? How Can You Combine Short and Long Timeframes to Avoid Making Poor Decisions Based on Local Price Action?

In crypto trading, BTC may be rising on the 5-minute chart while still being in a clear downtrend on the 4-hour chart. If traders only watch short timeframes, they can mistake a rebound for a trend reversal. Multi-timeframe analysis uses price structures across different timeframes to help traders understand the relationship between local fluctuations and the broader trend.

First, what is multi-timeframe analysis?

It means observing multiple timeframes
post-image
BTC-0.67%
The U.S. October CPI hasn’t been released yet tonight, and the probability of a Fed rate hike in December has surged to 90%—this rate hike is basically a done deal!
This is definitely a real bearish catalyst for U.S. stocks and Bitcoin, which will likely come under pressure in the short term.
I just hope this is the final rate hike of this cycle. Please! 🙏
BTC-0.67%
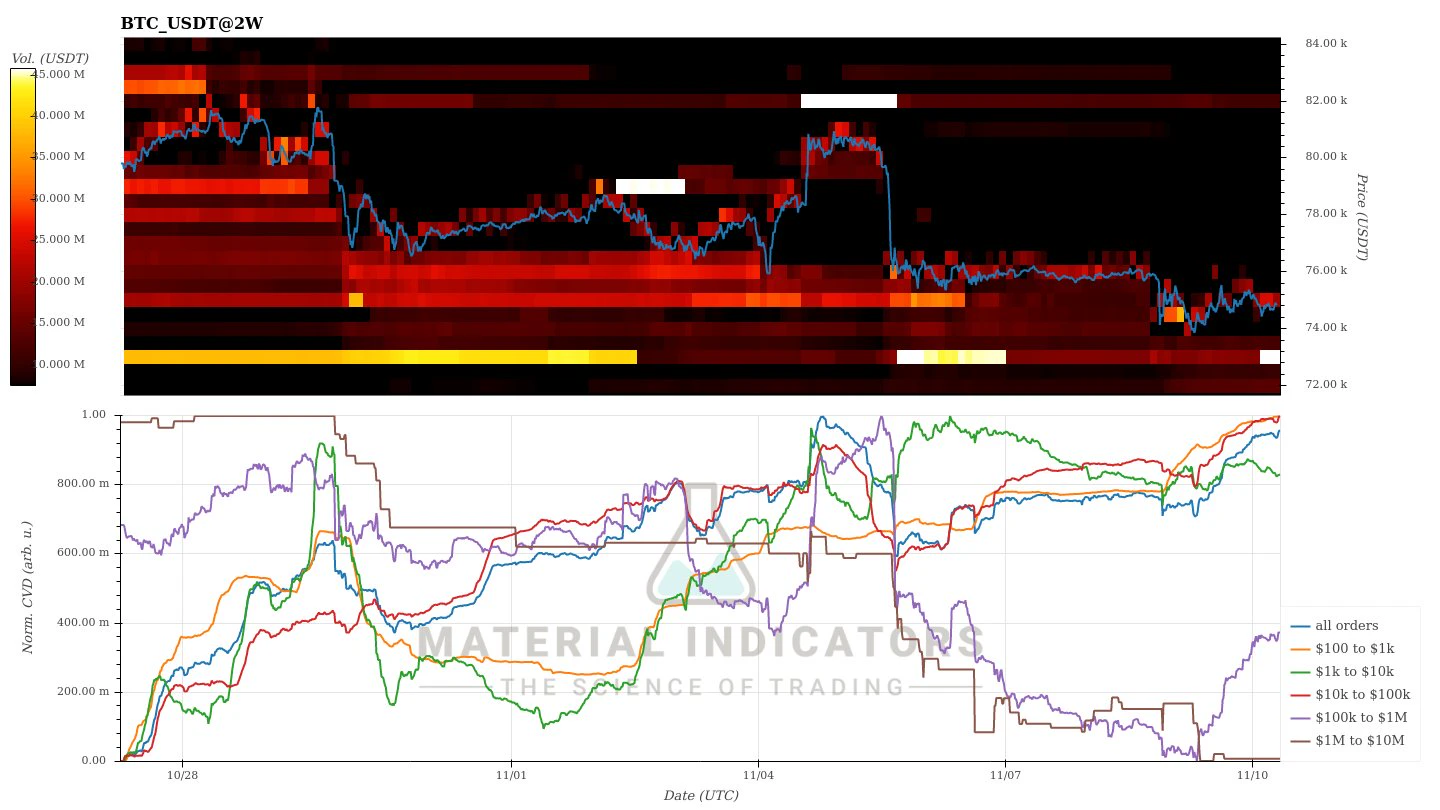
The $BTC CVD indicator shows buying activity of purple whales.

They have been accumulating since yesterday, which is reflected in the CVD indicator showing net buying.

Additionally, a buy wall has formed near the $73k level, serving as a strong support line.
post-image
BTC-0.67%
Low-Cost Christmas
and
High-Cost Christmas
Today, let’s talk about the higher timeframes

U.S. stocks rebounded last night, but crypto didn’t follow. Capital’s preferred choices show that crypto is still playing second fiddle.

See image 1: $ETH . ETH’s daily chart has broken below the bull-bear dividing line, also known as the bull/bear boundary at 2130-2190. A further breakdown on the daily chart would mean the structure has deteriorated, while recovery would take more time. A daily close back above 2190 would be a great buying opportunity.

See image 2: $BTC . BTC’s golden buying opportunity is at 72700. A break below that level would
ETH-1.26%
BTC-0.67%
What are we trading, what are we trading?
Are we in the meme agent archaeology phase now?
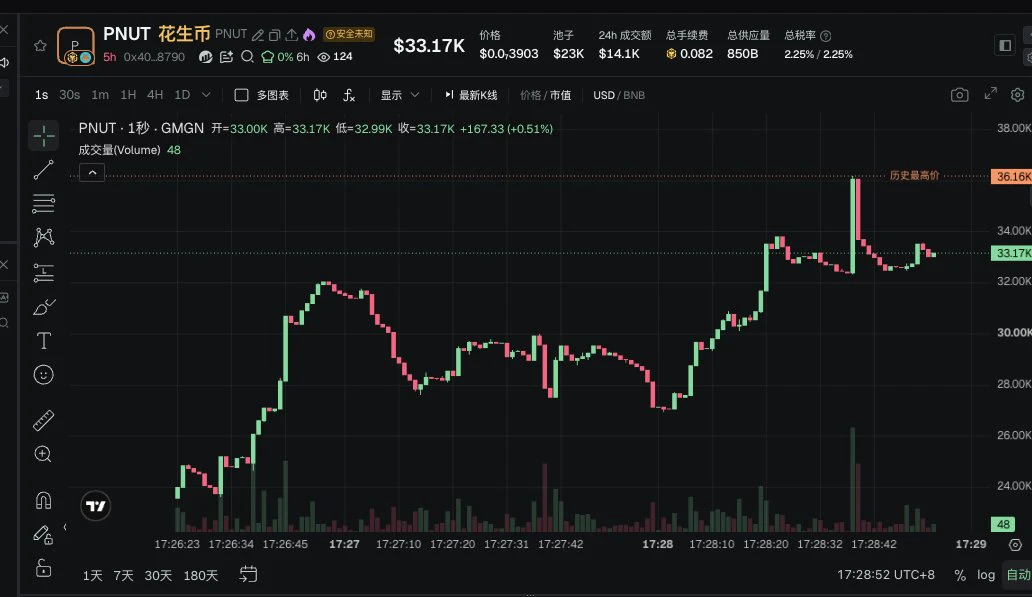
How come Neiro and PNUT have both shot up?
What are you guys going after next???
post-image
MEME-0.94%
NEIRO-1.64%
PNUT-1.27%
crypto news
live-cover
LIVE1,736
market update on gate
live-cover
LIVE2,362
Friends, if you’ve been thinking of trying spot trading on $BTC , check out the # Singles’ Day Shopping Festival.
New users who complete their first deposit and first trade, then take on the BTC spot task, have a chance to receive up to 888 USDT in futures bonuses.
Step 1: Make a net deposit of 100 USDT and complete your first spot trade in any one of XRP, TRX, ZEC, AVAX, or ONDO. Then check the BTC spot trading volume tiers in Step 2; meet the corresponding threshold to receive a reward.
BTC has been moving around 74k these past few days, ETF flows are still negative, and CPI is due tonight,
post-image
BTC-0.67%
XRP-1.15%
TRX+0.42%
ZEC+1.16%
AVAX-0.10%
🏆 Gate hits the global Top 3 — giveaway time! 🎁
Per DeFiLlama (Nov 9), Gate ranked 3rd globally among CEXs, with $40.66M in 24-hour net inflows.
Let's celebrate 💙
🎁 3 winners × 5 USDT
Join in 👇
✅ Follow @Gate_Livezh & @Gate__Live
❤️ Like + Repost
💬 What's a recent win you're proud of? Share it below! 🏆
📊 Source:
https://www.odaily.news/zh-CN/newsflash/532275
‍#GateLive #Gate
post-image
  • 41
  • 21
$BTC $ETH Today's setups for all three coins played out!

Bitcoin BTC: We anticipated a rejection near 75400, followed by a pullback after a push higher. Price met resistance at 75411 and moved lower, breaking through the first target and opening up further downside.
ETH: We positioned short in the 2140‑2160 resistance zone. Price surged to 2136, nearing the resistance band, then pulled back to a low of 2107, hitting the first target at 2110.
SOL: We looked for shorts in the 86.5‑88.5 zone. Price rose to 86.99, met resistance and moved lower, reaching a low of 85.47 and precisely hitting the f
BTC-0.65%
ETH-1.23%
  • 1
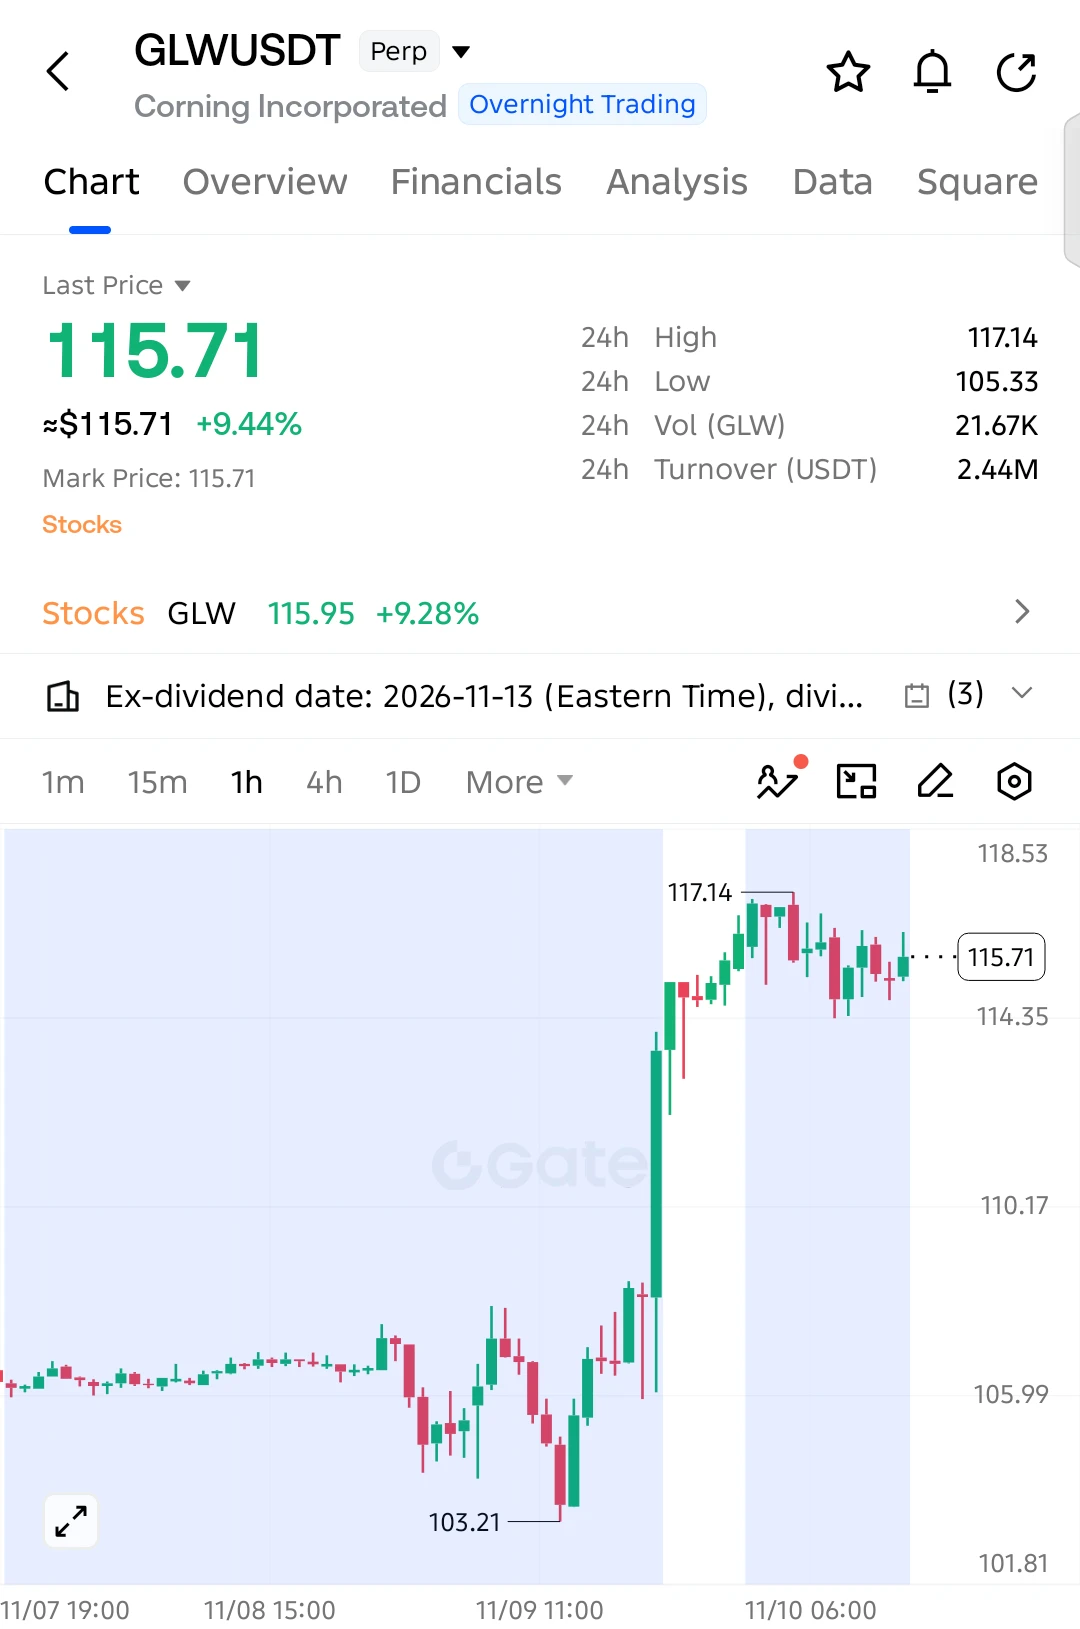
$GLW LONG SETUP — BULLS HOLDING STRONG!

$GLW is showing impressive strength after a powerful breakout. Price is consolidating near its recent highs, suggesting buyers are still in control.

Entry: 115.71
SL: 114.20

TP1: 116.50
TP2: 117.14
TP3: 118.50
Final Target: 120.00

The strong rally from 103.21 has pushed $GLW into a higher trading range. Buyers are defending the 114.35 support area, and a breakout above 117.14 could open the door for another bullish expansion.

Invalidation: Sustained breakdown below 114.20.

$GLW could be preparing for its next leg higher!
post-image
GLW-0.02%
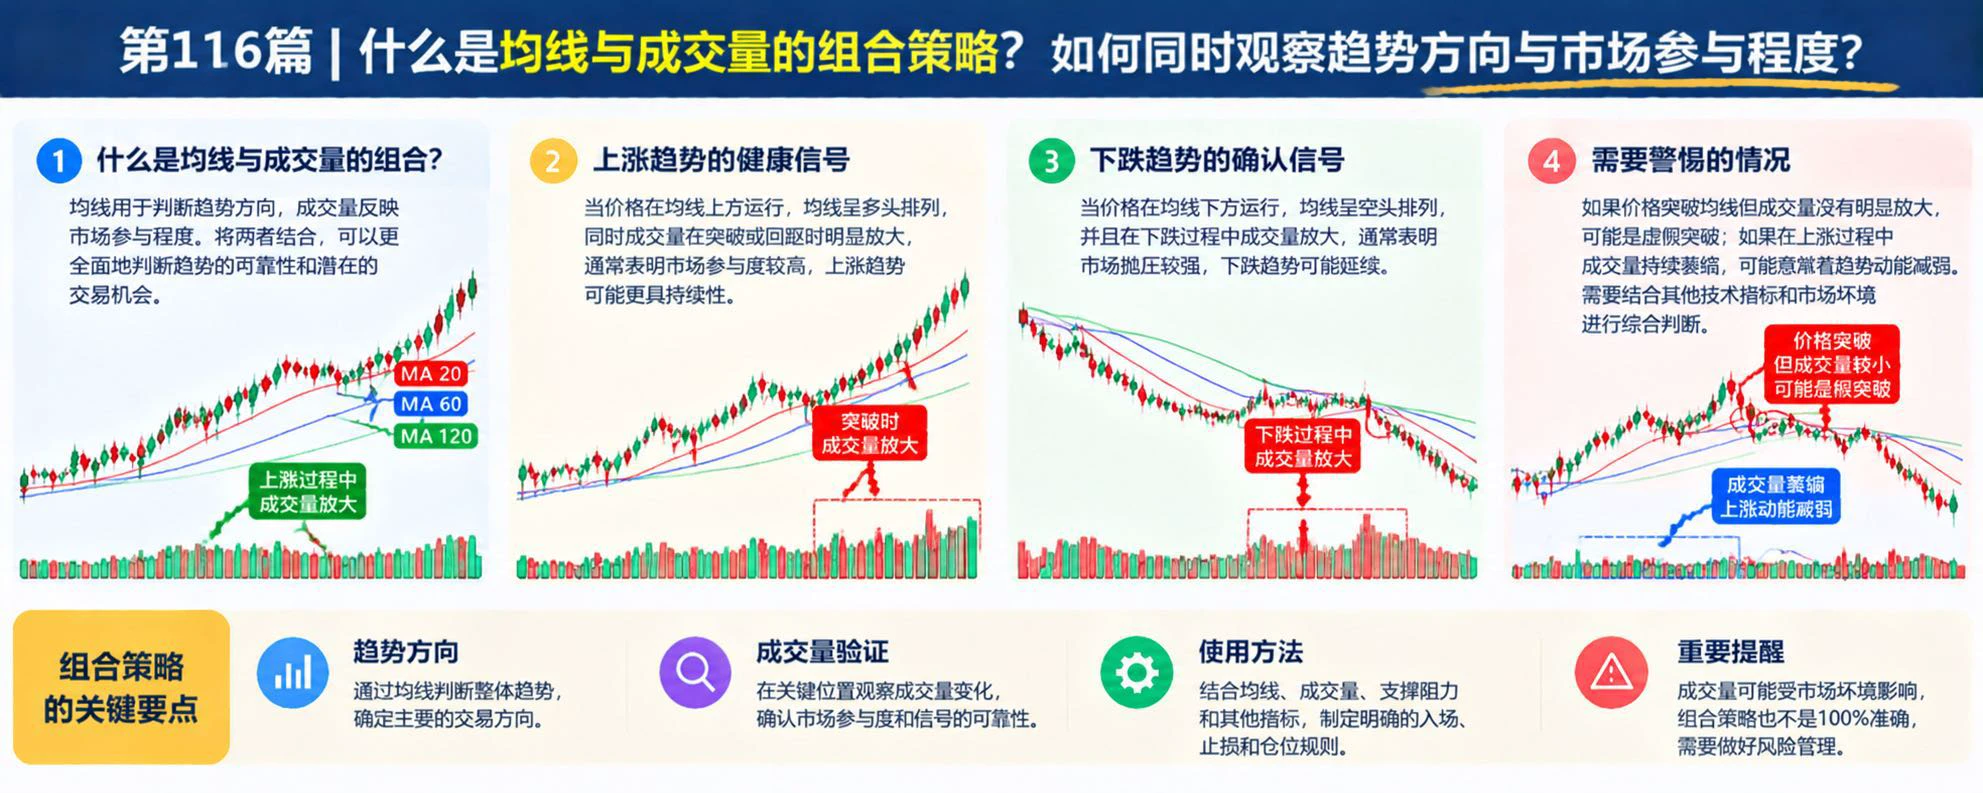
What Is Volume Analysis? Why Is Volume Worth Watching When Prices Rise?

In cryptocurrency trading, price tells us which direction the market is moving, while volume can help us gauge market participation. When BTC rises, if volume increases at the same time, it may mean more traders are participating in the rally; if the price keeps rising while volume gradually shrinks, it is worth watching whether the upward momentum is weakening.

First, what is volume analysis?

Volume analysis involves observing the number of trades or the value traded over a given period, alongside price movements, to a
post-image
BTC-0.67%
What Is an RSI and MACD Combination Strategy? How Can Different Indicators Confirm Each Other to Reduce Misjudgments from a Single Signal?

In cryptocurrency trading, using just one technical indicator can leave you vulnerable to interference from sideways markets or short-term volatility. RSI mainly reflects recent price momentum, while MACD helps track trend direction and changes in momentum. Combining the two lets you analyze the market from different perspectives, but it does not mean the signals will necessarily be more accurate.

First, what does each indicator show?

RSI is typically us
post-image
After this $BTC rebound ran into resistance, bears regained momentum. When signs of overhead resistance appeared, we followed the trend and opened short positions.

Entered near 74929.7, fully took profit at 74519.3
Captured 410.4 points
Realized +2,462.4 USDT, for a return of 54.77%.

From the rebound meeting resistance to the rapid drop, it all comes down to timing. Act when the market presents an opportunity, take profits once the target is reached, and don’t hold on blindly.

Reading the direction is a skill; protecting profits is what takes real discipline
#美国10月CPI即将公布
BTC-0.67%
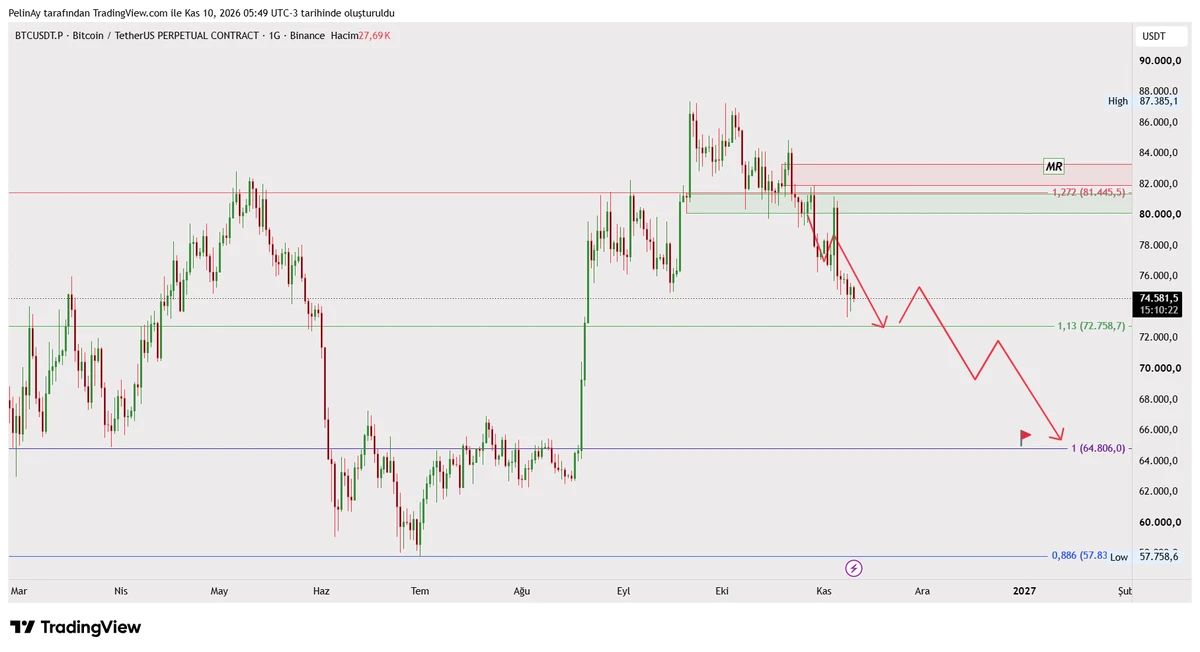
I haven't been wrong often in my #Bitcoin analyses so far. So it's worth following these analyses I share every week closely and saving them.
This week, it dropped to the $72K-#Bitcoin range you $74K pointed out. Next up is $64,800!
⚠️ This is not investment advice.
post-image
BTC-0.67%
Load More

Join 40 M users in our growing community

⚡️ Join 40 M users in the crypto craze discussion

💬 Engage with your favorite top creators

👍 See what interests you

Trending Topics

GateGlobalComplianceExpansion

167 Views199 Discussing

Gate continues to expand its global compliance footprint, now covering 81 regulated jurisdictions across Europe, North America, Asia, and Oceania. From MiCA and U.S. state-level MTLs to Japan’s FSA, Dubai, and Australia-related regulatory approvals, global exchanges are entering a new stage of compliance competition. Do you think regulatory strength will become as important as products and liquidity for exchanges in the future?

USCPIDataIncoming

55.02k Views2.29k Discussing

USIranTalksShowNewProgress

10.06k Views1.29k Discussing

View More