
Share your thoughts
placeholder
Article
On September 2, I took a heavy position in 30 shares of SanDisk. I made 900 but didn’t sell, and ended up selling for a profit of only a few dozen. There was nothing I could do since it didn’t surge. Yesterday I placed orders for three or four shares, but it didn’t wick down even once to let me buy in. Well, today it rose to over 1,700, and I missed it.
I’ve found that once you figure out U.S. stocks, they’re more fun to trade than BTC and ETH: the volatility is higher, making them suitable for swing trading; you can also easily get trapped, and they’re suitable for studying cycles and sectors
post-image
SNDK+11.88%
$1000 to $100,000 Crypto Trade Challenge Today
live-cover
LIVE453
GN CT 🌃
It’s been a good day.
Hope you all have an amazing weekend.
Time to rest and enjoy your night.
post-image
This trend is so obvious I don’t even need to think—the account is dancing on its own. When I opened the chart this morning, I saw $CYS open higher again and then fall, with a weak rebound. Every push upward was just short of breaking through, and the resistance above was glaringly clear. I followed the rhythm and entered a short at 0.4651; the price has now returned to 0.238, with a return of +485.13%. Honestly, not having to stay up late watching the chart this time and still getting the rhythm right is better than anything. But the more you make, the calmer you need to stay. I just closed
post-image
CYS-11.73%
XRP-4.39%
LAB+0.66%
I had just switched the app to the background, and it suddenly shot up—are you playing hide-and-seek with me? During that repeated intraday choppiness, while everyone was still watching from the sidelines, I noticed buying pressure quietly strengthening, with the volume-price action looking quite interesting.
I flagged $LIT right on the pullback, with an entry price of 3.753. It’s now at 4.86, and the account is showing +1418.94%. The market is waited out, and profits are held onto. In the time it takes to finish a meal, it got the whole job done.
Those who got on board this move should have s
post-image
LIT+9.10%
XRP-4.39%
SNDK+11.75%
Why is everyone still long $WLD /USDT when the 4h structure just whispered 'shorts only'?

$WLD /USDT - SHORT

Trade Plan:
Entry: 0.374 – 0.378
SL: 0.391
TP1: 0.365
TP2: 0.358
TP3: 0.347

Why this setup?
- 1D trend is *range*, not bullish—so the breakout narrative is dead.
- RSI 15m at 39.19 shows momentum is already rolling over, not oversold enough to bounce.
- Entry ref 0.376 sits right under invalidation 0.384—that’s a tight, high-reward trap zone.
- ATR 1h 0.00612 means the move to TP1 0.365 is ~1.8x the daily noise—clean path, no chop.
- Why now? Because 0.374-0.378 is the las
WLD-4.42%
My hand trembled when setting the stop-loss a few days ago, only to find this morning that such filial devotion had been unnecessary. When the screen was all green, everyone else was running, but I saw sideways trading at the bottom and strengthening buying pressure, so I called a long on $UAI , entering at 0.33539. It is now at 0.49581, with a return of +2315.16%. The timing was spot on. Don’t let profits inflate your ego, and don’t despair over pullbacks. Take 80% of the profits first, and protect the remaining 20%—don’t get greedy for the last bite. There will be more opportunities ahead, b
post-image
UAI+44.28%
SNDK+11.75%
XRP-4.39%
#Gate事件合约晒单挑战
BIS AND XRPL: CAN BLOCKCHAIN FINGERPRINTS STRENGTHEN OFFICIAL DATA VERIFICATION?
The Bank for International Settlements (BIS) has proposed an interesting proof-of-concept for recording official statistics on the XRP Ledger (XRPL). According to a working paper released on September 4, the proposed method would record encrypted fingerprints of official statistics on XRPL, creating a way to verify whether published datasets remain authentic and unchanged.
HOW THE PROPOSED SYSTEM WORKS
The concept is relatively simple: instead of putting the actual statistical dataset on-chain, the
post-image
XRP-4.46%
Everyone’s staring at ADA’s breakout—but the 4h tape is quietly screaming lower.

$ADA /USDT - SHORT

Trade Plan:
Entry: 0.2119 – 0.2137
SL: 0.2212
TP1: 0.2065
TP2: 0.2023
TP3: 0.1960

Why this setup?
Why now? The daily is stuck in a range, yet the 4h structure is armed for a SHORT at 0.2128 with only 55% conviction—meaning the path of least resistance is down, not up.
- RSI on the 15m is already at 42.5, losing momentum before any bounce.
- ATR on the 1h is tight (0.0035), so the drop to TP1 (0.2065) is a clean 3% ride if 0.2095 breaks.
- If bulls can’t reclaim 0.2137 fast, this is a
ADA-3.66%
🚨 Big moves in sports and crypto! Ripple just inked a $5M deal to showcase the XRP logo right on the field at Gators Stadium. 🏈 How will this impact $XRP 's visibility? #SportsSponsorship
post-image
XRP-4.46%
🔹Oil Rally Pauses, U.S. Stocks Snap a Three-Day Losing Streak! I
live-cover
LIVE1,922
$UAI Signal】Long | 1H Pullback Support
$UAI 1H surged and pulled back, current price 0.4714, RSI 66.29, order book Bid/Ask 1.25. After testing 0.5, it returned below the upper Bollinger Band at 0.4742. EMA20 0.4062, EMA50 0.4027, with the moving averages diverging upward. Recent candlestick volume has shrunk noticeably, with a buy ratio of 0.50. MACD histogram at 0.0142 shows converging positive bars, and the funding rate is 0.0343%, with OI stable.
🎯Direction: Long
⚡Entry/Limit Order: 0.470693 - 0.471400
🛑Stop Loss: 0.466686
🚀Target 1: 0.478471
🚀Target 2: 0.482007
🛡️Trade Management: R
post-image
UAI+44.28%
#Gate用户突破6000万
THE FIRST STEP WAS ONLY 500U
18 months ago, I did not understand crypto. I barely understood what “U” meant, and the idea of buying my first 500U felt much more serious than the amount itself. A friend convinced me to register on Gate, put the phone in my hand, and basically said, “You do it yourself.” I opened C2C, selected a seller, entered the amount and pressed the button. Then came the waiting. I checked the screen again and again, wondering whether the money would arrive safely. When the payment notification finally appeared, I felt like I had just completed an exam I had
post-image
BTC-2.46%
When the tide rises, the returning ripples will come; only when the waves are calm do you recognize the ferryman✨
$BTC $ETH
Many of you who trade have probably experienced such agonizing moments.
You identify a support level and safely enter a long position, convinced that the market is about to move higher.
But the market shows no mercy. A sell-off comes without warning, prices plunge in a straight line, and your position is suddenly trapped.
Before entering, you have carefully thought through the price level, logic, and timing. But no one can predict the moves of large capital in advance, a
post-image
BTC-2.39%
ETH-2.37%
【$Lobster Signal】Long | 1H Band Hugging + MACD Expansion Across Both Timeframes
$Lobster RSI 1H 86.14, current price 0.093252 hugging the 1H Bollinger upper band. The 16:00 candle touched 0.1027 before closing back at 0.0899, with overhead supply not yet cleared. The 17:00 and 18:00 candles both closed above 0.0930, with buyers retaking control. The MACD 1H histogram is 0.0017 and the 4H histogram is 0.0015, expanding in sync across both timeframes. The funding rate is 0.0777%, raising the cost of long positions. Sell orders slightly outweigh buy orders in the order book, but the price is hold
post-image
龙虾+19.27%
BTC-2.46%
ETH-2.43%
SOL-3.39%
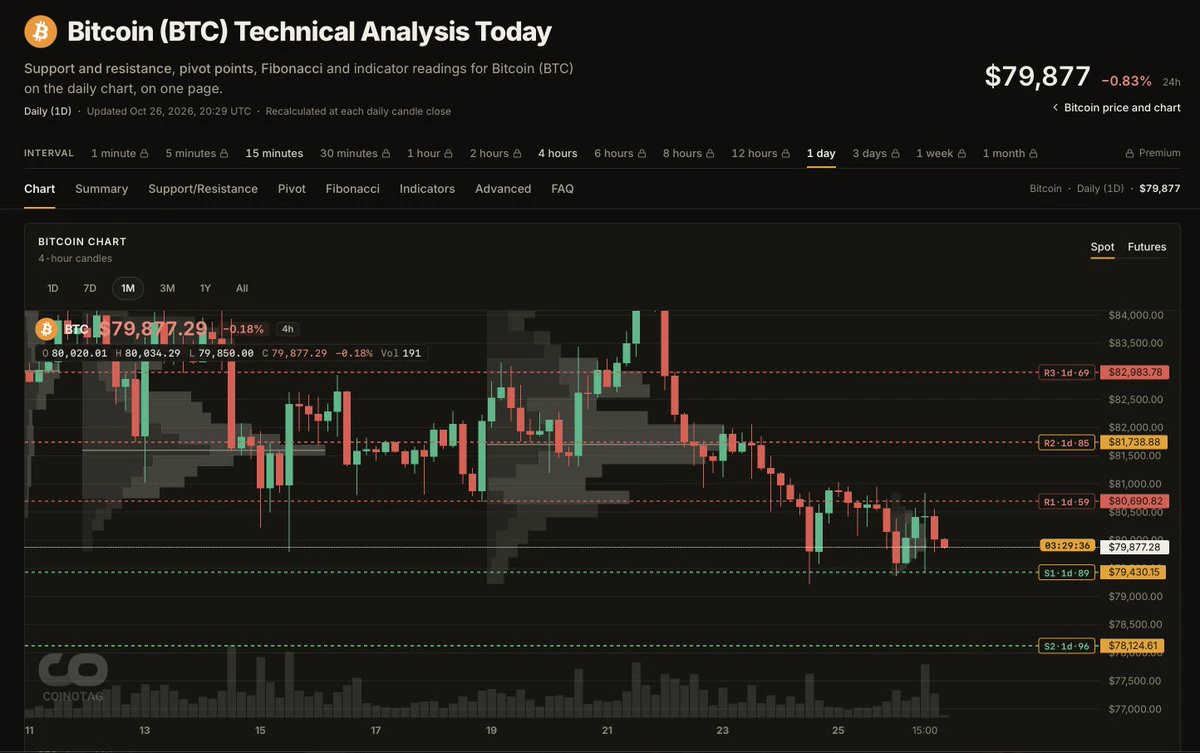
BTC Technical Outlook: Bitcoin Holds Above $79K as Bulls Target $82K+
Bitcoin is trading around $79.7K, maintaining its bullish recovery after breaking above the previous consolidation range. BTC is now approaching a major resistance cluster around $80.6K–$82.9K, where sellers previously stepped in.
📈 EMA Structure
- 20 EMA: $75,678
- 50 EMA: $71,043
- 100 EMA: $69,630
- 200 EMA: $72,491
BTC is trading above all major EMAs, confirming a strong bullish medium-term structure. The 20 EMA at $75.7K is the key dynamic support.
📐 Fibonacci Levels
- 0.236: $75,045.77
- 0.382: $82,919.00
- 0.500: $8
BTC-2.46%
Everyone’s bragging about ZEC’s 1D trend—but my 4h chart just whispered a secret that 84% of traders missed.

$ZEC /USDT - SHORT

Trade Plan:
Entry: 1018.21 – 1032.15
SL: 1112.14
TP1: 959.96
TP2: 916.48
TP3: 851.26

Why this setup?
- The daily trend says “bullish,” yet the 4h setup is screaming SHORT with 84% confidence.
- Price is stalling near 1025.18, right under the 1h ATR of 27.87—a classic squeeze zone.
- RSI on the 15m (60.45) shows fading momentum, not a breakout spark.
- Why now? The “Waiting” status means the trap is set: a drop to TP1 (959.96) is a 6.4% move before the dail
ZEC+7.15%
📊 Bitcoin Is Pulling Capital Back Into Its Orbit
August’s crypto rebound did more than lift prices — it highlighted a growing rotation toward BTC-linked assets.
Bitcoin miners are once again trading like leveraged plays on Bitcoin, while companies with significant BTC and ETH exposure are attracting renewed attention.
Meanwhile, AI tokens are losing some of the spotlight as traders rotate toward assets with more direct exposure to crypto’s core market drivers.
🔄 What does this BTC rotation mean?
If capital continues moving toward Bitcoin, the impact could extend beyond BTC itself:
• BTC beco
post-image
BTC-2.46%
ETH-2.43%
  • 7
  • 1
$USELESS Who could handle such a huge rise in just one day? Luckily, I had already been bullish based on all kinds of news, so I sensed it would really go up!$AKE #BTC收复8万美元
USELESS+31.82%
AKE-22.08%
U.S. Treasury yields are too high right now; interest rates will most likely be cut next year, and 2027 will be a super bull market. $SNDK
post-image
SNDK+11.88%
  • 1
Load More

Join 40 M users in our growing community

⚡️ Join 40 M users in the crypto craze discussion

💬 Engage with your favorite top creators

👍 See what interests you

View More