
Square
Following
Hot
News
Profile
Share your thoughts
placeholder
Article
Crypto Trade Today
live-cover
LIVE893
#WCTCS9
🔥 Gate WCTC S9: The Global Trading Competition Is Here! 🌍🚀
The world of trading is getting more exciting with #GateWCTCS9GlobalTradingCompetition, bringing traders together for an incredible global trading experience! 💎📈
Gate WCTC Season 9 is more than just a competition. It is an opportunity for traders to challenge themselves, connect with a global community, improve their trading discipline, and compete across multiple markets. With a total prize pool of up to 6,000,000 USDT, this season brings a new level of excitement to the trading world. 🏆🔥
💰 Massive Rewards and Global
Trenches
AGT
A
bade
b
AGT
0x5d...e274
Market Cap
$.
Change
.
24h Vol
$.
Holders
.
CNPY
C
bade
b
CNPY
0xc6...ddd2
Market Cap
$.
Change
.
24h Vol
$.
Holders
.
Q
Q
bade
b
Q
0xc0...0589
Market Cap
$.
Change
.
24h Vol
$.
Holders
.
Gato
G
bade
b
Gato
55A3...pump
Market Cap
$.
Change
.
24h Vol
$.
Holders
.
DOPE
D
bade
b
DOPE
0xf9...8899
Market Cap
$.
Change
.
24h Vol
$.
Holders
.
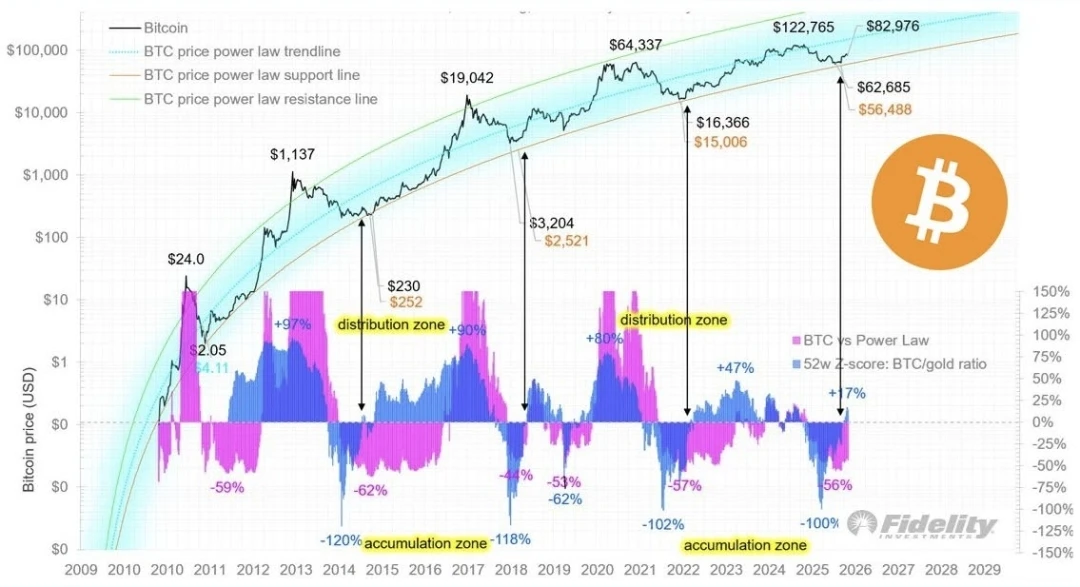
$BTC BOOM💣It's about to explode soon; the big player is starting to accumulate, forming a daily double bottom, with a large pool of liquidity above🤩
Long, long, long🔥🔥TP1: 82500 TP2: 84000 TP3: 87000-90000 SL: 78200$AG $ETH
post-image
BTC+0.17%
AG-0.65%
ETH-0.61%
Jupiter, the DEX aggregator on Solana, and the staking structure of its token $JUP deserve a closer look.
More than 1.1 billion tokens are currently staked, accounting for 33.3% of the circulating supply, with 357,000 participants and an 18.12% annualized yield; protocol buybacks have removed 175 million tokens from circulation, bringing the total supply no longer involved in everyday trading to 38.5%. These are hard on-chain numbers, not expectations being talked up. To save you the hassle of switching around to find it, click the tag below to go straight to the full trading page.
Personal vi
post-image
SOL-0.87%
JUP-3.86%
OP-7.42%
ORDI-3.78%
‍#每周来晒 #WCTCS9
Preview of Next Week’s Major Financial Events
2026-10-19 (Monday)
10:00 China’s Q3 GDP, September industrial value added, fixed-asset investment, and total retail sales of consumer goods
22:00 US October NAHB Housing Market Index
2026-10-20 (Tuesday)
09:15 China’s October LPR quotation 17:00 Eurozone October ZEW Economic Sentiment Index 20:30 US September housing starts and building permits
22:00 US September pending home sales index MoM
NVIDIA GTC conference (10.20–10.22)
2026-10-21 (Wednesday)
16:00 UK September CPI YoY
22:30 US EIA crude oil inventories for the week ending O
post-image
NVDA-1.42%
TSLA-2.17%
SPGI+1.13%
  • 4
#每周来晒 #USSeptemberPPIDataRelease
#USSeptemberPPIBeatsExpectations
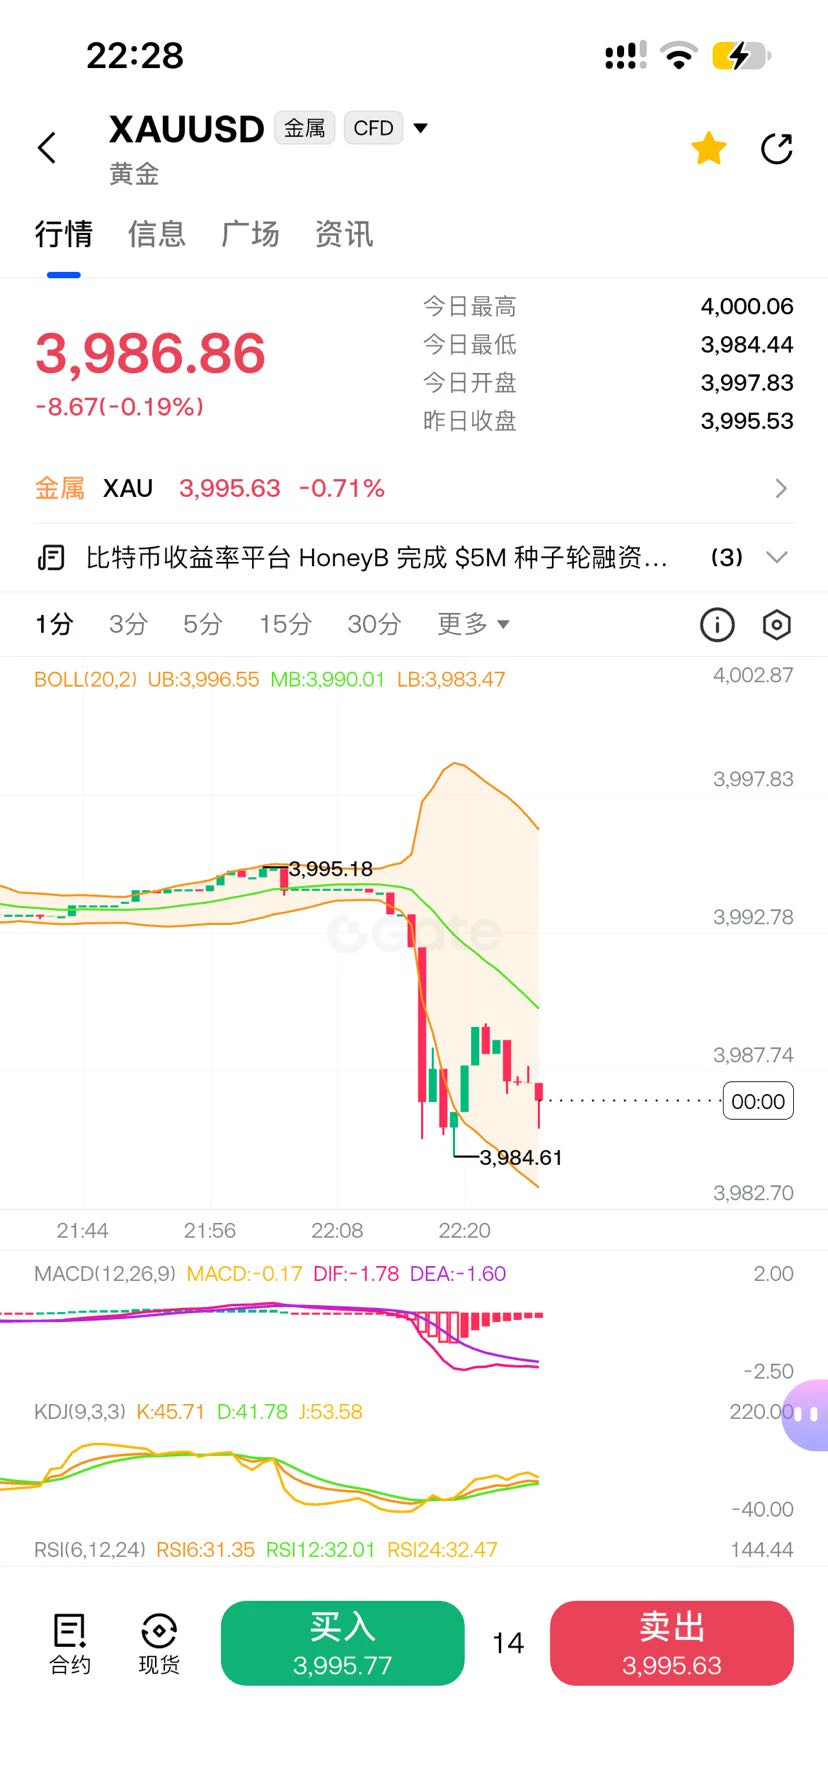
September PPI beat expectations by a wide margin, and the market's reaction tells a more interesting story than the number itself. The report came out at 20:30 Beijing time on Thursday, October 15. Producer prices rose 1.3% on the month against about 0.6% expected, and the annual rate hit 6.3% against a consensus of 5.5%, with energy up 10.8%. That makes the monthly gain more than double the forecast, so the answer to whether it exceeded expectations is a clear yes.
Inflationary pressure on the production side is strong, and i
CME+1.49%
US500-1.06%
BTC+0.17%
🔥 $ENSO
is facing strong bearish pressure after breaking below a key support level! The price has fallen more than 7% in the past 24 hours, and consecutive red candles indicate strong selling momentum. If sellers continue to dominate and the current support level gives way, ENSO may continue to fall toward lower targets. 📉Take profit: 0.2181Stop loss: 0.8137Short $ENSO 👇
post-image
ENSO-6.28%
I think the current crypto market is in the early recovery phase after the cycle low, currently pulling back and waiting for secondary confirmation:
• BTC at around $81,500, down about 35% from its October 2025 ATH of $126,000
• This cycle’s low was around $58,000 in June-July 2026 (a drawdown of about 54%, relatively shallow historically)
• Q3 total market cap rose 39.6% to nearly $3T, with ETFs returning to net inflows
• Fear & Greed Index at around 53 (neutral)
• BTC dominance at around 59-60%
Institutional consensus: the bear market is over, and the market is transitioning from acc
post-image
ETH-0.61%
BTC+0.17%
This chart pattern suggests a potential correction toward the 65,000–69,000 range, as it appears to be completing a 5-wave sequence. However, this chart setup could be deceptive; it is possible that the current structure is actually forming a 12345 sequence within a larger wave 3. This is why the price is currently stalling in this area, without yet establishing a clear direction. $BTC ‌
post-image
BTC+0.17%
btc market
live-cover
LIVE240
$CXMT When will the whales do this again? I regret not buying more
post-image
CXMT-1.55%
🌈 Gate Live Livestreaming Inspiration - October 18
Trending Topics:
🔹 Vitalik compares BTC mining and AI inference costs: electricity accounts for nearly half the cost of the former, while the latter relies more on capital expenditure for computing power
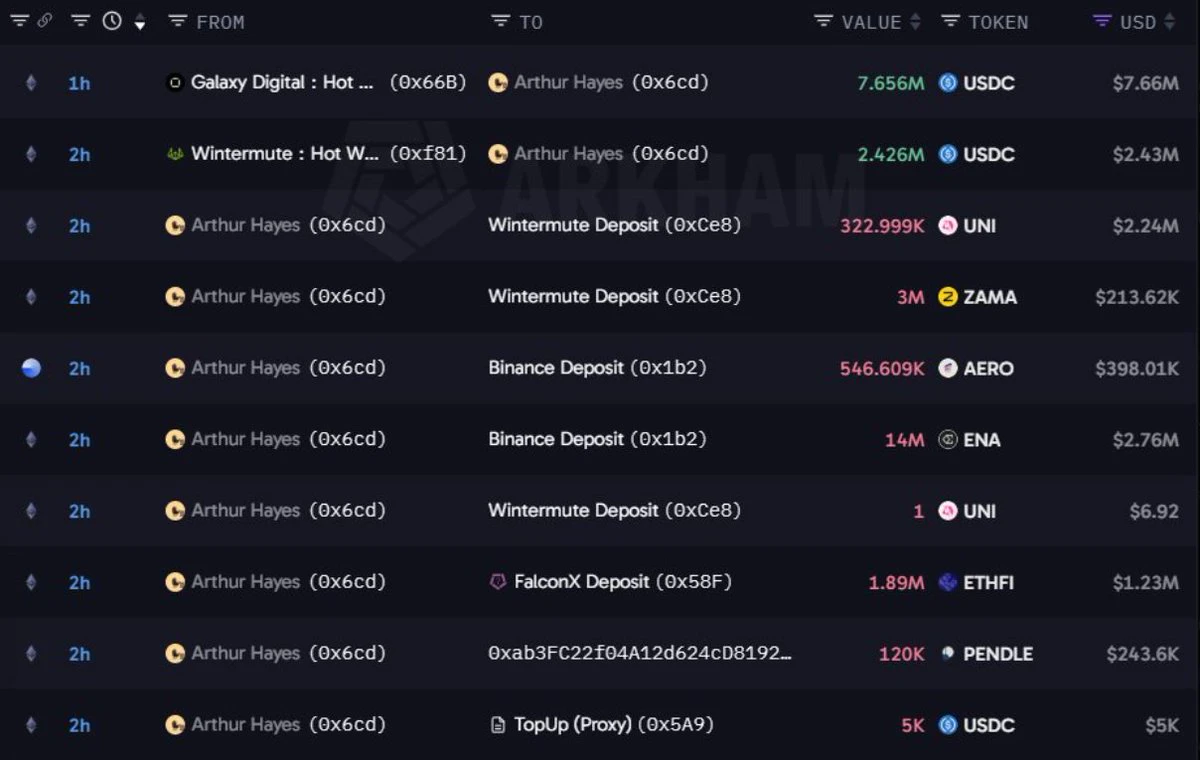
🔹 Arthur Hayes: The so-called quantum threat to crypto is “nonsense”; users only need to pay attention to wallet management
🔹 A new angle on AI anti-fraud: get scammed on purpose to gather intelligence on scammers for regulators to crack down on them
🔹 Iranian armed forces open fire to intercept vessels making “unauthorized” passages thro
post-image
BTC+0.17%
  • 9
  • 3
The KOSPI is already down 38% from its peak
If AI actually turns out to be a bubble and it pops, does Korea get wiped off the face of the Earth?
Does Citadel own the entire country at that point or what?
post-image
Don't fall into the trap of self-justification,
Regularly ask yourself about your core position: if you didn't hold it today, knowing the information in front of you, would you still be willing to buy it?
post-image
Good morning from Thailand!!!
post-image
Can stablecoins also have a directional bias? Bottom line: yes, but only for mean reversion within an extremely narrow range, and $U currently has a clear edge in relative sideways strength.
Sector comparison: $SOL is trading at 103.48, with MA5 below MA20, RSI at 44.7, bearish MACD, a funding rate of -0.0022%, and a range of about 3.89% over 30 candles; $APT is trading at 0.7936, down 5.56% over 24h, with RSI at just 37.2, bearish MACD, and a range of about 10.99%. Both are below their moving averages, with weak momentum. By contrast, $U is trading at 1.0007, with MA5=1.00064 above MA20=1.
post-image
SOL-0.87%
APT-5.75%
  • 2
Positioned a day in advance, the market played out as expected✅
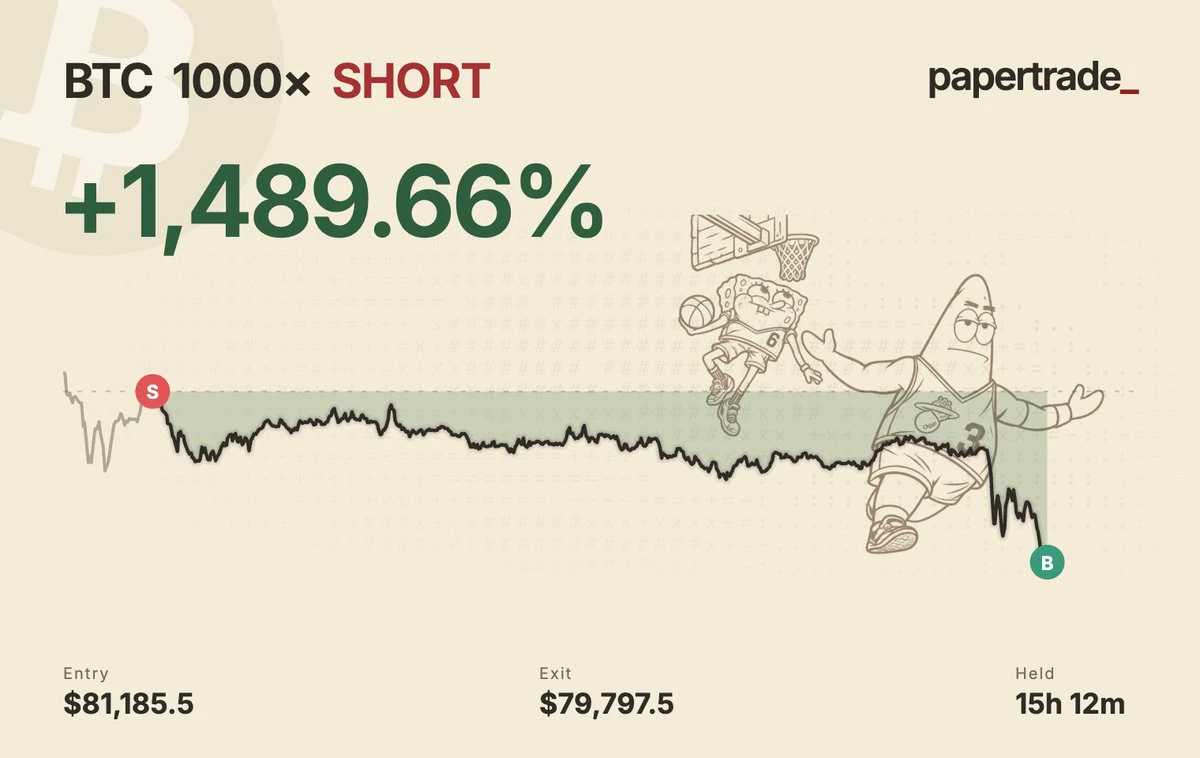
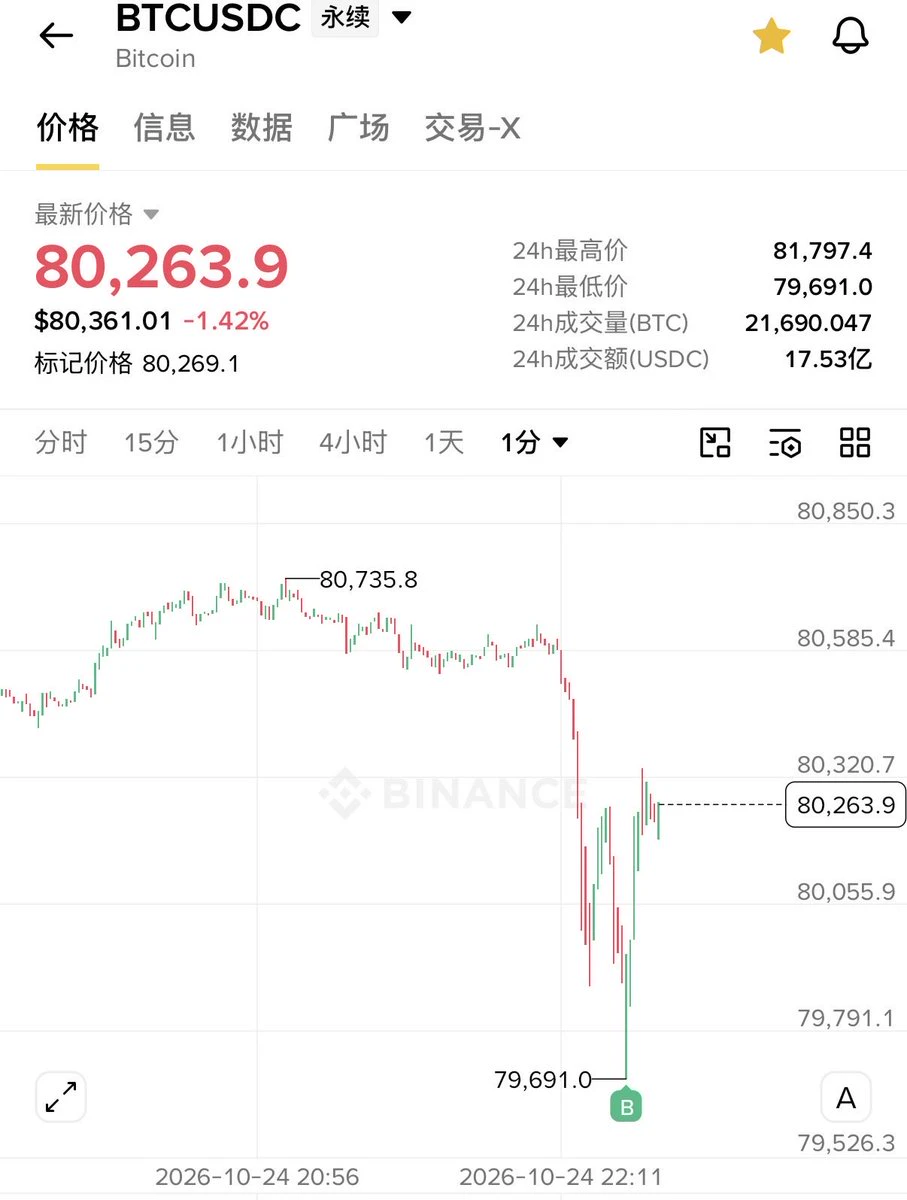
Yesterday morning, I publicly shared a strategy calling for shorting BTC's rebound in the 81800-82000 range, targeting 80800-80500.
The market precisely touched the entry zone before coming under pressure and moving lower, bottoming at 80754 and perfectly reaching the second take-profit zone. The short position was successfully closed,
All forecasts played out exactly as expected. The trend doesn't lie; levels were published in advance, no hindsight calls—results speak for themselves.$BTC ‌#美国9月PPI大超预期
YangGuangbit
Yang Guang Bit | October 17 $BTC — Oil prices surge as tech stocks plunge; favor shorting rallies in line with the trend
【Today's Plan】
Entry: Place short positions on a rebound into the 81,800–82,000 range
Stop-loss: Above 82,300
Take-profit targets:
First target: 81,200–81,000
Second target: 80,800–80,500
【Key Takeaways】
BTC turned lower from last night's rebound high of 82,900, pressured by a surge in international oil prices and a sharp drop in U.S. tech stocks. It fell below 81,000 late at night and is currently trading around 81,520. The 4-hour moving averages are fully aligned bearishly, with price below all of them; the weak trend remains intact. On the news front, Trump said Iran's nuclear facilities could be targeted, while the U.S. and Israel held secret talks on strike plans; Brent crude surged to $110, stoking risk aversion. Fed Chair Warsh said he would not prejudge the rate decision, and expectations of an October rate hike fell below 15%. ETF net outflows on the on-chain CPI day exceeded 3,100 BTC, as institutional capital remained cautious. Weekend liquidity is thin. The intraday plan is to favor shorting rallies, with light short-term longs at support; avoid chasing one-way moves and stay aligned with the trend throughout. No trend-driven crash is expected.
$BTC ‌#比特币短线站上8.2万美元
repost-content-media
BTC+0.13%
#Aria$Aria is holding well
Given earlier
post-image
ARIA+0.00%
#美股存储板块跌幅扩大
The core question is whether this represents a healthy correction following a rally driven by artificial intelligence (AI), or the beginning of a deeper repricing process within the storage sector. Rather than buying simply because prices have fallen, it would be more prudent to focus on earnings expectations, memory pricing, and whether each company can maintain its profit margins.
My perspectives on storage sector stocks:
* Micron (MU): Monitor demand for DRAM and HBM, memory growth linked to AI, and gross profit margin forecasts. Strong AI demand could bolster earnings, though
post-image
ybaser
#美股存储板块跌幅扩大
The core question is whether this represents a healthy correction following a rally driven by artificial intelligence (AI), or the beginning of a deeper repricing process within the storage sector. Rather than buying simply because prices have fallen, it would be more prudent to focus on earnings expectations, memory pricing, and whether each company can maintain its profit margins.
My perspectives on storage sector stocks:
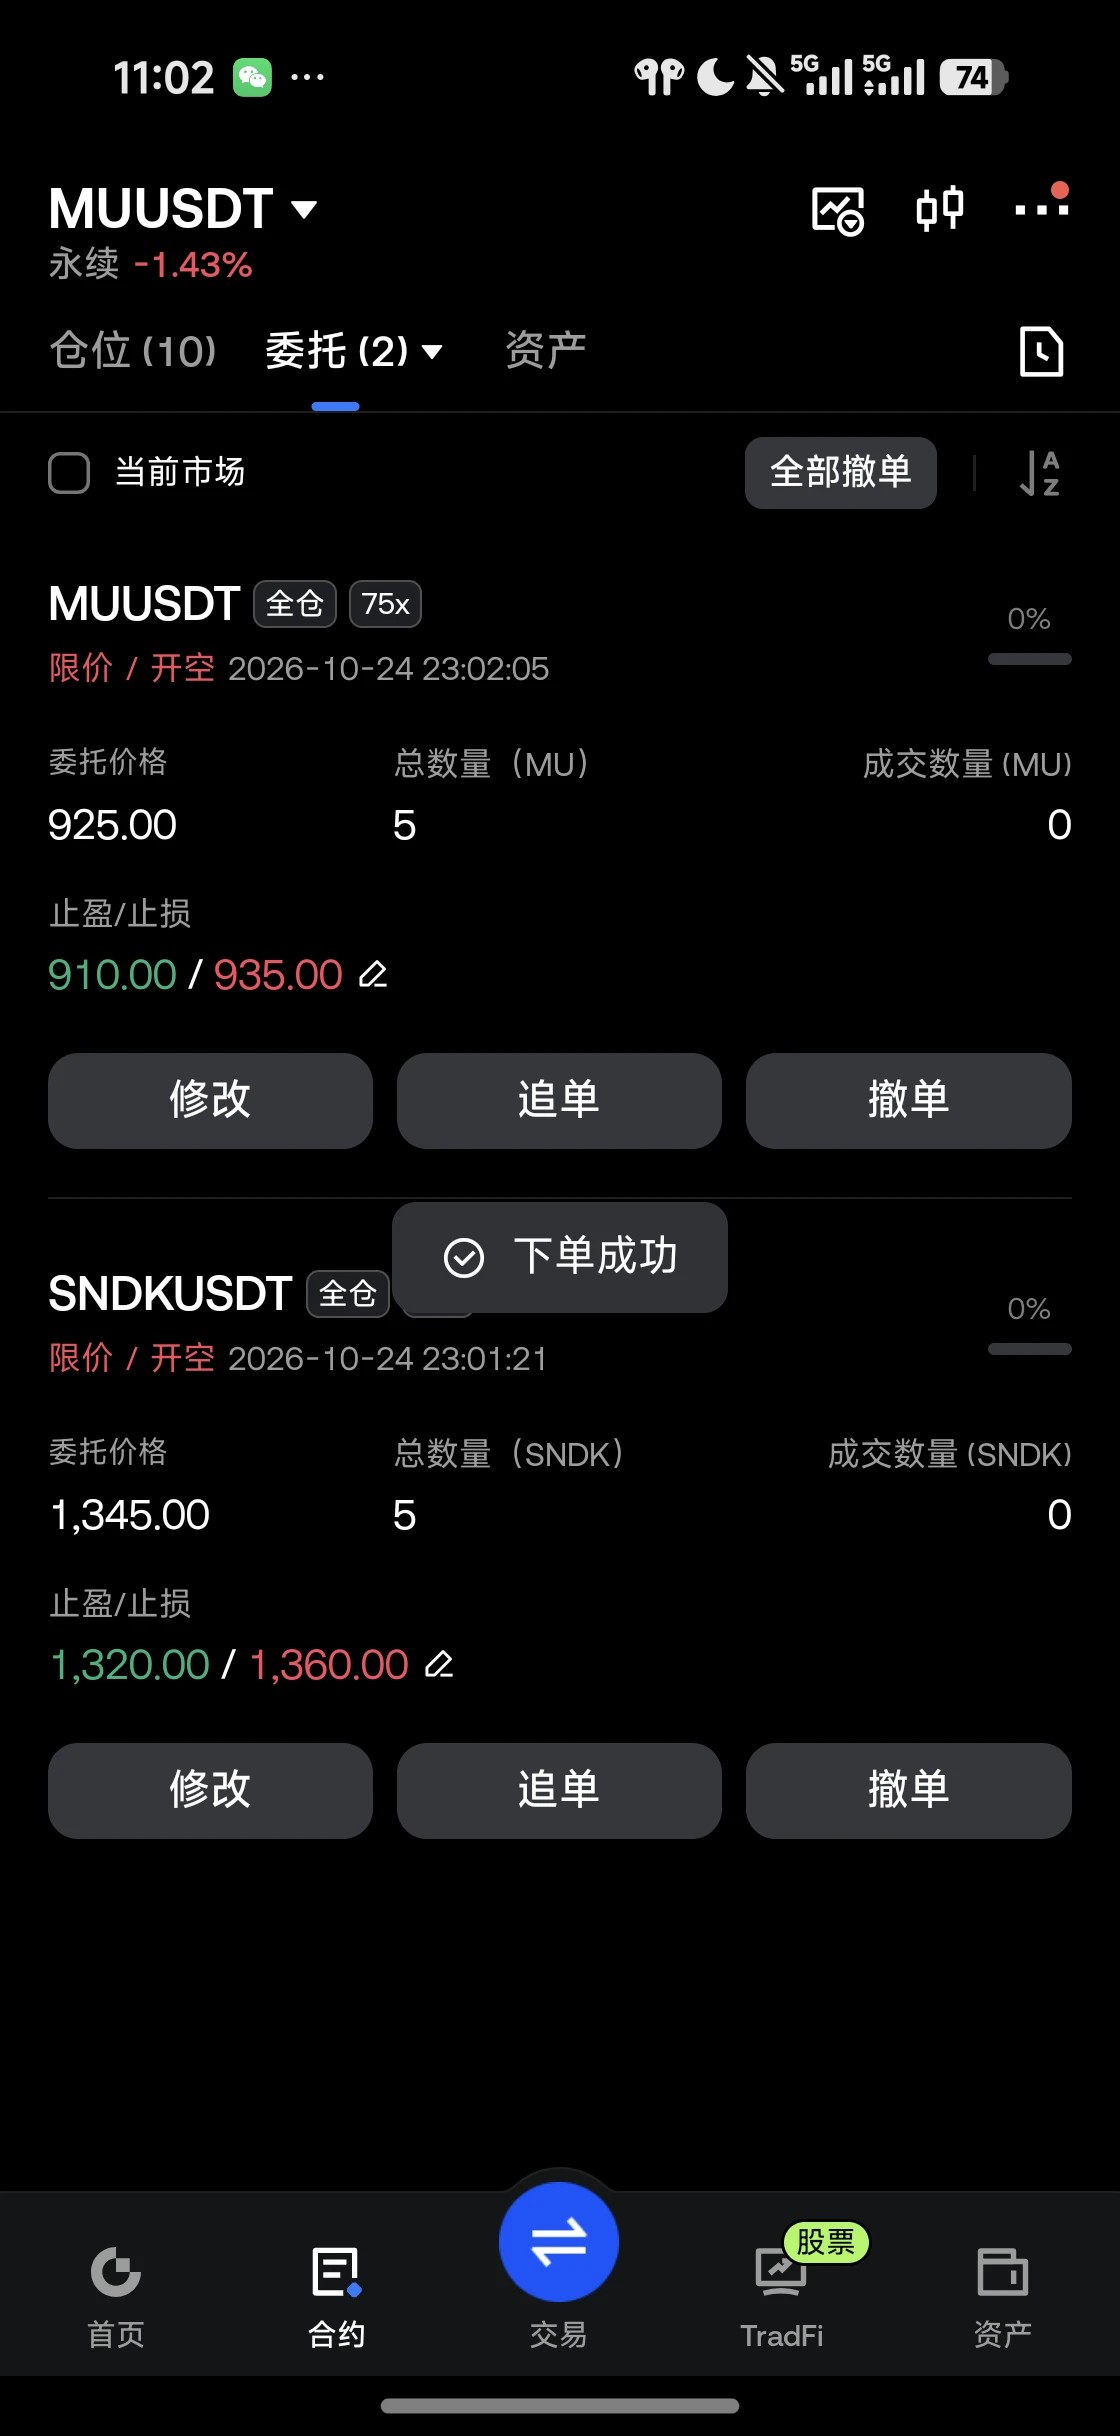
* Micron (MU): Monitor demand for DRAM and HBM, memory growth linked to AI, and gross profit margin forecasts. Strong AI demand could bolster earnings, though these expectations may already be priced into the stock.
* SanDisk (SNDK): Focus on NAND flash pricing, demand for enterprise SSDs, and the sustainability of any earnings recovery. NAND supply and price cycles can make this stock particularly volatile.
* Western Digital (WDC): Evaluate "nearline" (high-capacity/accessible) HDD demand from AI data centers, cloud computing expenditures, and free cash flow. The factors influencing HDD demand differ from those affecting NAND and DRAM.
* Seagate (STX): As data center storage requirements grow, keep an eye on demand for high-capacity drives, pricing power, and profit margins.
* Track NAND market conditions, enterprise SSD adoption rates, and the company's valuation relative to earnings expectations.
What signs might justify rebuilding a position? I would look at the following three points:
* Stabilization of fundamental indicators: A halt in the deterioration of memory and NAND prices, company forecasts, and earnings estimates.
* Confirmation through price action: Stocks forming higher lows and reclaiming key moving averages, accompanied by stronger trading volume.
* Attractive valuation: Expected earnings growth that justifies the current price, even under less optimistic scenarios.
A decline in a stock price is not, by itself, a buy signal. If earnings estimates are falling faster than the stock price, the valuation may not have actually become cheaper.
Rather than buying the entire storage sector indiscriminately, I prefer to differentiate between individual companies. While AI demand serves as a long-term tailwind, memory, NAND flash, and hard disk drives each have their own unique supply cycles, competitive pressures, and profit margins.
An important distinction: A pullback driven by profit-taking is fundamentally different from one caused by weak forward guidance or falling memory prices. The latter scenario warrants a much more cautious approach. Which of these stocks—MU, SNDK, WDC, or STX—are you following most closely? I can help you compare their valuations, earnings outlooks, technical levels, and the potential factors that could support a recovery.
$MU ‌$SNDK ‌$WDC ‌$STX ‌
repost-content-media
MU-5.66%
SNDK-6.90%
  • 10
  • 1
Load More

Join 40 M users in our growing community

⚡️ Join 40 M users in the crypto craze discussion

💬 Engage with your favorite top creators

👍 See what interests you

Trending Topics

USSeptemberPPIBeatsExpectations

91.35k Views1.93k Discussing

US September PPI came in at 6.3% YoY, well above the 5.3% market expectation, pointing to renewed producer-side inflation pressure. Weekly jobless claims were 199K, broadly in line with forecasts. Could hotter inflation further reduce room for rate cuts, and what does it mean for $BTC, US stocks, and gold?

GateWCTCS9GlobalTradingCompetition

37.87k Views6.7k Discussing

GateBTCAndETHFuturesVolumeRanksTop3

53.8k Views1.82k Discussing

View More