Square
Following
Hot
News
Notifications
Profile
Share your thoughts
placeholder
Article
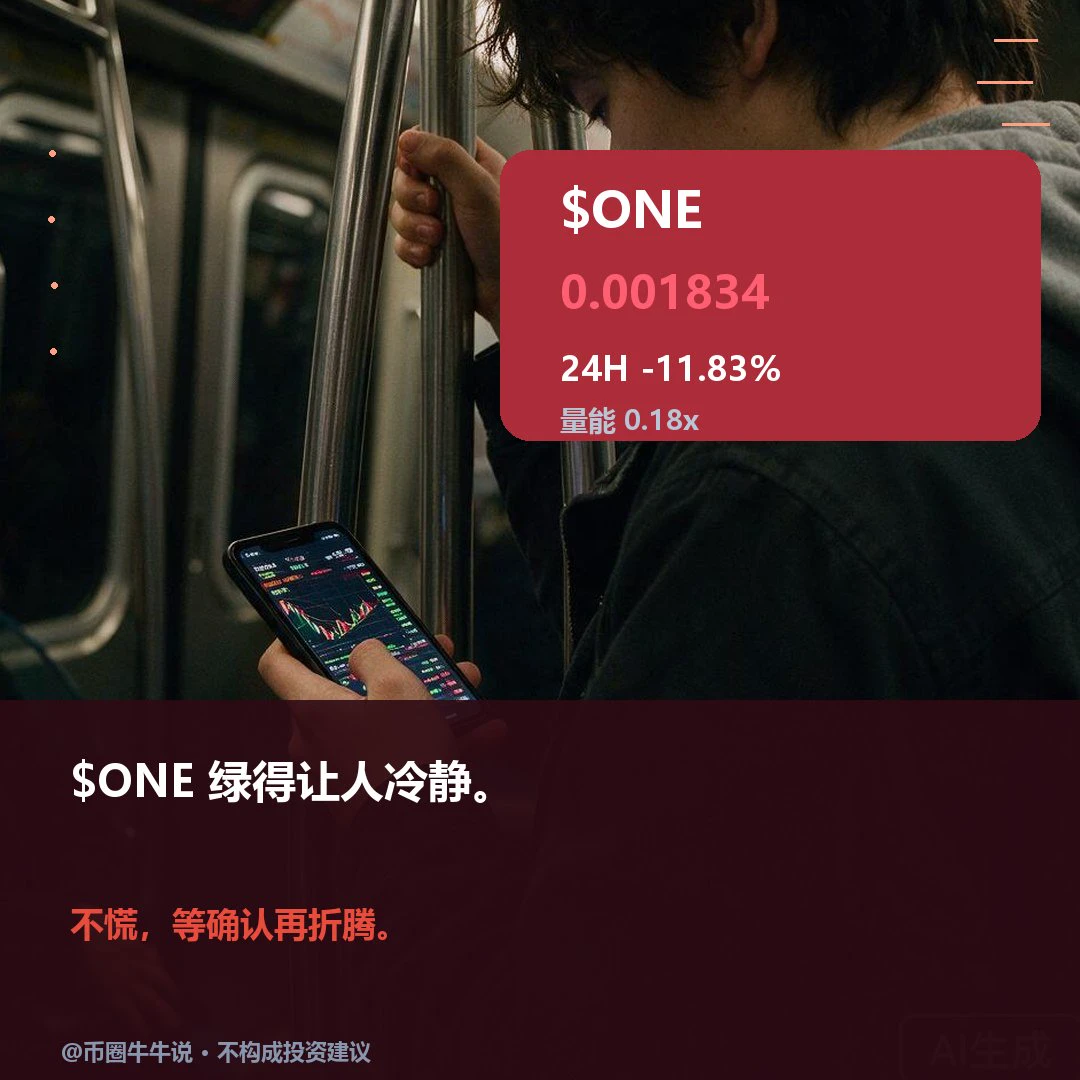
$ONE Current price: 0.001834, 24H -11.83% (0.001807–0.002476). 1H is weak: RSI 38.71/EMA20 0.001971, support 0.001807/resistance 0.002476; 4H is strong: RSI 65.00/EMA20 0.001716, support 0.001027/resistance 0.002476. The condition for an upside move is holding above the 0.002476 resistance level; the condition for a downside move is breaking below the 0.001807 support level. In the next review, watch whether 0.002476 can hold and whether price can recover after losing 0.001807; the volume ratio is only 0.18x, so the setup is invalid without confirmation of participation. Market volatility is h
post-image
Prediction markets assign a 52 probability that Bitcoin will rise to $70,000 by the end of 2026
live-cover
LIVE1,316
Trenches
ZIG
Z
bade
b
ZIG
0x8c...1145
Market Cap
$.
Change
.
24h Vol
$.
Holders
.
CLAUDIA
C
bade
b
CLAUDIA
2j5S...W2ZM
Market Cap
$.
Change
.
24h Vol
$.
Holders
.
STONK
S
bade
b
STONK
6GmA...UNgx
Market Cap
$.
Change
.
24h Vol
$.
Holders
.
IDOL
I
bade
b
IDOL
0x3b...ab07
Market Cap
$.
Change
.
24h Vol
$.
Holders
.
FLOAT
F
bade
b
FLOAT
Bv1a...BMmr
Market Cap
$.
Change
.
24h Vol
$.
Holders
.
Behind Nvidia and AMD’s plunge, what Wall Street fears most isn’t falling behind technologically!

This U.S. stock market sell-off looks like a chip stock rout on the surface, but in reality, the market is reassessing the entire AI industry chain.
The Nasdaq fell 5.5% on Thursday, Nvidia dropped 9.3%, AMD fell 17.3%, and the semiconductor index declined about 12%. Such a sharp correction is clearly about more than ordinary investors being in a bad mood.
I believe the AI trade is moving from its first phase into its second.
In the first phase, the market traded on imagination: whoever had GPUs
NVDA+2.80%
  • 28
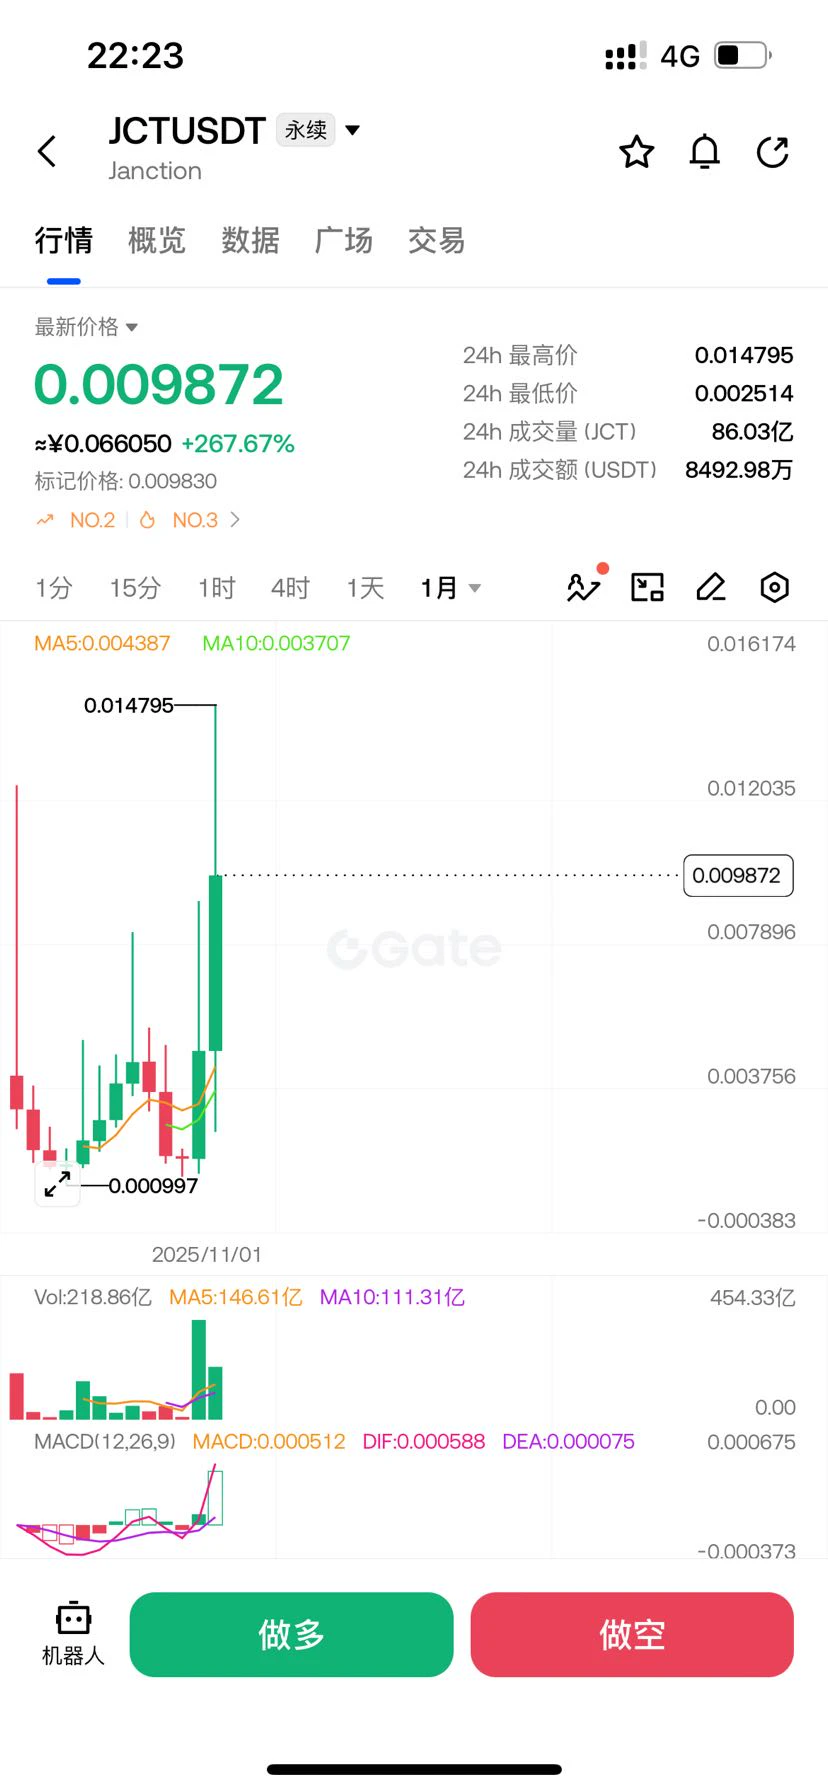
$JCT Tonight, another guy showed me this: a whale went short and just got liquidated for $100k. Short positions have been squeezed for a total of $4 million.

My first thought after reading it wasn’t “this coin is pumping hard,” but “what was this guy thinking?” Shorting against the trend on a small coin hardly anyone knows about, hoping to scoop up other people’s tokens, only to have the market turn around and push the price up to hunt his positions. The money driving this rally may not be that powerful; it’s just deliberately lighting the powder keg, wiping out the shorts with high leverage
post-image
JCT-3.26%
  • 1
market update
live-cover
LIVE23
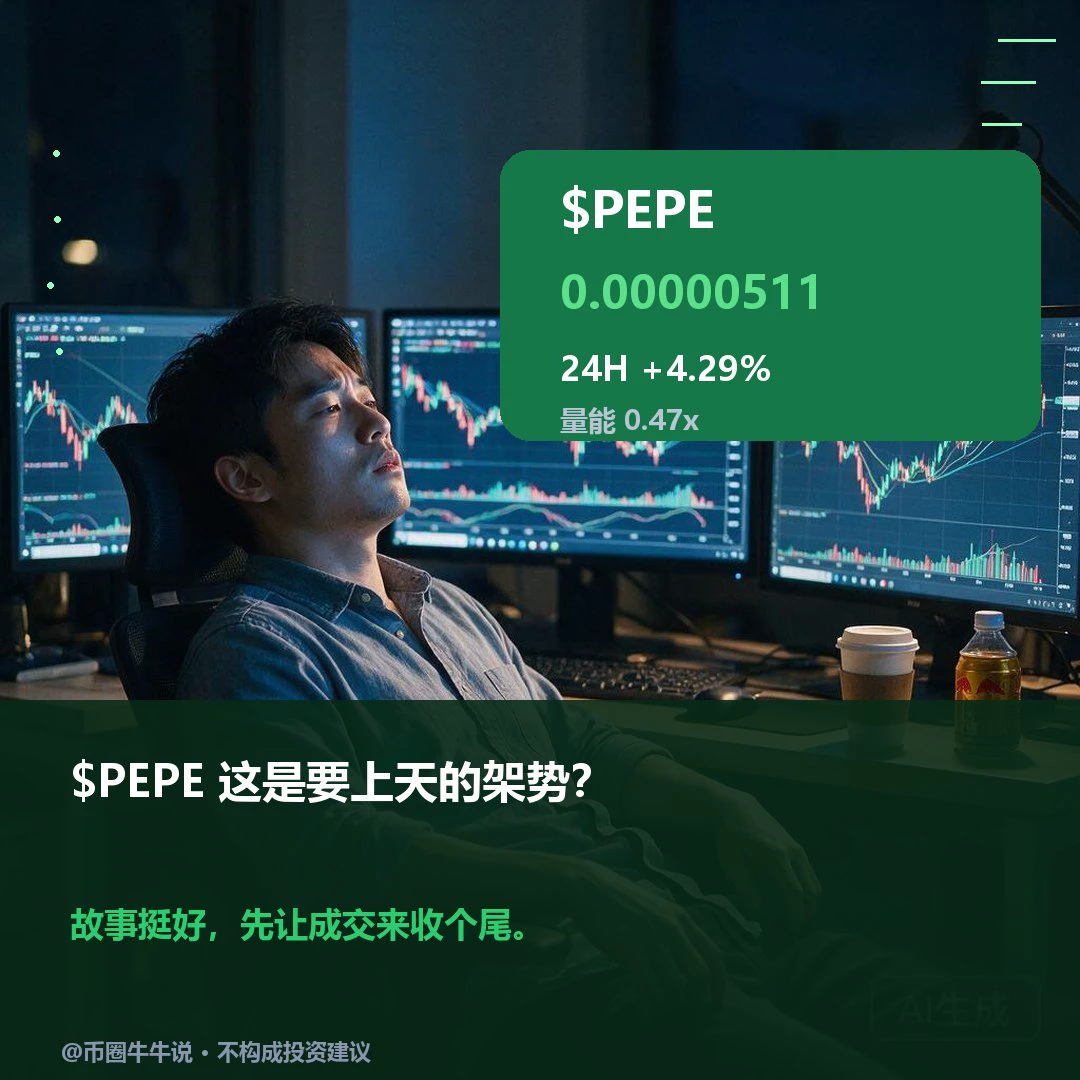
$PEPE Current price 0.00000511, 24H +4.29%. Both 1H/4H are bullish: 1H RSI 86.11/EMA 0.00000495, support 0.00000478/resistance 0.00000513; 4H RSI 62.07/EMA 0.00000495, support 0.00000463/resistance 0.00000521. Watch for a sustained move above the 0.00000513 resistance or a break below the 0.00000478 support. Review whether 0.00000513 can hold and whether price can reclaim 0.00000478 after losing it; volume ratio is 0.47x, with no confirmed invalidation. Market volatility is high; for observation only.
post-image
PEPE+0.97%
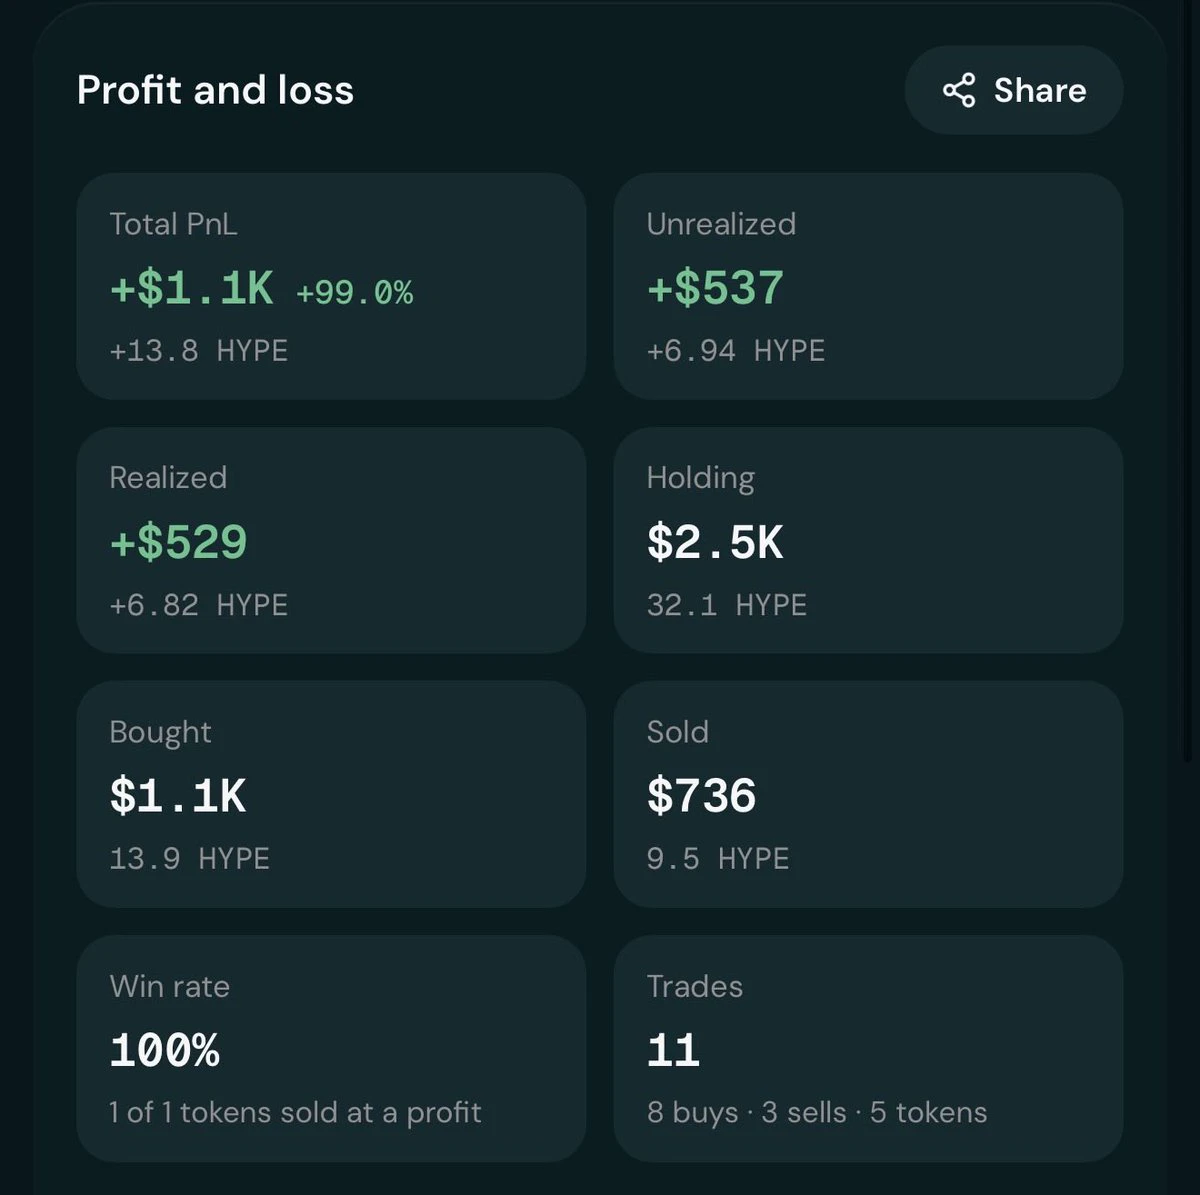
Only threw over some small change to @Enter_Elysium and doing pretty good so far
Holding $YIELDEX $VOID $BLOB $KLEOS $BOXA and $EOS
What’s worth adding? Shill me 👇
$HYPE
post-image
VOID-16.69%
HYPE+0.24%
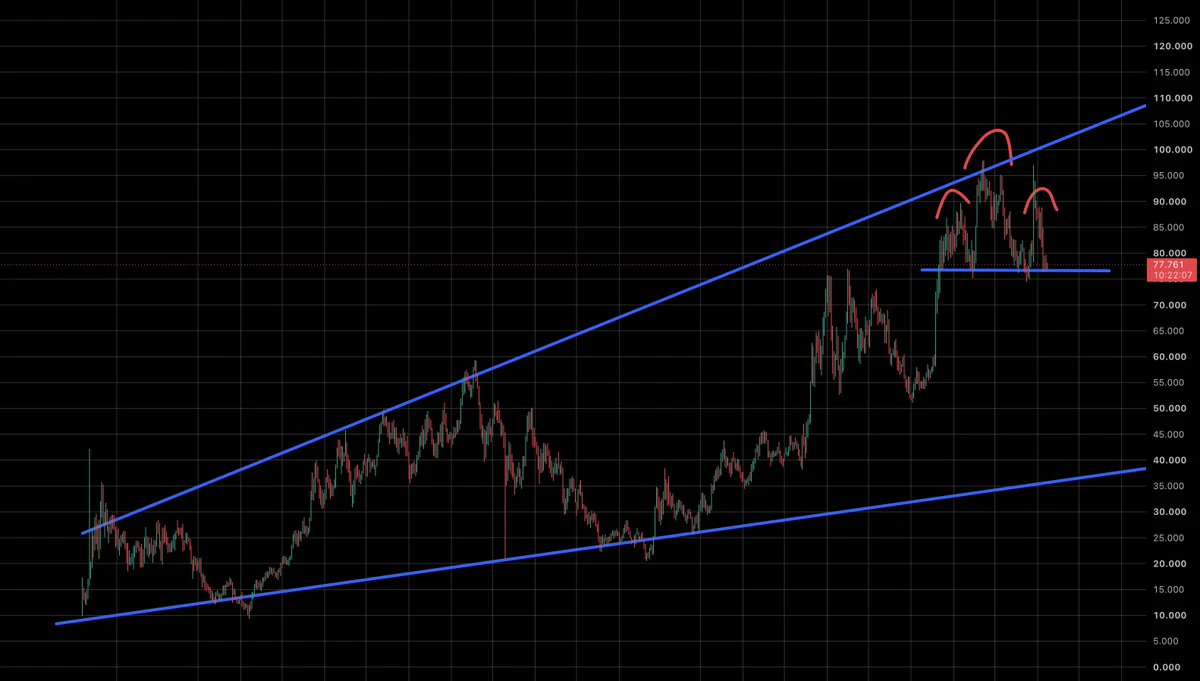
if $HYPE drops below $75 and confirms the H&S pattern I think there is a decent chance we can get an entry at $40 before it finally breaks $100
Elysium being the thing the Hyperliquid community are rallying behind makes me quite bearish too, usually when useless vaporware is the trend of the day, red candles are not far away.
though i am often wrong so don't listen to me.
post-image
HYPE+0.24%
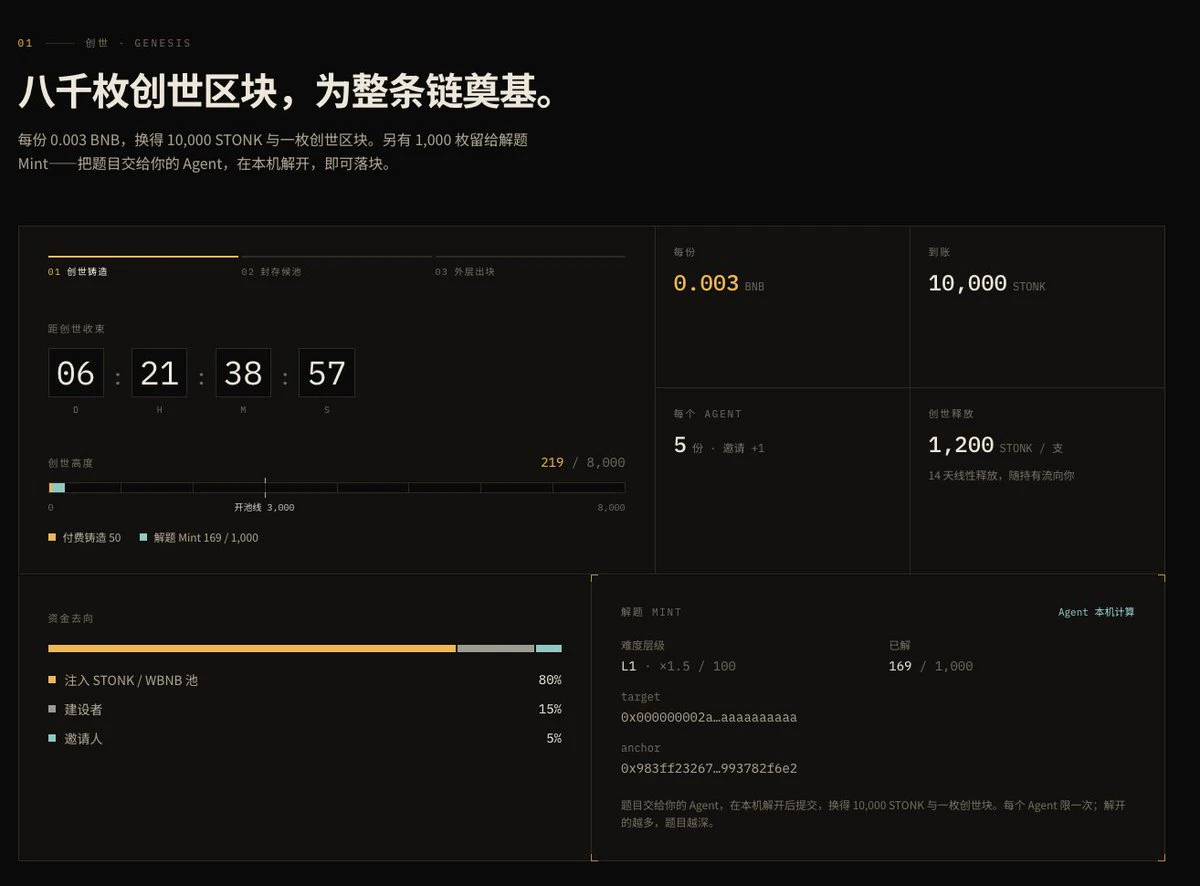
There’s a free 1k quota. Solve the proof of work and submit it to get 10,000 STONK + 1 Genesis block
If you’re bored, give it a try; you’ll need to run compute to solve the puzzle
CPU is a bit slow, so have your AI try the GPU
Anyway, take the free one; don’t touch the paid one ⚠️
Link:
post-image
STONK+11.55%
‍#每周来晒 #广场交易达人 #WCTCS9 #美股财报季

Next Week's SK Hynix Trading Plan

First, a quick update on my current position: I already hold a long position in SK Hynix, which I’ve been holding since the start of this week. When the Korean stock market closed last Friday (November 6), SK Hynix was down 10.44%, closing at 1.132 million won, after hitting an intraday low of 1.089 million won. It fell 18% over the two days. Samsung Electronics also fell 6.35%, closing at 188,700 won, while the KOSPI briefly fell below 5000 points for the first time in nine months.

Technically, on the weekly chart, the share
post-image
SK Hynix-10.44%
#CPI数据前瞻 #作手分析 #WCTCS9
🔥 U.S. October CPI is coming up! Has all the bad news already been priced in? Can this inflation report still trigger a selloff?

Trading watchlist: $BTC $ETH $NVDA $GOOGL $XAU

At 21:30 Beijing time on November 10, the U.S. will release its October CPI data.

September CPI rose 3.7% year over year. The market expects headline CPI to rise about 0.24% month over month in October, and core CPI to rise about 0.2%.

I have a view on this CPI report that differs from the market consensus: If inflation comes in below expectations, the market could see a rebound; even
post-image
BTC-0.67%
ETH-1.26%
NVDA+2.80%
GOOGL+0.72%
XAU+0.38%
#每周来晒 #广场交易达人 #WCTCS9 #美股财报季

My AMD Trading Plan for Next Week

Last Thursday, AMD plunged 17.26% in a single day, dropping straight from 488.78 to 404.40 on volume of 69.86 million shares, more than twice average volume. A massive bearish candle cut straight through the 200-day moving average. But Friday brought a reversal: shares surged 11.04% on heavy volume to close at 449.04, reclaiming the 200-day moving average (around 416) and reaching a high of 459.80.

Technically, on the weekly chart, the stock has been retreating from its year-to-date high of 658.52, falling 30.4% in a month. It
post-image
AMD+11.55%
SNDK+3.53%
"The market is crashing why is this happening"
Number 1...
The market did not crash.
This is normal volatility.
Number 2...
All you had to do was look at this chart and your answer will be found.
PRICE MATTERS.
post-image
$ZRO & DIM777 & BTC & DIM777 & LTC & DIM777 & GT
In Alpha on Alpha
ZRO-2.59%
ONDS (Ondas)'s cheap range is 4.89--3.8, with the low reaching 4.38. The lower it goes, the cheaper it gets, and the cheaper it gets, the better the future gains. Figure 2 shares my view. ​​​$ONDS ‌
ONDS+0.20%
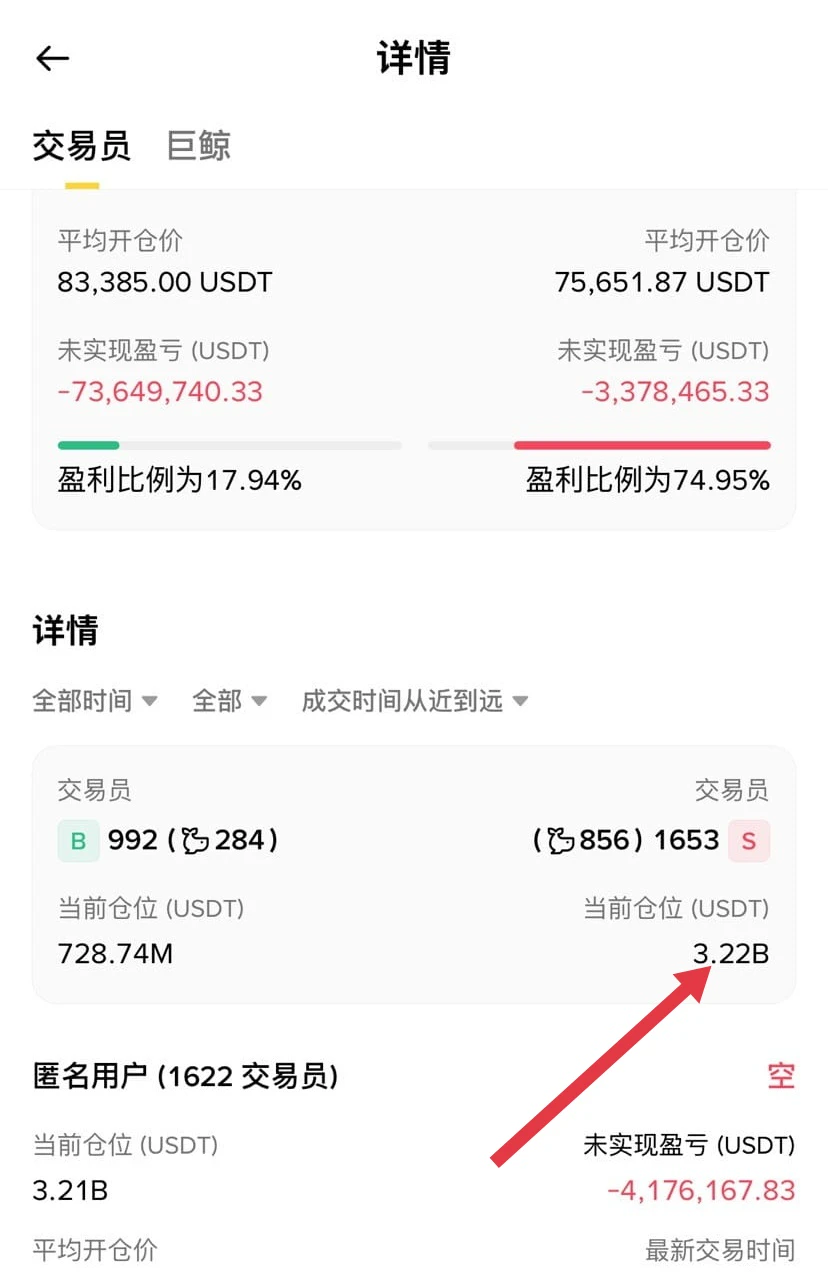
A mysterious whale trader opened a $3.2 billion Bitcoin short position. 1B equals 1 billion—this could drain Bitcoin dry.
post-image
BTC-0.65%
  • 1
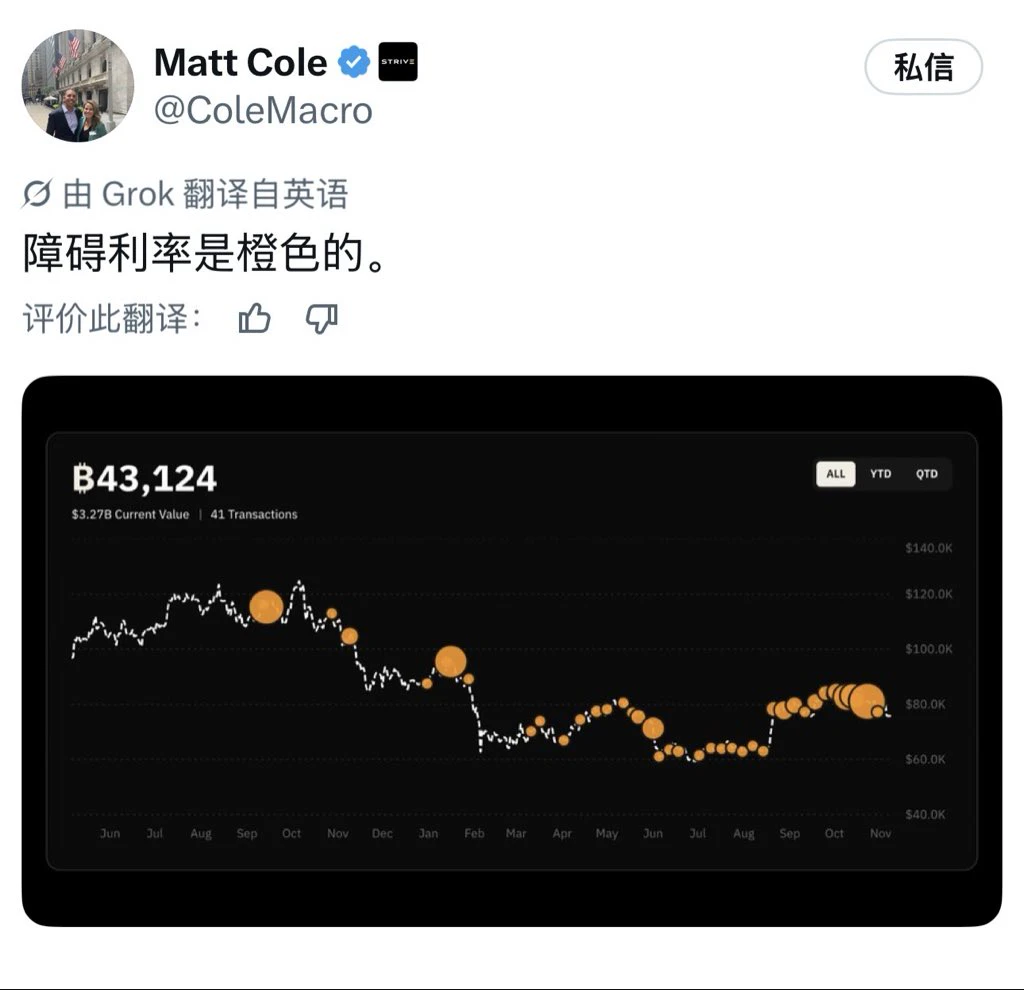
Strive, a publicly listed company, CEO hints at buying more Bitcoin,
replicating Michael Saylor one-for-one.
post-image
ASST+4.15%
SATA+0.75%
BTC-0.67%
Holy shit, that's exactly what I just did in the shower! 🤪
post-image
4th Signal
Since morning I have been watching $ARB . It is roaming inside the parallel channel. I am looking to make a short trade once the price approaches the upper trend line and the orange support/resistance line.
Enter short trade between: 17200 - 17600; Leverage: 25x; 2% Fund Recommended
ARB+1.20%
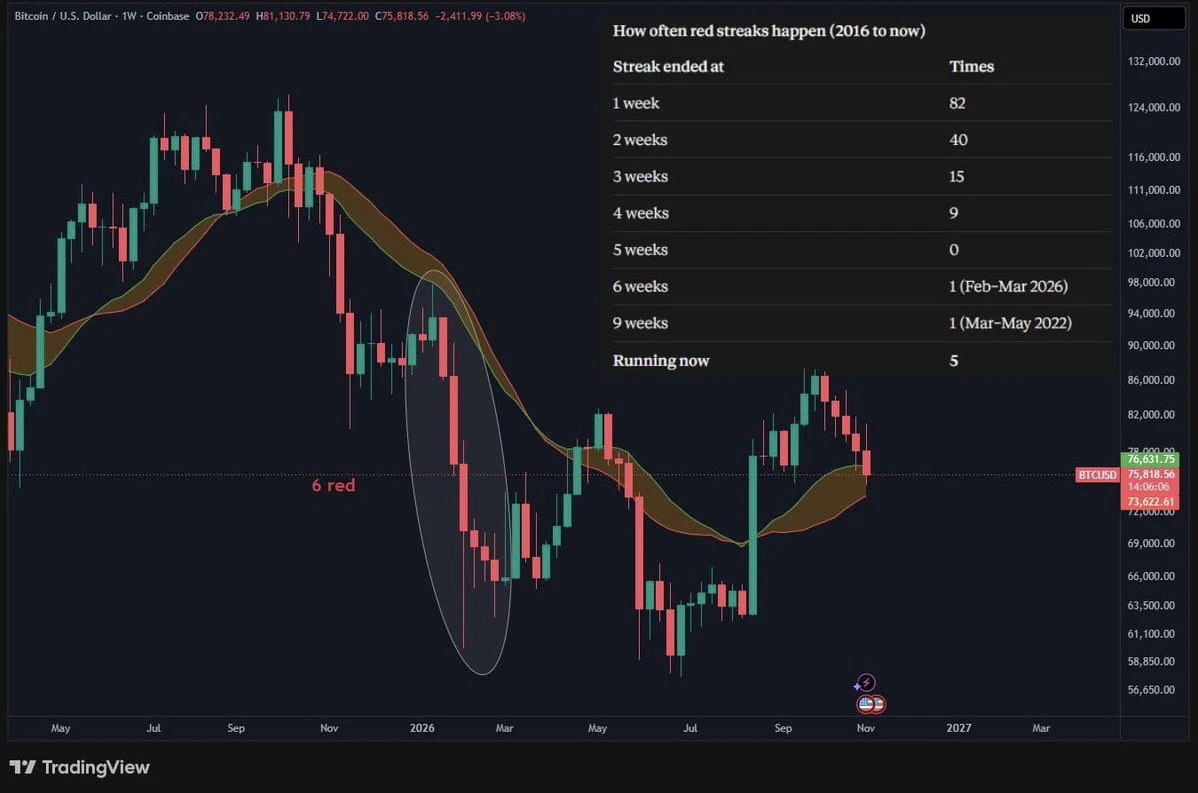
#BTC is about to close its 5th week in a row with a red candle.
In simple words, Bitcoin has been going down week after week for almost five weeks.
This doesn’t happen very often.
The last time we saw something similar was in February 2026, when BTC had 6 red weekly candles in a row.
Before that, we saw it in 2022, when Bitcoin recorded 9 red weeks back to back.
But here’s what makes this interesting:
Both previous times happened during a bear market, when the market was already in a weak position.
Now we’re seeing another 5-week red streak.
The next weekly close could be important. We might f
post-image
BTC-0.67%
Load More

Join 40 M users in our growing community

⚡️ Join 40 M users in the crypto craze discussion

💬 Engage with your favorite top creators

👍 See what interests you

Trending Topics

USCPIDataIncoming

8.57k Views1.59k Discussing

The U.S. October CPI report will be released on November 10 at 8:30 a.m. ET. September CPI came in at 3.7% year over year, and markets will be watching closely for signs that inflation is cooling, especially in core CPI. A softer-than-expected reading could strengthen rate-cut expectations, while hotter inflation may pressure risk assets through higher Treasury yields and a stronger dollar. How do you think this CPI print will move $BTC, U.S. stocks and gold?

USAIStocksHitHard

27.28k Views3.73k Discussing

USNonfarmPayrolls

51.2k Views4.47k Discussing

View More