Square
Following
Hot
News
Profile
Share your thoughts
placeholder
Article
$DOGE The most unusual detail today is not the drop, but that the funding rate remains positive at +0.0100%, while the price has slipped 0.46%—longs are paying to hold positions, but the market is not rising. This kind of “paid stagnation” is often a signal that the health of the trend needs to be verified.
When using moving averages to determine whether a trend is healthy, the key points are alignment and slope. Currently, MA5=0.081446 is higher than MA20=0.0804545, with the short-term moving average above the long-term moving average, constituting a bullish alignment; however, the gap betwee
post-image
DOGE-1.00%
HYPE+1.02%
TRX+0.00%
$SIREN Chinese mitten crab 0xfcfe23be934f34ab01f74c9ef69c2af880a74444
post-image
SIREN+20.84%
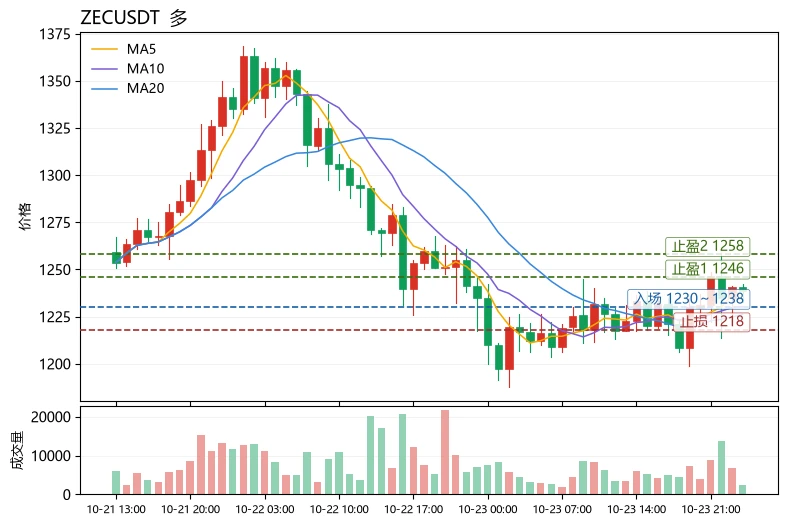
Added to the long position on $ZEC
. Trading parameters: Entry: 1,199.22 - 1,214.56Target 1: 1,260.38Target 2: 1,303.17Stop-loss: 1,163.24ZEC is taking a brief breather at support, then preparing to return to Valhalla. Buy the dip! Try this trade here. $AKE and $ETH are worth watching today.
post-image
ZEC+6.32%
AKE+20.31%
ETH+0.87%
October 16 Strategy Plan Priority Ranking, for Followers Only
Execution Priorities for Today
My execution order:
2455—2467: short if rejected
2420—2430: go long on a pullback
If it breaks below 2398, short near 2400 on a rebound
If it breaks effectively above 2467, go long after a pullback confirmation
No operation in the middle range of 2435—2448
Current bias:
> Above 2400, favor range-bound bullish movement; handle 2455—2467 with a bearish bias. The real direction confirmation points are: a break above 2467 or a break below 2398.
$ETH
post-image
ETH+0.75%
💡 16.424 megawatts of demand with no date for normalization: blackouts are already moving P2P in Venezuela.
Less liquidity, wider spreads, and USDT as an operational tool, not just a savings vehicle.
👉
#P2P #USDTVES #Venezuela
post-image
$CCXI
The double bottom and bullish divergence on the 4 hour chart suggest a bounce is possible
post-image
$FIL I was the one who dumped it to the low of 1.0014, so don't rush to curse me.
Before a pump, someone has to wash out the weak hands. Do you think the 20% move from 1.0014 to 1.2009 formed naturally? That sharp drop in the early session was my 1,880-lot sell order, specifically hunting stop-loss orders around 1.05. After wiping out the long liquidity, I turned around and started buying at 1.01. At least 30% of the 218.2M trading volume consisted of my matched orders—without creating the volume, how would retail traders dare to follow?
It's now 1.1764, up 7.83%, and my core position is alrea
FIL+6.08%
  • 2
🕒Beijing Time: 2026-10-16 (Friday)

📊Key Macroeconomic Focus

1. U.S. September PPI: 6.3% year-on-year (expected 5.3%), 1.3% month-on-month (expected 0.5%); inflation strengthened again beyond expectations
2. U.S. September retail sales rose 0.8% month-on-month, above expectations, indicating strong economic resilience
3. Key events today:
✅11:30 Fed's Warsh speaks at the IMF annual meeting in Bangkok (the most important official speech today, with only two weeks remaining before the FOMC meeting; focus on comments regarding rate hikes)
✅21:15 U.S. September industrial production month-on-
$ZEC
ZEC is currently in an oversold rebound phase, with short-term strength but no reversal in the medium-term trend yet.
Trend: The price has rebounded from 1,075 to around 1,221, moving above all short-term moving averages, but the medium-term moving averages remain bearishly aligned and the MACD death cross remains unresolved, indicating a rebound rather than a reversal.
Support levels: First support at 1,211~1,214; core support at 1,192~1,195; strong support at 1,075.
Resistance levels: First resistance at 1,253~1,254; key resistance at 1,270~1,285; strong resistance at 1,349.
In simple
post-image
ZEC+6.32%
No talent? Then repeat!
Good morning, my world❤️
post-image
$INJ Short setup… price is testing a strong resistance zone
INJ has risen sharply from around 7.05 to the 8.50–8.56 resistance zone. This rebound is strong, but this is exactly where I would stop chasing longs. Short entry: 8.30–8.60 (filled) Next target price: 8.20Take-profit 1: 8.00Take-profit 2: 7.80Final target: 7.65Stop-loss: 9.00
After the rapid rebound, the move is beginning to look somewhat overstretched, while the price is currently below resistance. If buyers fail to break through 8.56 effectively, I expect the price to first pull back toward 8.20 for a test, followed by a possible f
post-image
INJ+11.39%
#每周来晒 #USSeptemberPPIDataRelease
US SEPTEMBER PPI: INFLATION PRESSURE, FED POLICY, AND BITCOIN’S NEXT MOVE
The September US Producer Price Index (PPI) report is an important event for financial markets because it offers another look at inflation before the Federal Reserve’s upcoming policy decisions. For me, the key question is not simply whether producer prices rise or fall. What matters most is whether inflation is cooling sufficiently to give the Fed confidence to consider future rate cuts.
My approach is cautious: I want to understand the data first, observe the market’s initial reaction,
BTC+0.65%
USIDX+0.09%
I think this move in oil prices isn’t over yet, but now isn’t the time to chase the rally. Liquidity in the futures market is lowest in the early morning hours, which is also when sudden wicks are most likely. Technically, the previous high is near resistance. If the trendline holds on the pullback, there’s still a chance. Let’s wait until the weekend to see how it turns out, then compare notes. Those watching it, keep an eye on #CrudeOil.
post-image
To be honest, people’s heads can be pretty hard sometimes. Even getting hit on the head by a white ball this hard doesn’t do anything.
THE CRYPTO RALLY IS COMING AS JIM CRAMER TURNS BEARISH! HUGE RLUSD XRP LEDGER BANK INTEGRATION! MONEYGRAM XDC!
WATCH ▶️
#crypto #cryptonews #bitcoin #xrp #rlusd #jimcramer #xdc #xlm #polygon #tokenization #stablecoins #thinkingcrypto
post-image
RLUSD+0.00%
XRP+0.25%
XDC+0.93%
BTC+0.65%
XLM+0.29%
( new streamer) market overview
live-cover
LIVE1,364
$BTC
BTC Long/Short Trend Monitor |
Simply put:
Bitcoin is currently weak and range-bound in the short term, but the trend has not broken down yet.
1. Current price: Around 82,000
2. Short-term direction: Bearish; it is being capped by the moving averages and unable to move higher, with strong resistance above 84,000
3. Support level: 80,000 is the key floor; only a break below it would lead to a further decline toward 77,000
4. Medium to long term: The broader trend remains intact, with support still at the bottom, so there is no need to panic excessively
One-sentence summary: Weak consolida
BTC+0.65%
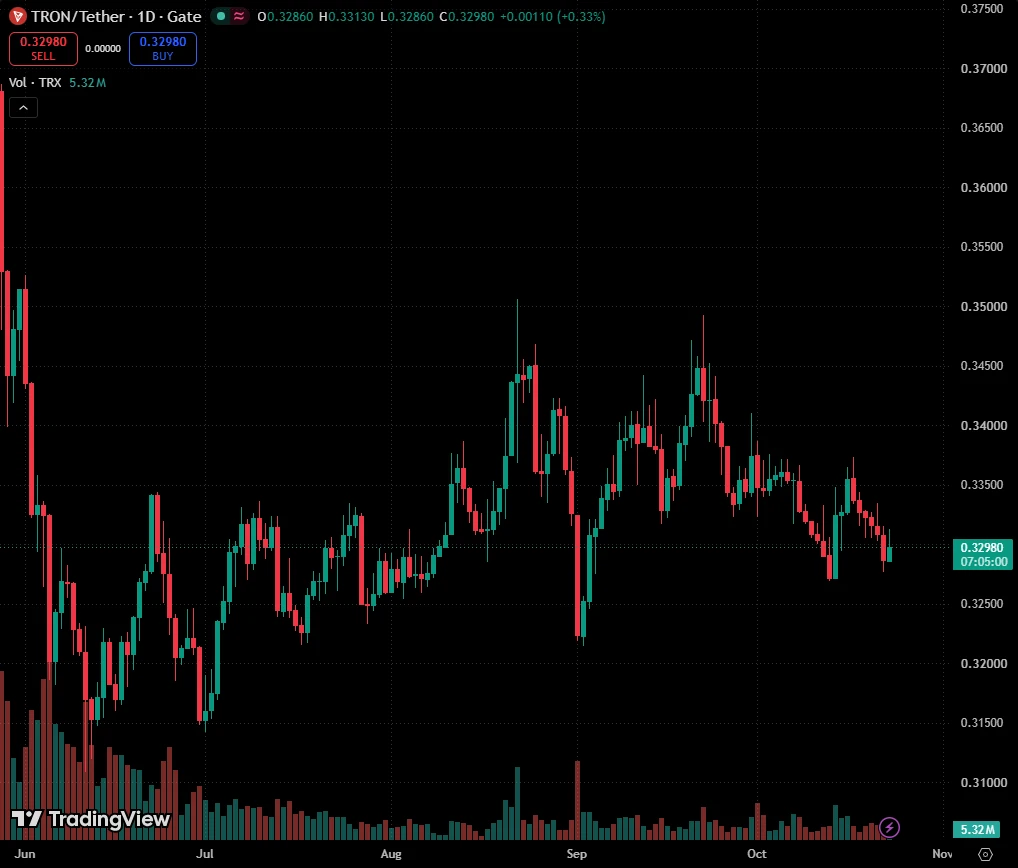
$TRX TRXUSD H4 | Sweep Low Reclaimed, Long Toward 0.3449
TRON sold off through the weekly range and swept to about 0.3270, then bounced hard to the 0.334 area. It has now pulled back into the 0.3302 support line, which is the level I’m watching for a long. The weekly pivot (PP 0.332378, Pivot Hybrid, from last week’s H 0.337120 / L 0.330590 / C 0.330900) sits just above, so reclaiming it is the first step.
Why I’m leaning long
Sweep and reclaim. The dip to 0.327 took out the weekly low and was bought fast. That’s a liquidity grab, and the bounce held above it.
Higher low on the pullback. The r
post-image
TRX-0.04%
Load More

Join 40 M users in our growing community

⚡️ Join 40 M users in the crypto craze discussion

💬 Engage with your favorite top creators

👍 See what interests you

Trending Topics

USSeptemberPPIBeatsExpectations

91.35k Views1.88k Discussing

US September PPI came in at 6.3% YoY, well above the 5.3% market expectation, pointing to renewed producer-side inflation pressure. Weekly jobless claims were 199K, broadly in line with forecasts. Could hotter inflation further reduce room for rate cuts, and what does it mean for $BTC, US stocks, and gold?

DrLinHanSpeaksAtOxfordUnion

135.63k Views1.86k Discussing

JapanAndKoreaStocksPlunge

47.27k Views1.76k Discussing

View More