Square
Following
Hot
News
Notifications
Profile
Share your thoughts
placeholder
Article
Guys, you can earn 100 support points by signing up. Support Xiao Mo’s Trend Analysis to get 1 lottery entry—come support now! 🫰https://www.gate.com/zh/competition/Annual-Gala
post-image
  • 1
  • 1
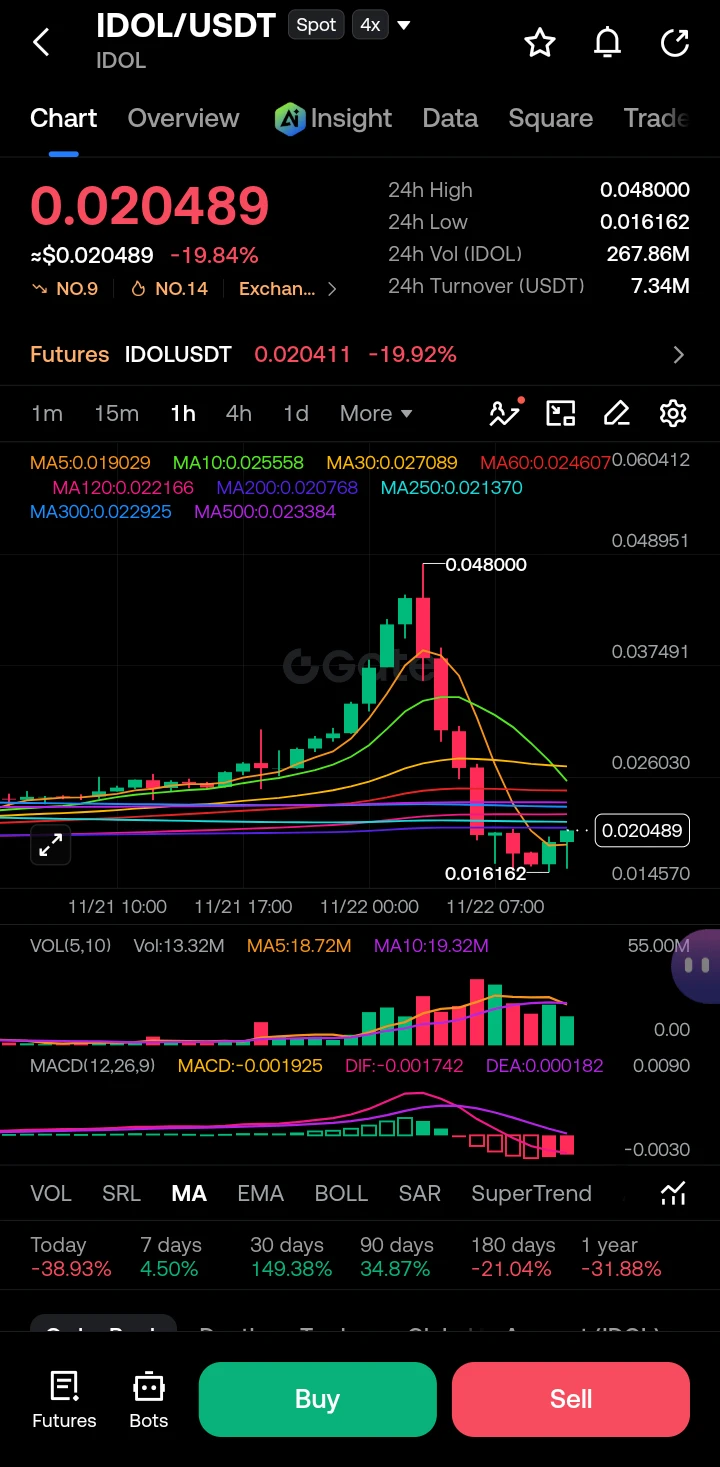
The Anatomy of a Liquidation Cascade: Decoding the IDOL/USDT Overextension
$IDOL ‌

The IDOL/USDT chart provides a textbook example of why traders must pay attention to market overextension, volume dynamics, and liquidity sweeps. Currently sitting at $0.020489 (down -19.84%), the asset has experienced a violent macro-to-micro structural breakdown. By mapping the flow of liquidation from the monthly timeframe down to the 1-hour chart, we can see exactly why trading purely on RSI overbought/oversold signals without volume confirmation is a trap, and how whale distribution precedes these massive
post-image
IDOL-6.71%
  • 1
  • 2
Trenches
IDOL
I
bade
b
IDOL
0x3b...ab07
Market Cap
$.
Change
.
24h Vol
$.
Holders
.
JAGENT
J
bade
b
JAGENT
0x8e...ae15
Market Cap
$.
Change
.
24h Vol
$.
Holders
.
PIEVERSE
P
bade
b
PIEVERSE
0x0e...25a9
Market Cap
$.
Change
.
24h Vol
$.
Holders
.
FIONA
F
bade
b
FIONA
B34n...pump
Market Cap
$.
Change
.
24h Vol
$.
Holders
.
mihao
m
bade
b
mihao
4Cxj...pump
Market Cap
$.
Change
.
24h Vol
$.
Holders
.
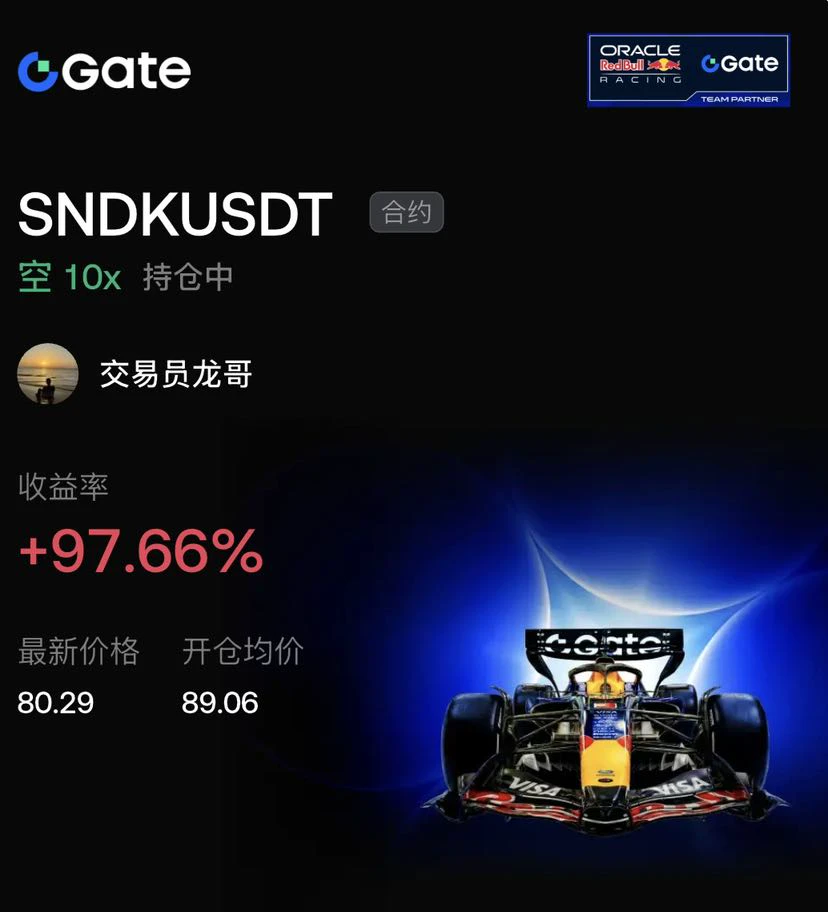
$SNDK The short side led the race from start to finish! We decisively entered at the 89.06 high, using 10x leverage to ride the trend and keep the bulls in check. The price slid all the way to 80.29, sending returns soaring to 97.66%! Even the Red Bull F1 car in the background couldn't keep up with this sell-off, while the bulls' counterattack looked like a failed attempt to overtake on a bend.

But violent wicks are nothing new in the futures market, and 10x leverage can get you liquidated in an instant.

The defenses are fully in place, with the stop-loss firmly locked at breakeven! If the p
post-image
SNDK-0.18%
BTC-0.65%
SOL-0.74%
  • 1
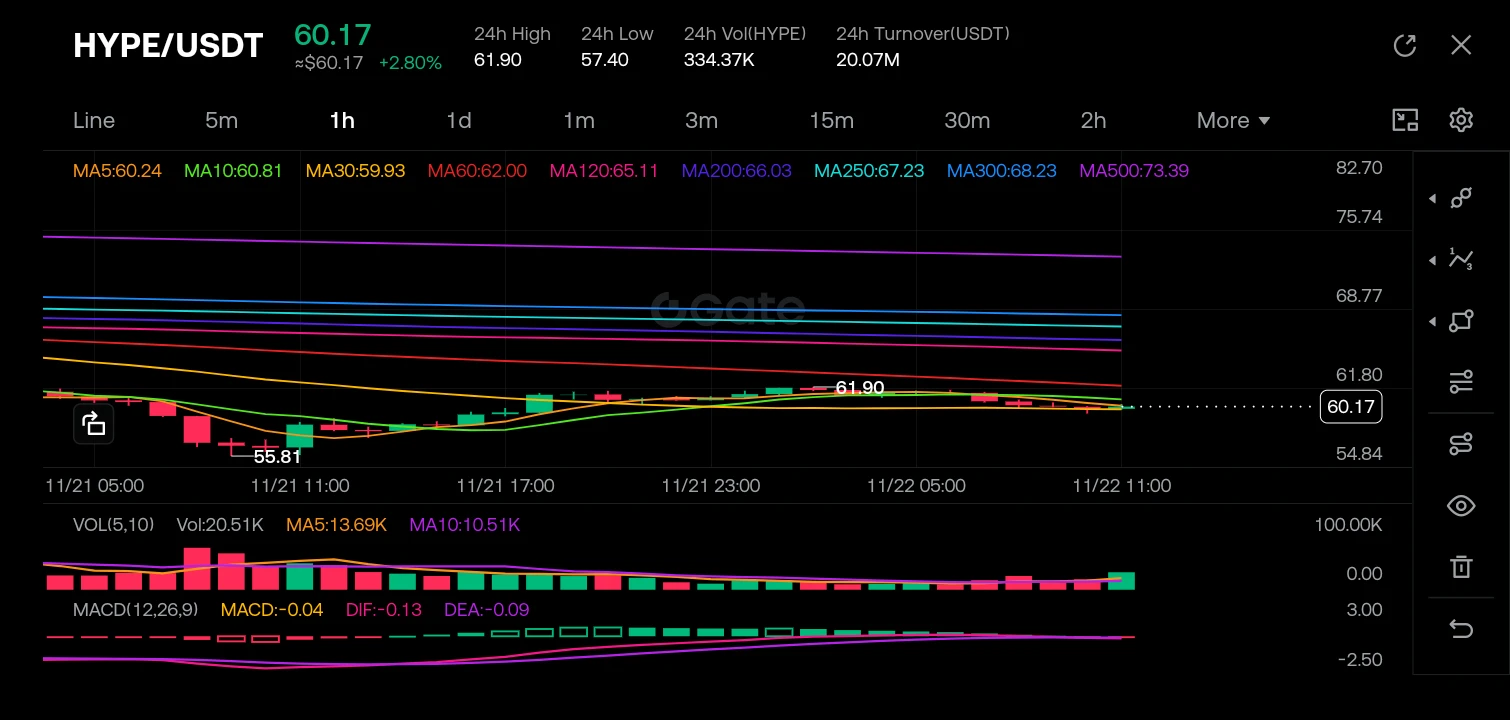
$HYPE ‌

The HYPE Squeeze: Decoding Whale Accumulation at the 60.17 Pivot Amidst a Macro Downtrend

The market is currently presenting a fascinating paradox on the HYPE/USDT pair. While the broader macro structure remains compressed under heavy moving average resistance, the micro-structure on the 1-hour timeframe reveals a stealthy accumulation phase. We are witnessing a classic "calm before the storm" scenario where price action is pinched between immediate support and a ceiling of long-term bearish moving averages, creating a high-probability setup for volatility expansion.

· Monthly/Week
post-image
HYPE+0.24%
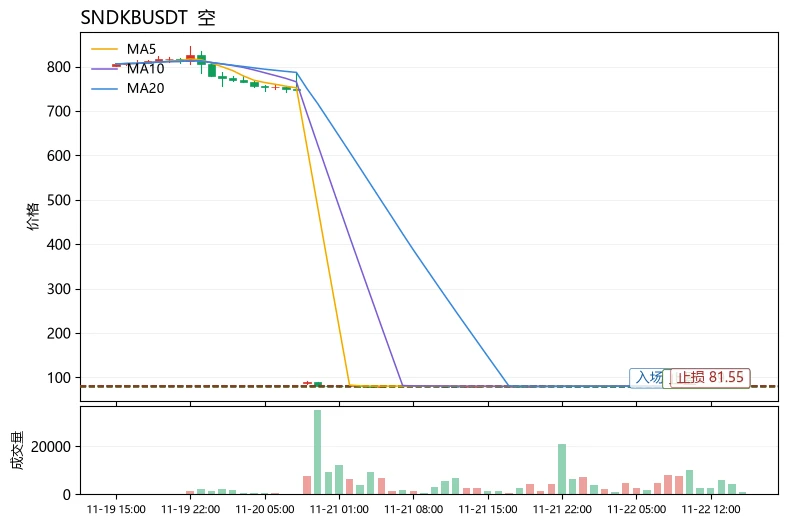
$SNDKB Bottom line: Short-term outlook is bearish. A rebound near the Bollinger middle band is an opportunity to enter a short position; buying the dip here is not recommended. Reasons follow.
The moving averages are bearishly aligned, with MA5 (80.384) below MA20 (80.6665). The current price of 80.27 has fallen below MA5, and the short- and medium-term moving averages are exerting clear resistance. Although the MACD histogram is +11.43, indicating residual bullish momentum, the price has failed to hold above the moving averages, a typical sign of a weak rebound. RSI is only 7.5, in extremely
post-image
SNDKB
SNDKBSNDKB
Four.meme
MC:$3.87KHolders:1
0%
NEAR+1.17%
ADA-1.48%
$ZEC ‌

The Liquidity Tide: Navigating ZEC’s Volatility from Whales to Candlesticks

Markets are often described as a random walk, but to the trained eye, they are a structured mathematical symphony of liquidity and emotion. The current ZEC/USDT setup presents a textbook example of why traders must look beyond simple price action. We are witnessing a conflict between macro bearish pressure and micro bullish recovery. By analyzing the interplay of whale accumulation, liquidation cascades, and structural pivot points across multiple timeframes, we can decode the market's next move. We trade ove
ZEC+1.16%
  • 2
  • 1
This round of U.S. stock sell-offs has been brutal: the Nasdaq plunged 5.28% in a single day, the S&P 500 fell for seven straight days, closing down 3.7%, and even the Dow gave way, sliding 1.93%. Since its August peak, global stock market capitalization has shed nearly $9 trillion. The apparent trigger was a widespread sell-off across the AI sector, with $NVDA plunging 14% in a single day and Anthropic turning sour on its first day of trading. But at its core, it comes down to three words: repricing.
In the past, markets were willing to believe that “the AI narrative is big enough to justify
post-image
NVDA-0.35%
XAU+0.38%
BTC-0.67%
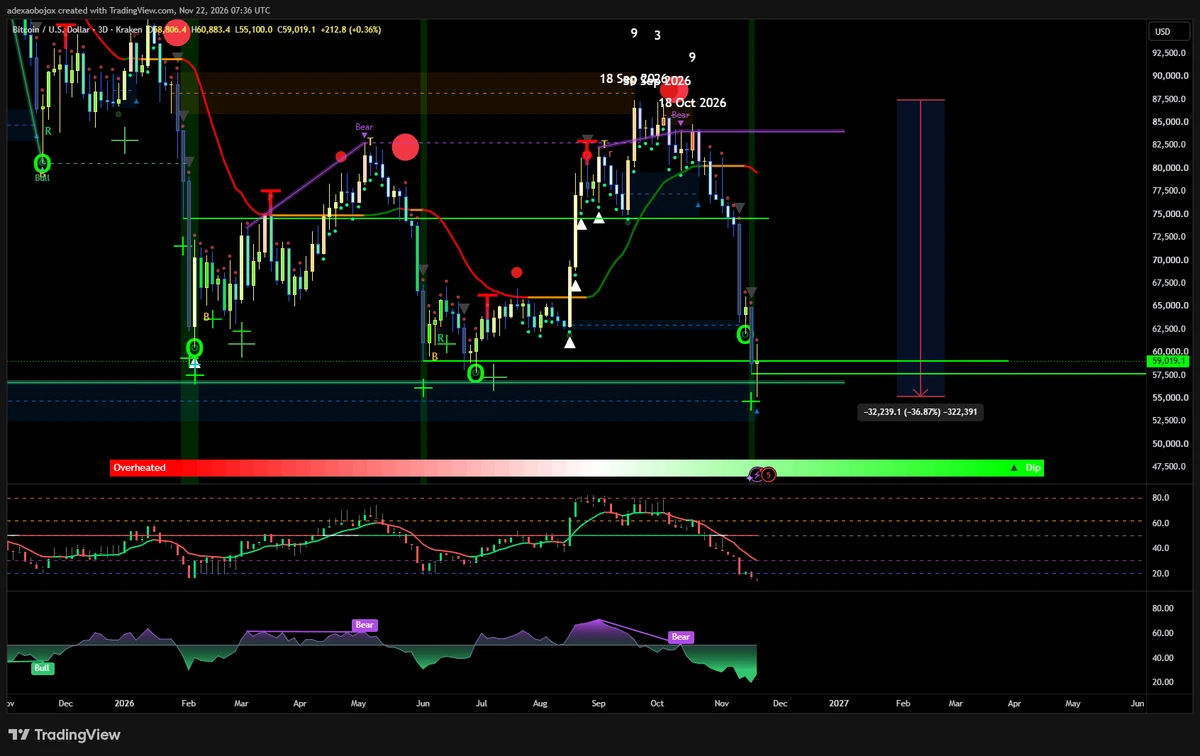
Seven wild predictions about the future: 1: $BTC Bottom at 50,000–55,000 2: The market starts to noticeably improve in Q1 2027 3: Bitcoin will enter a trending market in Q1 2027 4: There will be a structural altcoin rally in 2027 and 2028 5: No recession or financial crisis 6: The wealth-creation effect of altcoins in this bull market cycle in 2027–2028 will exceed that of the 2024–2025 bull market cycle 7: From now until before Q1 2027 is a time to accumulate and reduce positions. I can get at least six of these seven predictions right.
post-image
BTC-0.67%
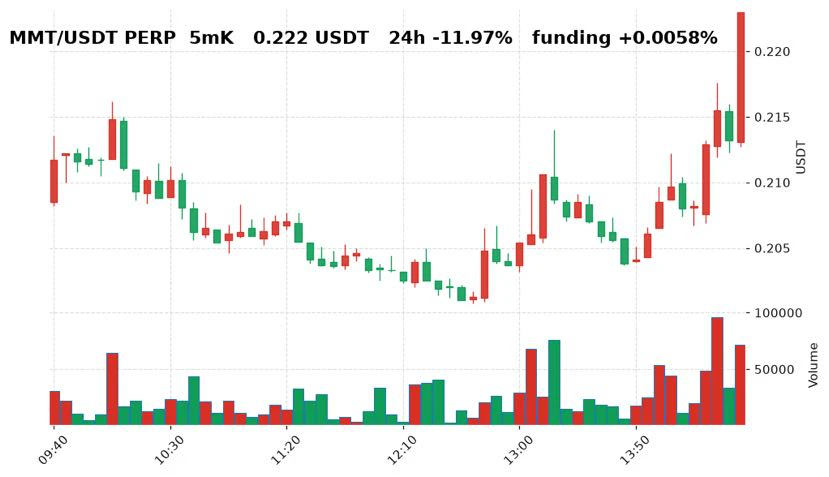
While killing time scrolling, I came across $MMT ‌. It jumped 6.1% in 5 minutes, and the current price is 0.222. It still hasn't broken past the previous high of 0.2594. With my small position, I'll just watch for now—I've lost too many times from FOMOing into a rally 😭. The perpetual futures funding rate is +0.0058%; I don't touch leverage. Would you make a move at this level? A: Yes B: Too chicken. I admit I'm chicken #摸鱼看盘 #行情速递
post-image
MMT-3.20%
  • 1
  • 1
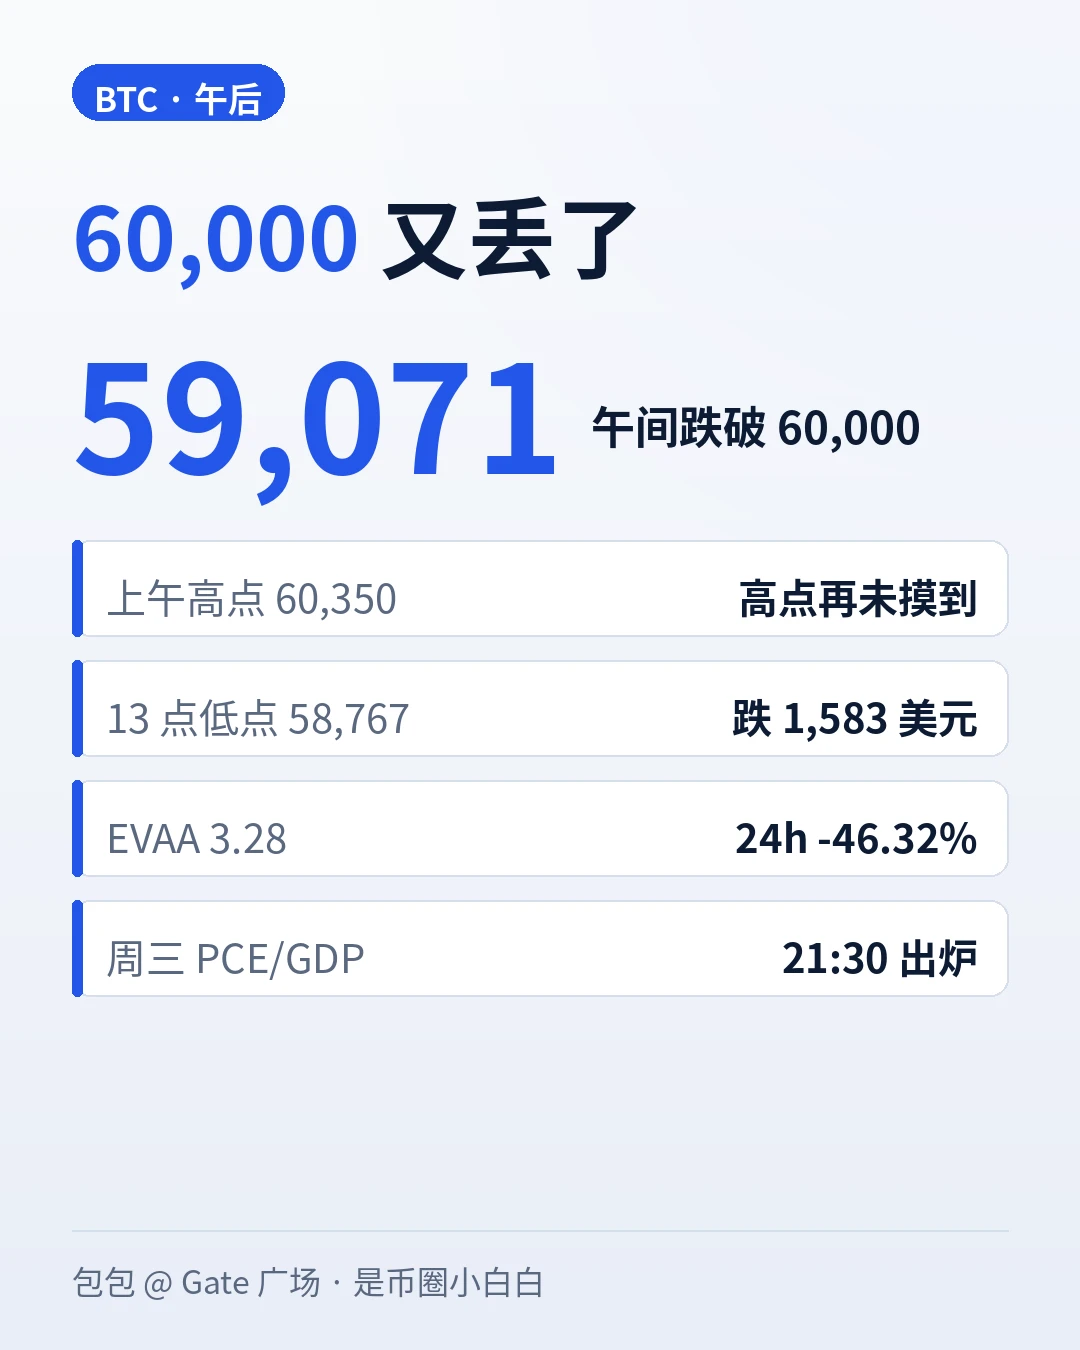
The 10:30 a.m. post asked, “Which breaks first, 60,350 or 60,016?” The answer: 60,016. The 10 a.m. hourly candle plunged straight to 59,421, taking out 60,000 on the same candle, and the low reached 58,767 at 1 p.m. My take: the rebound has run out of momentum. This afternoon’s move isn’t a pullback; it’s a second leg down. #BTC反弹后再争6万美元关口
Let’s tally up the midday numbers: BTC is now 59,071, versus 60,064 when I posted at 10:30 a.m.—a drop of $994 in four hours. From the morning high of 60,350 to the 1 p.m. low of 58,767, it fell $1,583. Hourly closing prices kept moving lower: 59,499 at 10
post-image
How is BTC more likely to move after Wednesday's PCE/GDP data come out?
Hot data, rate hike confirmed, the market continues lower
Data cools, 60,000 reclaimed
Data is in line with expectations, with sideways trading and bottoming while awaiting the December decision
3 Participants
Ends In 22 Hour
BTC-0.67%
ETH-1.26%
SOL-0.77%
EVAA-0.49%
ANT-8.68%
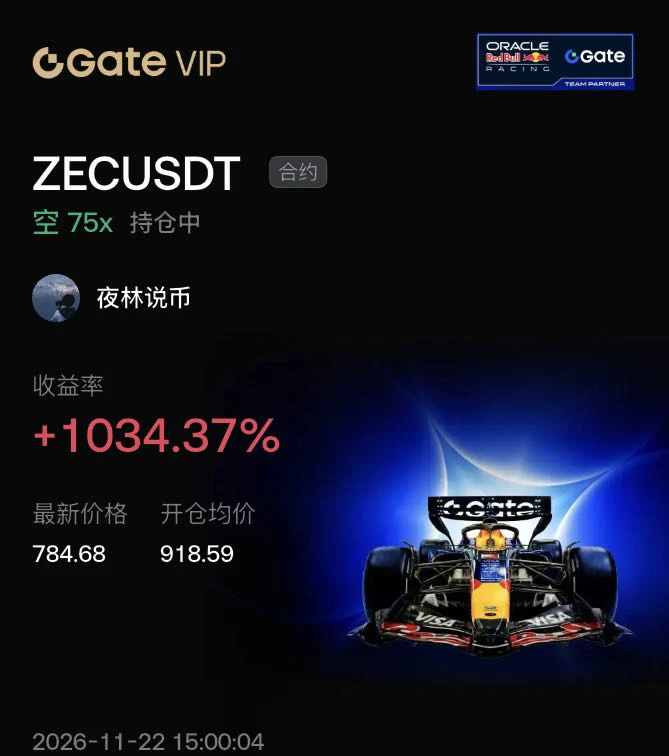
$ZEC When the market-wide long/short ratio spikes to an extreme, is this the final stage of retail investors becoming exit liquidity?
In-depth analysis: When ZEC surged to 918.59, the account long/short ratio was heavily skewed toward longs, indicating that retail investors were all in and no new buyers remained in the market. Exhausted buying pressure is the biggest bearish catalyst. I opened a short as the long/short ratio peaked and began to retreat, using 75x leverage to capitalize on the cascade in this overcrowded trade.$BTC $ETH
post-image
ZEC+1.29%
BTC-0.65%
ETH-1.23%
  • 2
market update
live-cover
LIVE1,994
SOL-0.77%
The purpose of a VPN is self-evident. You have to break out of your information bubble and open your eyes to the world.
post-image
There are few short positions and many long positions. After a big rally, one bearish candle, then it keeps rising? The chart action looks like it may be baiting traders into shorting. Long strategy $AIGENSYN , suitable for entering during sideways movement and a gradual rise: Entry: 0.0168-0.0169 Take profit: 0.0184 Stop loss: 0.0157 This strategy may suit this chart pattern. The market maker is going long at around 0.014-0.015
post-image
AIGENSYN+1.18%
$btc people still want lower after that drop imo i think greed and fear has taken over most of ct.. retest of the lows is imo the logical outcome. sp500 is going to bottom very soon after monday and thanks giving this week we are bound for a trend change after. just my opinion
post-image
BTC-0.67%
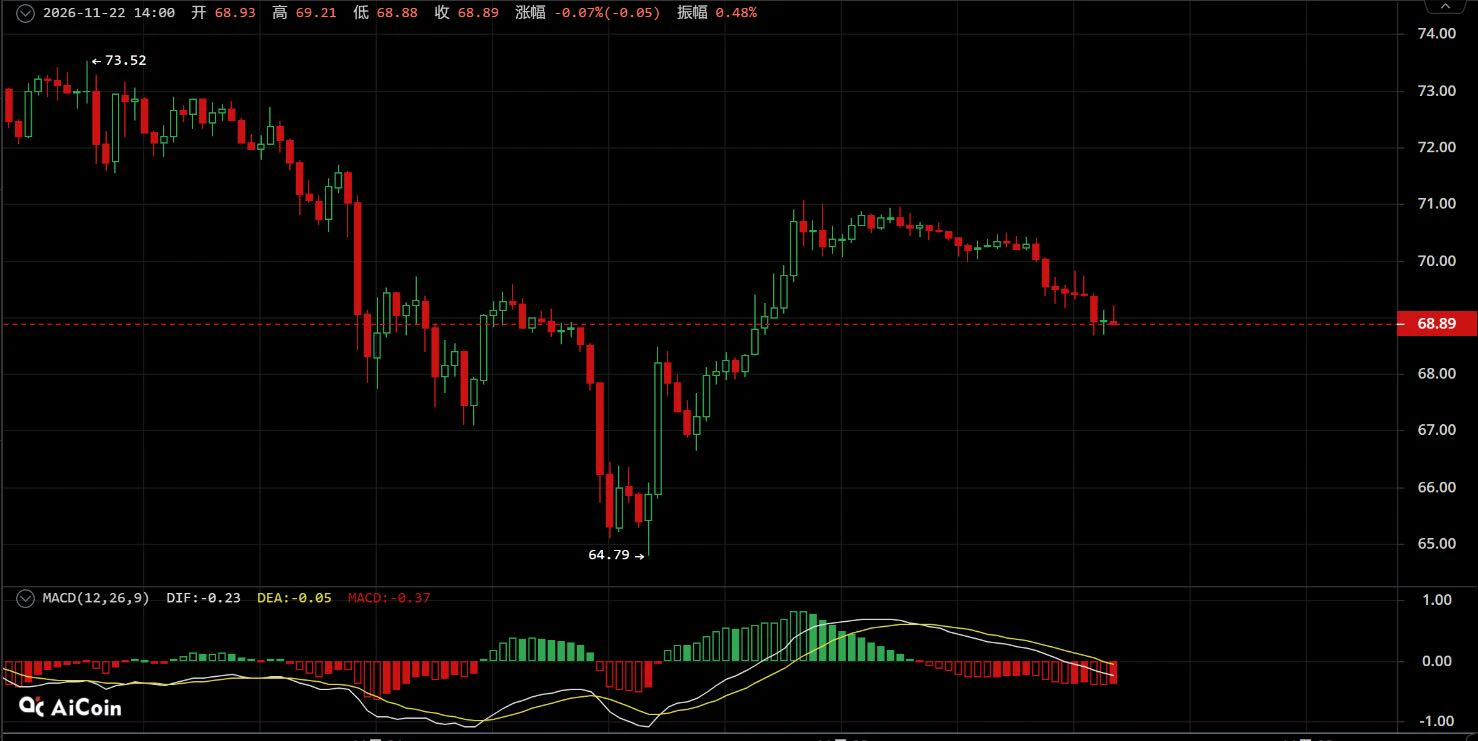
A-Long bit | November 22 $SOL Rebound tops out and downtrend resumes; short at higher levels to profit from volatility

【Trade Plan】
Short entry zone: Scale in on a rebound to 69.5-70.2
Stop-loss: Above 71.0
Take-profit targets: First target 67.0-66.5, second target 65.5-64.8

【Core Rationale】
The 30-minute move up from the 64.79 low is essentially an oversold rebound after a plunge. As a highly volatile altcoin, it lacks the fundamentals for an independent bull run. It followed the broader market up to the 70 mark, met resistance, and turned back down; the broader downtrend has not reversed a
post-image
SOL-0.77%
BTC-0.67%
Keep a close eye on the spot gainers list. These hot assets are worth watching, with the following target prices for the next phase:
$AIGENSYN target: 0.020 $NIGHT target: 0.050 $DODO target: 0.0450 ORCA target: 1.50 ETHFI target: 0.0550 COOKIE target: 0.01 DASH target: 47
My approach is simple: pick the spot coin you’re most bullish on, buy it, then avoid trading too frequently. Hold patiently until it reaches your take-profit target, and the gains will naturally materialize.
This does not constitute financial advice.
post-image
AIGENSYN+1.18%
NIGHT-3.10%
DODO+11.43%
🚨 CRYPTO MARKET: WHAT HAPPENS NEXT? 📊

🔥 Will Bitcoin Continue Its Recovery or Will Sellers Take Control Again?

The crypto market is showing a strong bounce after Bitcoin recently dropped near $55,000. BTC has recovered towards the $60,000 region, but the bigger question is whether buyers can maintain this momentum.

📊 MY MARKET OUTLOOK:

🟢 Bullish Scenario:

- BTC holds above $60K.
- Buyers push towards $62K resistance.
- Strong volume could support further recovery.
- Altcoins may follow Bitcoin's strength.

🔴 Bearish Scenario:

- BTC loses the $60K support area.
- Selling pressure in
BTC-0.67%
BITCOIN MELTDOWN EXPLAINED: AI Stock Crash, Macro Storm & Gate.io Strategy!
live-cover
LIVE1,646
BTC-0.67%
Load More

Join 40 M users in our growing community

⚡️ Join 40 M users in the crypto craze discussion

💬 Engage with your favorite top creators

👍 See what interests you

Trending Topics

BTCReboundFaces60KTest

2.1M Views30.1K Discussing

BTC rebounded from around $55,300 on November 21, briefly reclaiming $60,000 before pulling back to around $59,300. The $60K level is back in focus as traders assess whether the recovery can last. Is this rebound a sign of stabilization or a short-lived recovery? Would reclaiming and holding $60K be enough, or do you need confirmation from trading volume and fund flows?

PCEAndGDPDataNextWeek

258.5K Views2.6K Discussing

GateDirectIPOPhase3ANTAllocates92100Shares

820.4K Views5K Discussing

View More