Share your thoughts
placeholder
Article
$AVA Signal】Long + negative funding rate short squeeze and 1H support
$AVA Funding rate -0.5194%, order book bid/ask ratio 1.40, with thick bids below. OI is stable, and shorts continue to pay funding.
1H RSI 61.89, 4H RSI 74.36; the 4H MACD histogram at 0.0146 shows contracting bullish momentum, while the 1H MACD histogram at -0.0020 indicates a short-term pullback.
The latest 1H candle bid/ask ratio is 0.52, with selling pressure quickly absorbed. The 1H EMA20 at 0.2577 is far below the current price, leaving limited room for a pullback. The 4H Bollinger upper band at 0.2929 is resistance;
post-image
AVA+67.83%
BTC+0.44%
ETH+1.44%
SOL+3.13%
The market doesn’t explain itself; it just moves. Your job is simply not to make reckless moves.
When I checked the market right after lunch, $JCT faced strong selling pressure and low trading volume, so any rebound was an opportunity to short. I flagged a JCT short around 0.002429, then went back to work.
Now at 0.001621, +810.66% has been realized directly. Feels great, brothers—we didn’t endure this wave for nothing.
Close 80% first, and protect the remaining 20% at the entry price. Don’t get greedy for the last bit; if the sell-off continues, let the profits run, and don’t give them back
post-image
JCT+6.61%
SOL+3.13%
DOGE+1.38%
I had already finished complaining to my friends about this week’s market action, but now I have to take it all back—it’s a little awkward.
A few days ago, before bed, I saw $SCRT make another push. Every surge fell just short, with insufficient buying support, so I casually noted that there was no need to rush into SCRT shorts and to wait and see around 0.02694.
I woke up to 0.00772, a direct +1746.74% move. Those who were on board probably woke up laughing. Getting the timing right feels much better than keeping busy for nothing.
Take 80% off the table first, and move the remaining 20% to t
post-image
SCRT-7.75%
BTC+0.43%
ADA+3.48%
The market does not explain itself; it only moves. Your job is simply not to make reckless moves.
When I checked the chart after lunch, $AKE held firm after a pullback and buying pressure strengthened. I judged it worth waiting for, with just one reminder: hold once it stabilizes.
From 0.0101698 all the way to 0.0210384, it took off +2624.68%. Those on board should be grinning in their sleep. Time to enjoy a good meal.
Take 80% in profits first, protect the remaining 20% at the entry price, and let the profits run if it keeps surging.
Don’t let profits inflate your ego, and don’t despair over
post-image
AKE+10.83%
LAB+4.03%
ADA+3.48%
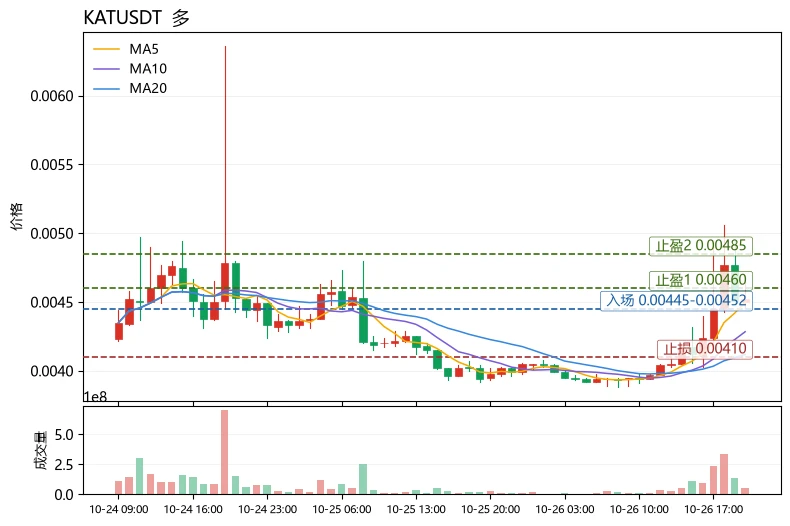
$MARSCOIN - Short-term
Entry: 0.1162 Take-profit 1: 0.1100 Take-profit 2: 0.1035 Take-profit 3: 0.0960 Stop-loss: 0.1225 The price is testing the upper boundary of the recent range; if buyers fail to sustain momentum, there is still room for a pullback.
post-image
MARSCOIN+30.75%
Breaking 🚨 U.S. Securities and Exchange Commission (SEC) Commissioner Hester Peirce warned that 24-hour stock trading is considered inevitable but has not been universally welcomed. 🚀 Market participants pointed to thin overnight order books, wider spreads, and increased back-office operational pressure as the main concerns. The shift could put pressure on brokerages, alter liquidity dynamics, and trigger regulatory scrutiny. Investors may face higher costs and execution risks outside regular trading hours. 📊 Stay tuned for further updates. ⚡ $ON, $AVA, $ONE
post-image
ON+2.57%
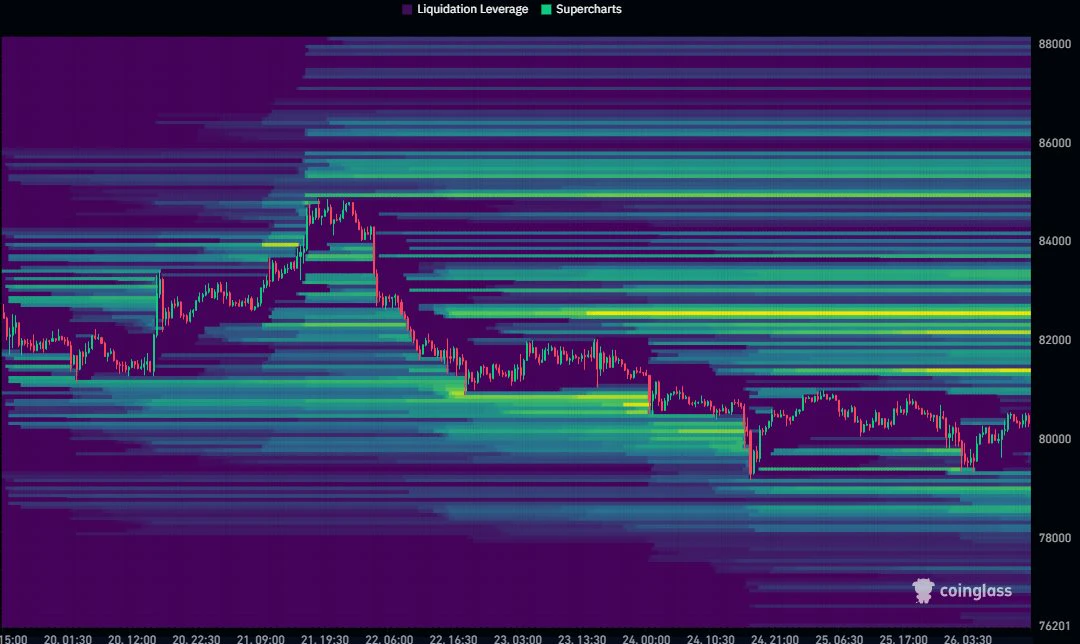
📈 Bitcoin Road to $90,000 May Include One More Major Higher Low
Bitcoin’s Current Range Mirrors a Key 2023 Structure as $70K–$90K Levels Come Into Focus.
Bitcoin’s long-term chart shows a recurring sequence of rally, consolidation, downside liquidity sweep, and renewed expansion. The current structure is developing between roughly $60,000 and $84,000, following the decline from the chart’s major high near $124,000–$126,000.
The chart also highlights a 2023 structure as a historical comparison. The price levels and sequence are similar in form, although the present structure is occurring at su
post-image
BTC+0.44%
$CROSS Signal】Long + 1H pullback/4H volume expansion
$CROSS 1H surged to 0.18999 before pulling back; current price is 0.17976, touching the 4H Bollinger upper band, with the lower band at 0.1005 and EMA20/50 in bullish alignment. 1H RSI is 73.51, and 4H RSI is 77.74. Funds have not exited the overbought zone, order book depth imbalance is 25.62%, the bid-to-ask ratio is 1.69, and buy orders are densely placed below. The 4H MACD histogram is expanding at 0.0050, while the 1H histogram is contracting at 0.0035, indicating slowing short-term momentum and a structure for entering long on a pullb
post-image
CROSS+34.20%
BTC+0.44%
ETH+1.44%
SOL+3.13%
market update
live-cover
LIVE979
$NVDA The daily (1D) candlestick chart of NVDA (NVIDIA) stock and key support/resistance levels are shown.
​Key Levels and Session Status
​Closing Price: 219.34 USD (+2.54%)
​After-hours: 219.42 USD
​Critical Levels
​Upper Resistances: The 220.57–226.68 USD range is the first significant resistance zone. If this level is breached, 236.54 USD and then 252.51 USD could come into play.
​Lower Supports: The 215.64 USD level currently serves as support. Below it are 213.90 USD and the main support zone at 210.71 USD.
​If pullbacks remain limited, closes above 220.57 USD could strengthen the upward
post-image
NVDA+2.56%
Layout for Bitcoin, Ethereum, and Dogecoin
live-cover
LIVE1,632
After $EDGEX surged to 0.6225, I took 70% off first instead. It’s not that I’m bearish; this level is right at the key prior-high resistance, so the risk-reward of chasing further has deteriorated. The move up from 0.6001 formed a breakout-retest-breakout structure, with each pullback holding at a higher key level and volume expanding on the breakouts.
The key levels are clear now: the prior high is the first key level. If price can retest it on declining volume after the breakout and hold above the upper boundary, that will be the new entry setup; if it simply spikes above and falls back, it
post-image
EDGEX+3.24%
BTC+0.43%
ADA+3.48%
I don’t dare say anything now, afraid it’ll go back down as soon as I do. I’ll just quietly watch for now.

When I checked the chart after lunch, the $ONE key level held, funds quietly entered, buying pressure strengthened, and I suggested going long with a small position. Entry: 0.000713, current price: 0.001533, +2266.14%. This feels so good—I can treat myself to a nice meal.

Have a strategy before the session, discipline during the session, and reflection after the session.

Take profit on 80% first, and move the protection on the remaining 20% to the entry price. Don’t let profits tur
post-image
ONE+118.69%
ADA+3.48%
XRP+0.01%
$BTC Signal】Short + 1H moving average resistance, short the rebound
$BTC 1H price 76239.6, RSI 44.85, 4H RSI 43.90, with the rebound yet to enter the overbought zone. EMA20/50 are overhead at 76441/76462, capping the price, while the 1H MACD histogram is expanding downward at -43.0275. The 4H Bollinger middle band is 76565.7050, with the price trading below it. Order book depth imbalance is 39.25%, and aggressive buying is inconsistent. Funding rate is 0.0097%, OI is stable, and short-side crowding is not high. The risk-reward ratio in this area is acceptable; position control is more importa
post-image
BTC+0.43%
After $PONS surged to 0.6571, I instead took 70% off first. It’s not that I’m bearish, but this level is right at the key prior-high resistance, making it less cost-effective to keep chasing. The move up from 0.6155 formed a breakout-pullback-breakout structure, with each pullback holding at a higher key level and volume expanding on the breakouts.

The key levels are clear now: the prior high is the first key level. If, after breaking out, price can pull back on declining volume and hold the upper boundary, that would be the new entry setup; if it only surges above it and then falls back, it
post-image
PONS+21.88%
SNDK+4.66%
ADA+3.48%
This was once the best coin on chain
What happened?
post-image
ON+10.66%
$ETH Signal】1H momentum weakening, short at the resistance zone
$ETH 1H RSI 47.74, MACD green bars expanding, current price 2437.85 below EMA20/50, latest hourly buy ratio 0.39.
4H red bars shrinking, upper Bollinger Band at 2522.3532 remains unbroken, 1H middle band at 2448.4950 providing resistance. Order book bid/ask 2.47, lower support orders are not thin, so chasing shorts could easily get swept by a rebound; place orders at 2430.5365 - 2437.8500, stop loss at 2462.2285, with sufficient room.
🎯Direction: Short
⚡Entry/limit order: 2430.5365 - 2437.8500
🛑Stop loss: 2462.2285
🚀Target 1:
post-image
ETH+1.45%
I’m taking a long on $ARGUS because the 4H chart is holding the 0.0148–0.0160 support zone and price is starting to bounce from this area.
My setup:
Entry: 0.0160–0.0165
DCA 1: 0.0154–0.0158
DCA 2: 0.0148–0.0152
TP1: 0.0250
TP2: 0.0285
TP3: 0.0315–0.0330
SL: Below 0.0145
Why I’m bullish: price has tested this support area several times and buyers are still defending it. The main resistance is around 0.0200–0.0220. If ARGUS breaks and holds above that zone, the next upside targets can open quickly.
The bullish setup stays valid while 0.0148 support holds.
$ARGUS ‌
post-image
ARGUS-5.18%
  • 2
The Fear & Greed Index remains at 50, BTC moved just +0.57% over 24 hours, but $PUMP surged +13.84%—the broader market barely moved while it ran ahead on its own, which is the most unusual feature of today’s market. This is not a broad-based rally, but localized fund concentration.
Technically, $PUMP is currently at 0.004096, above MA5 (0.0039862) and MA20 (0.0039363), with the moving averages in a bullish alignment; the MACD histogram at +1.353e-06 remains bullish, while RSI at 72.4 has entered overbought territory. The price has broken above the Bollinger upper band at 0.00407141, and the 13
post-image
COTI+48.41%
The bullish thesis for $FF can play out, not by guessing the top, but because of consecutive false breakouts at the highs. After the previous high was swept by a wick, the price failed to hold and fell back into the range, indicating that overhead holders are distributing and that buying pressure cannot absorb the supply.
I’m watching for a pullback confirmation. After breaking below the range low, the rebound failed at the range high; the moving averages are starting to turn down, and volume has not increased. This kind of rebound looks more like an opportunity to add to or take profit on sho
post-image
FF-3.78%
DOGE+1.38%
ETH+1.45%
Load More

Join 40 M users in our growing community

⚡️ Join 40 M users in the crypto craze discussion

💬 Engage with your favorite top creators

👍 See what interests you

Trending Topics

GateTopsStockPerpetualCoverage

36.31k Views1.88k Discussing

According to the latest DefiLlama report, Gate has listed 385 stock-related perpetual contracts, ranking first in coverage; average daily volume is about $1.15B and average open interest about $738M, both ranking third in the industry; liquidity depth for its five highest-volume contracts — SNDK, SKHYNIX, SPCX, SOXL, and MU — ranks first across the board. How do you view Gate leading in both coverage breadth and liquidity depth? [👉 Full Report](ttps://defillama.com/research/spotlight/deep-enough-trade-gate-case-tokens-stocks)

GateTrenchesExclusive0GasTrading

46.32k Views870 Discussing

FedHikes25bpsForFirstTimeIn3Years

32.64k Views8.52k Discussing

View More