Square
Following
Hot
News
Notifications
Profile
Share your thoughts
placeholder
Article
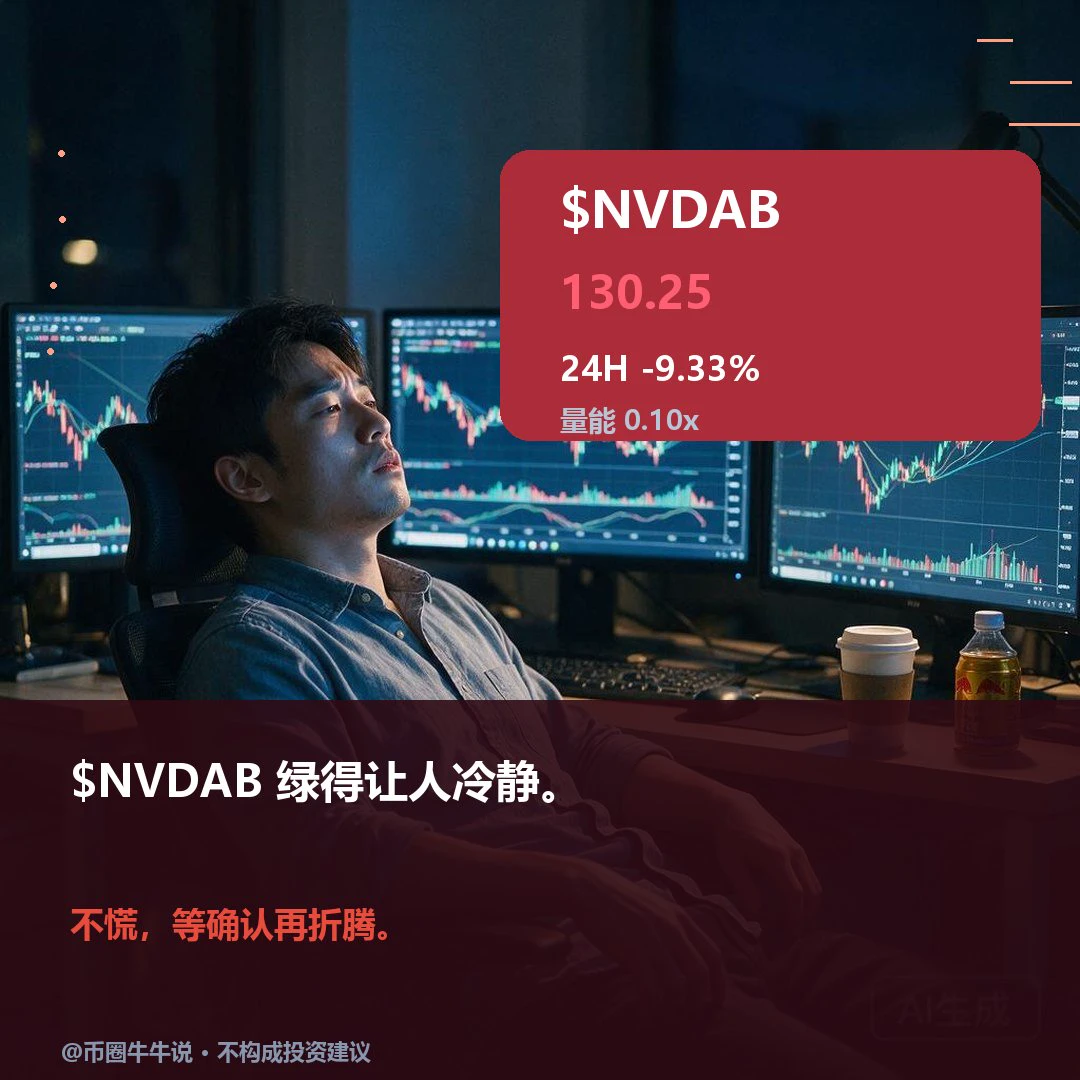
$NVDAB is currently at 130.25, down 9.33% over 24H.
The RSI is oversold, but the trend is weak and volume is extremely low.
With a drop like this, I really don’t dare buy the dip—catching a falling knife hurts.
For now, watch the 124.91 support; only if it breaks should you brace for the next leg down.
The condition for a rebound is simple: if it can’t hold above the 144.85 resistance, don’t expect a recovery.
With volume this low, don’t trust a one-off break above the level—wait for confirmation.
This is not investment advice.
#NVDAB
post-image
261121
Until Bitcoin's weekly chart turns bearish, all trades are short-term. The market is slightly weak; set stop-losses on both long and short positions!
BTC resistance levels
60012/61073/61899
BTC support levels
57890/56829/56003
ETH resistance levels
1652/1681/1704
ETH support levels
1594/1565/1542
Place the stop-loss slightly beyond the third price
Keep intraday trades below 5% of your position
Livestreams are held in the afternoon and evening. Follow my homepage to find me. #美联储或需加息50个基点
post-image
BTC-0.67%
ETH-1.26%
Trenches
FIONA
F
bade
b
FIONA
B34n...pump
Market Cap
$.
Change
.
24h Vol
$.
Holders
.
PIEVERSE
P
bade
b
PIEVERSE
0x0e...25a9
Market Cap
$.
Change
.
24h Vol
$.
Holders
.
mihao
m
bade
b
mihao
4Cxj...pump
Market Cap
$.
Change
.
24h Vol
$.
Holders
.
PROS
P
bade
b
PROS
0x8b...9832
Market Cap
$.
Change
.
24h Vol
$.
Holders
.
CLAUDIA
C
bade
b
CLAUDIA
2j5S...W2ZM
Market Cap
$.
Change
.
24h Vol
$.
Holders
.
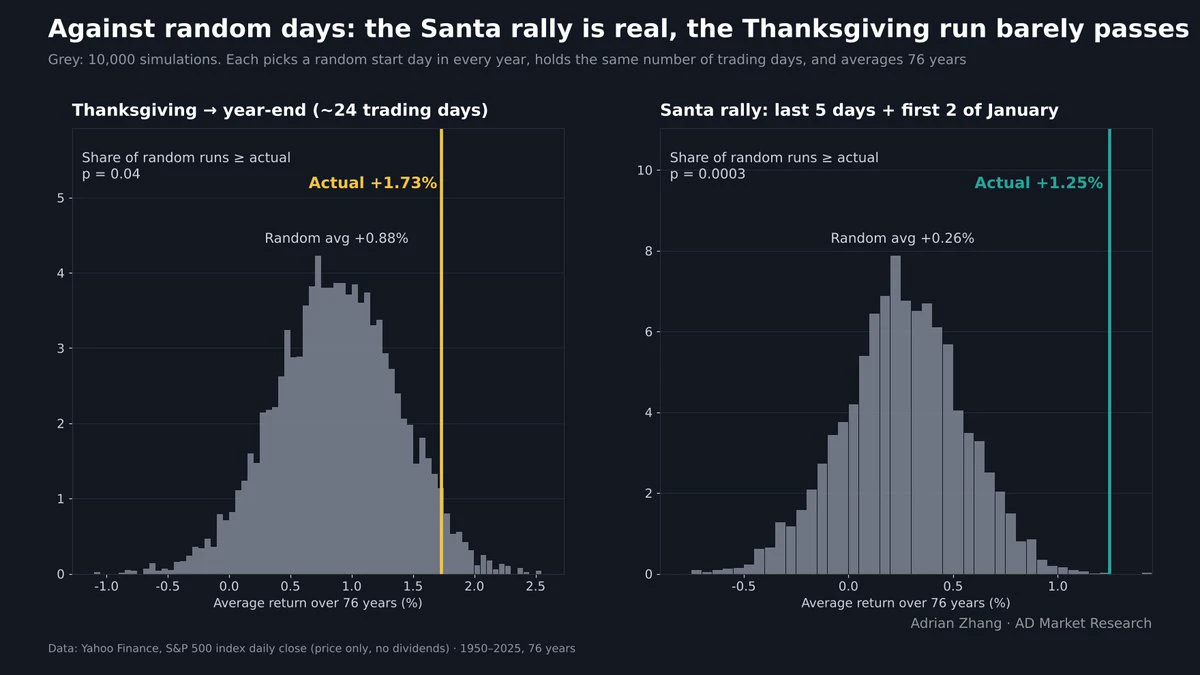
Is the "Santa Claus rally" real?
I tested 76 years of S&P 500 data (1950–2025).
Short answer: yes, it's real. It's also fading, and almost useless. A thread:
post-image
SPX500+0.19%
Review: How I captured $IRYS 1.5x profit

A few days ago, I saw IRYS surge and then pull back, with clear resistance at the top. I decisively opened a 20x short at 0.02395. With the broader market weak, the price fell smoothly to 0.02208.

Entry logic: The price broke below key support, so I went short with the trend. My return is now +153.73%—a perfect close.

In hindsight, this coin’s high leverage makes it extremely risky. Although I captured a big gain, it may be due for a short-term oversold bounce.

If you missed the trade, don’t rush in. Wait for a rebound to stabilize before reassessi
IRYS-21.17%
SNDK-15.99%
AKE+6.07%
ANT-8.68%
Eat, drink, and don’t let anything get to you.
post-image
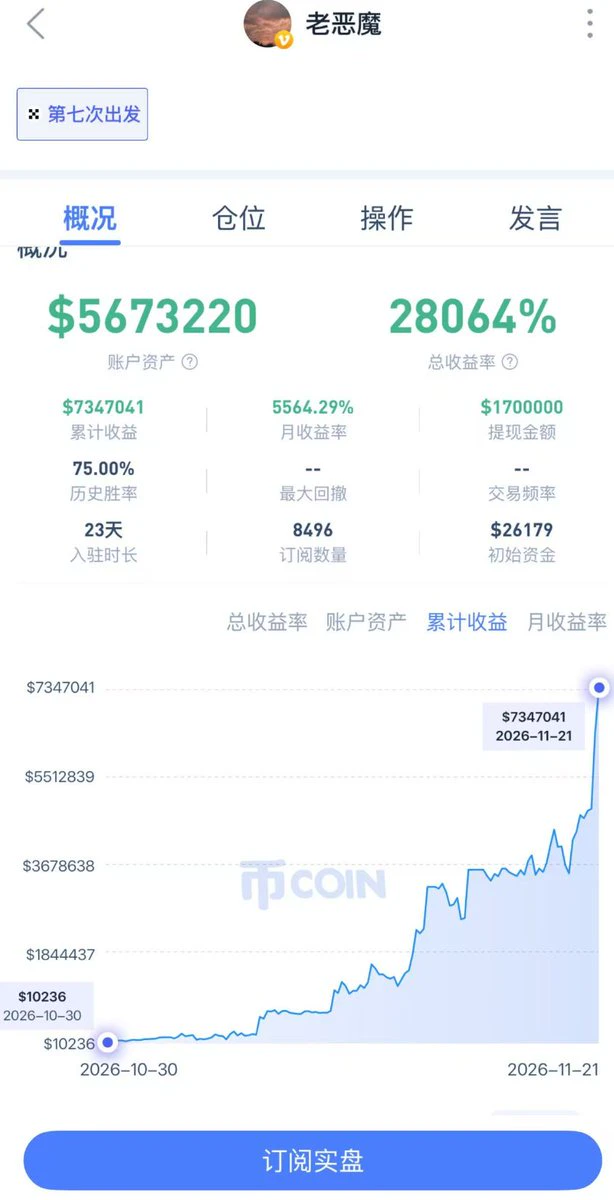
$20,000 --->35 million RMB
Only 3 weeks
Langlang has its own merits, but old demons have theirs too.!!
post-image
GOOD MORNING Market update
live-cover
LIVE2,109
HYPE+0.24%
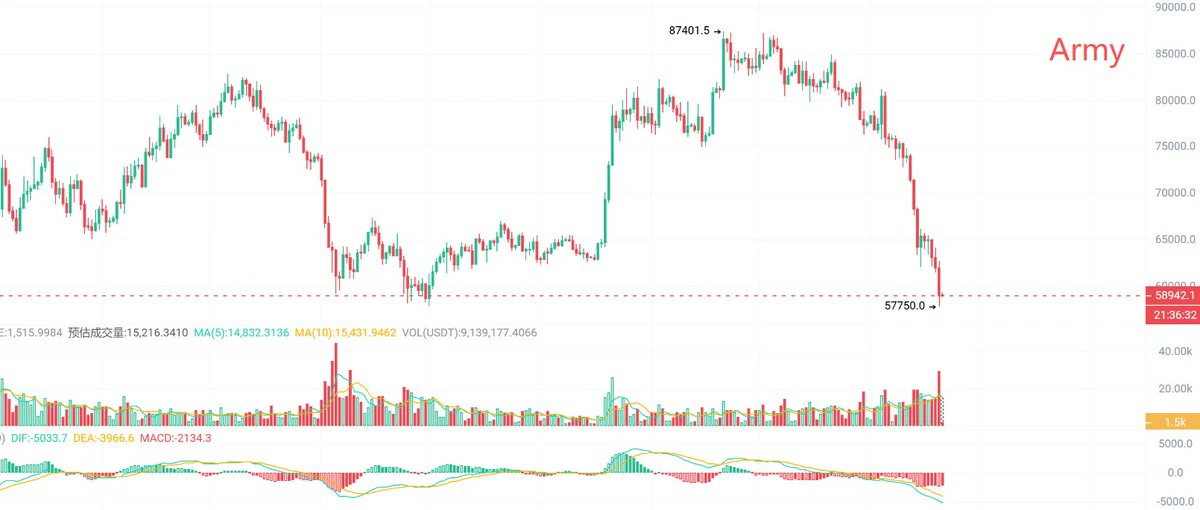
“From 87401 to 57750: A Pricing Experiment in Greed and Fear”
bitcoin:native has plunged nearly 34%, from its peak of 87401 to the depths of 57750.
This isn’t a simple pullback. It’s the market redistributing holdings in the harshest way possible.
MACD continues to weaken, with both DIF and DEA deep in negative territory and no signs of momentum recovering yet.
But remember: A surge in trading volume amid panic often means some are exiting—and others are stepping in to buy.
#K线 never lies, but emotions do.
While everyone is calculating their losses, the real players are already measuring the
post-image
BTC-0.67%
  • 1
Woke up to a surprise—pretty nice
post-image
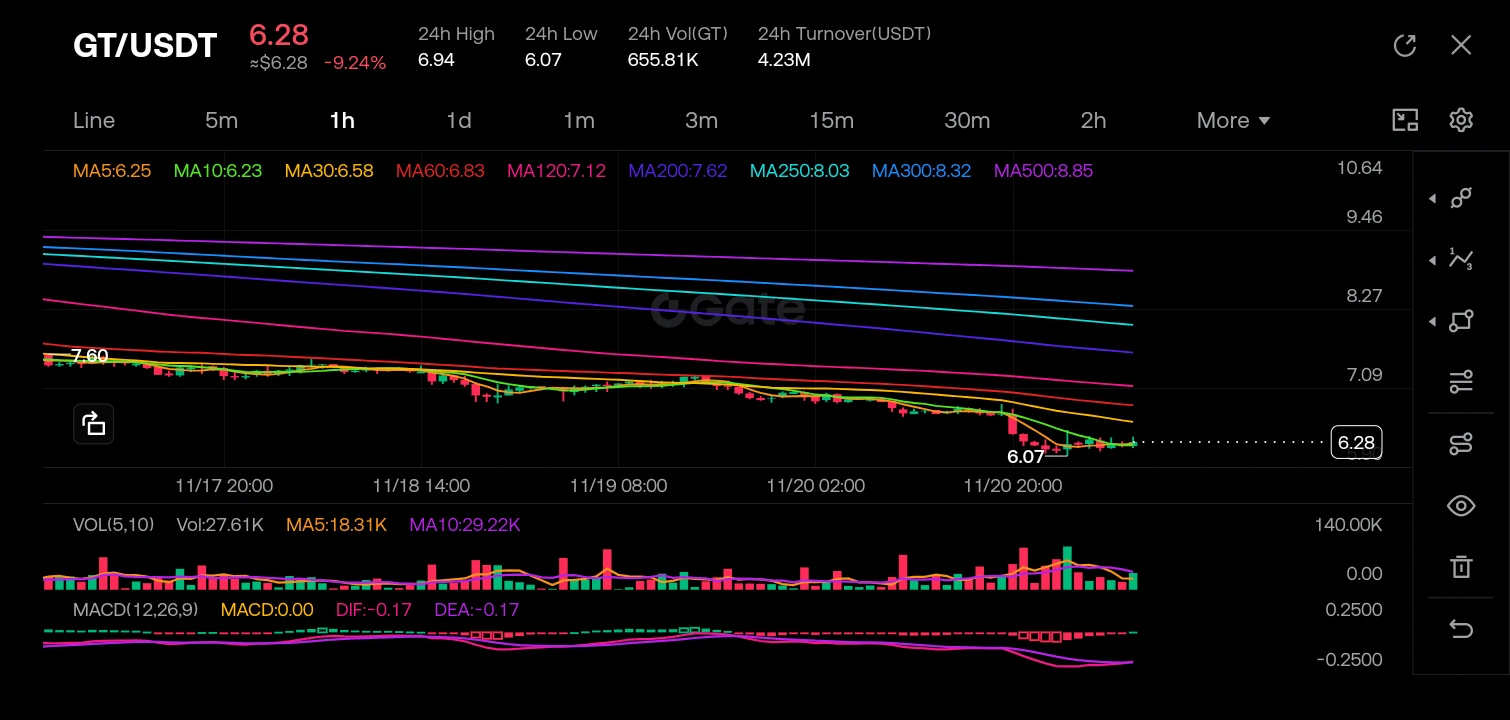
$GT ‌

GT/USDT is currently in a strong downtrend, trading at 6.28 (-9.24%). The price has aggressively broken below key moving averages and is currently testing a critical support zone after a sharp drop from the 7.00 level. The market sentiment is bearish.

Key Levels

· Resistance: 6.58 (MA30) and 6.83 (MA60).
· Current Support: 6.07 (Recent swing low).
· Critical Pivot: 6.28 (Current price action).

Kline Deep Analysis

· Moving Averages: The chart shows a classic "bearish alignment." Price is far below the MA200 (7.62), and shorter-term MAs are sloping downward, indicating heavy selling
post-image
GT-2.41%
  • 1
  • 1
With low leverage, it’s easier to hold onto the position.
I’m also still holding a high-leverage short.
The only way to buy the dip against the trend is to strictly use stop-losses and control position size.
The market is really bad
I’m looking for a rich older woman
post-image
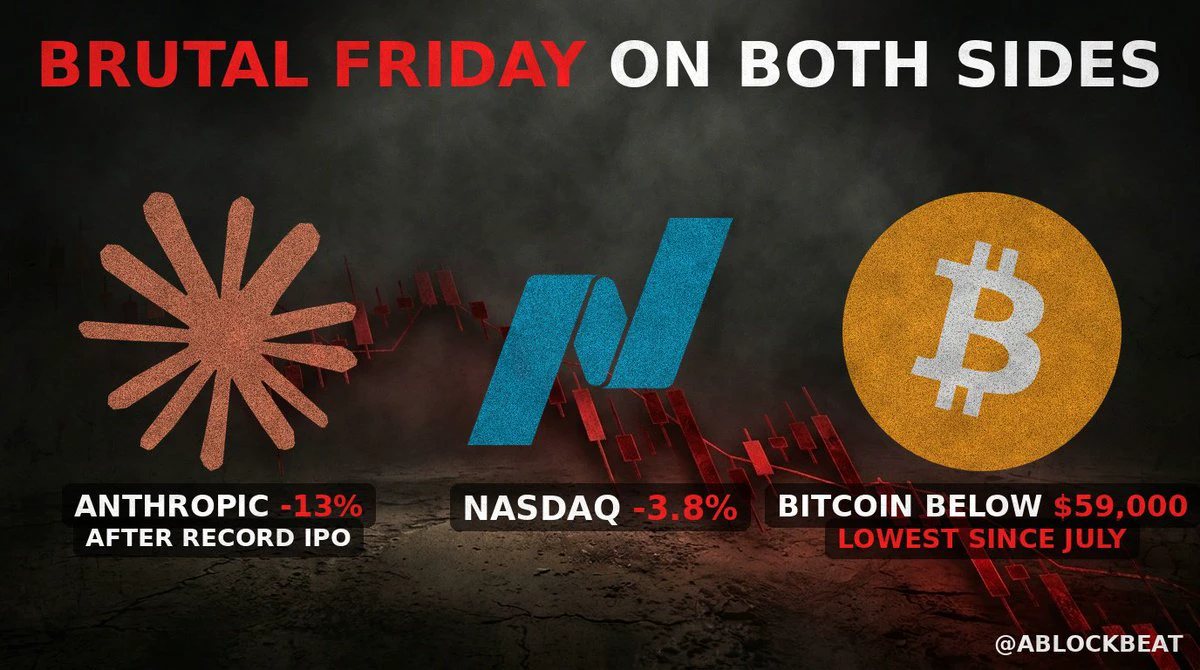
Bitcoin broke below $59,000 overnight, close to its July low. The Nasdaq fell 3.8% as Anthropic lost 13% a day after its record IPO. A brutal Friday on both sides.
post-image
BTC-0.67%
ANT-8.68%
  • 4
  • 2
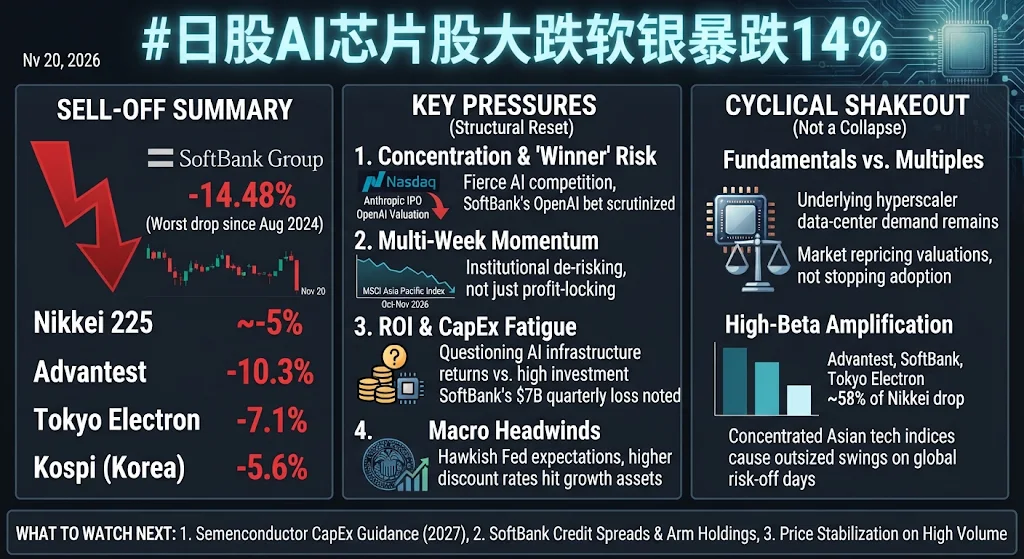
#日股AI芯片股大跌软银暴跌14%
The Friday, November 20, 2026 sell-off—which sent SoftBank Group down 14.48% (its worst single-day drop since August 2024) and dragged the Nikkei 225 down roughly 5% alongside steep losses in Advantest (-10.3%), Tokyo Electron (-7.1%), and South Korea's Kospi (-5.6%)—looks much more like a structural valuation reset than routine profit-taking.

While extended rallies always invite short-term position squaring, several deeper pressures converged at once:

1. Why It Looks Deeper Than Routine Profit-Taking

Concentration and "Winner" Risk: The sell-off followed rival AI develop
post-image
JPN225-5.14%
  • 6
I used to think certain things were out of reach, but the crypto market, especially $BTC , can always shatter our assumptions with its actual performance.
😅
Look at the recurring patterns on the chart:
In 2021, Bitcoin's maximum drawdown from its all-time high was close to 70%.
If this cycle once again repeats a similar historical script, $BTC could face an extreme scenario of dropping to around $37,000.
Of course, this is not a definitive prediction, but merely a hypothesis extrapolated from past cycles.
In the current market environment, no possibility should be taken lightly.
Do you think
post-image
BTC-0.67%
Gate has distributed ANT shares to eligible users and opened trading. After
live-cover
LIVE2,429
BTC-0.67%
ETH-1.26%
Ethereum is moving sideways with a choppy upward bias; enter long at 1617
post-image
ETH-1.26%
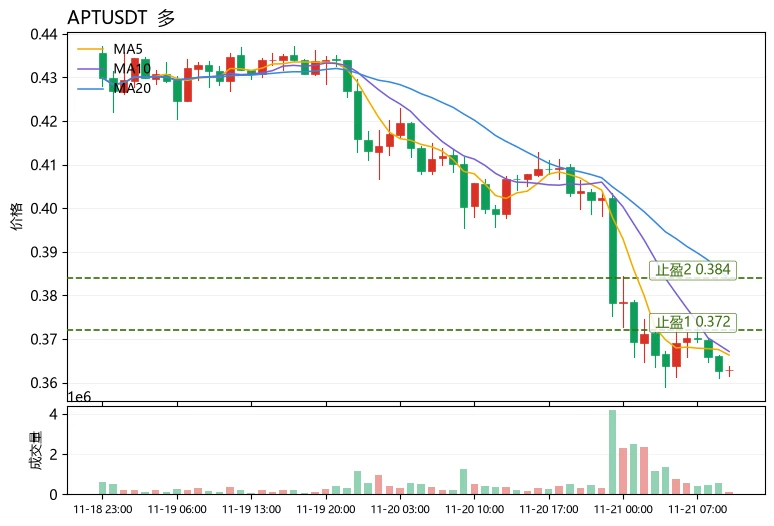
The most unusual detail in today's market is not the decline, but the funding rate: $APT fell 9.61% over 24 hours, with the price hugging the Bollinger lower band near 0.3466, yet the funding rate is -0.0056%, meaning shorts are continuously paying to hold positions. A new price low, negative funding, and an RSI of just 24.1 are a classic signal of “crowded shorts during a decline,” not an accelerating downtrend.
Here's a reusable method: use moving-average alignment and RSI positioning to judge whether a decline is “healthy.” A healthy decline sees the price moving down along the MA5, the MA
post-image
APT-1.51%
SUI-1.05%
ETH-1.26%
Pigs have something to look forward to now
When selling the meat, specify that they were raised on French fries😎
Load More

Join 40 M users in our growing community

⚡️ Join 40 M users in the crypto craze discussion

💬 Engage with your favorite top creators

👍 See what interests you

Trending Topics

BTCBreaksBelow60K

2.1M Views28.8K Discussing

BTC fell below $60,000 on November 20 for the first time since July, alongside a tech stock selloff and broader pressure on risk assets. Will $60K become resistance, or can BTC quickly reclaim it? What price or volume signals would convince you that selling pressure is easing?

GateDirectIPOPhase3ANTAllocates92100Shares

722.8K Views4.7K Discussing

NvidiaDropsNearly14Percent

303.5K Views7.5K Discussing
View More