Square
Following
Hot
News
Notifications
Profile
Share your thoughts
placeholder
Article
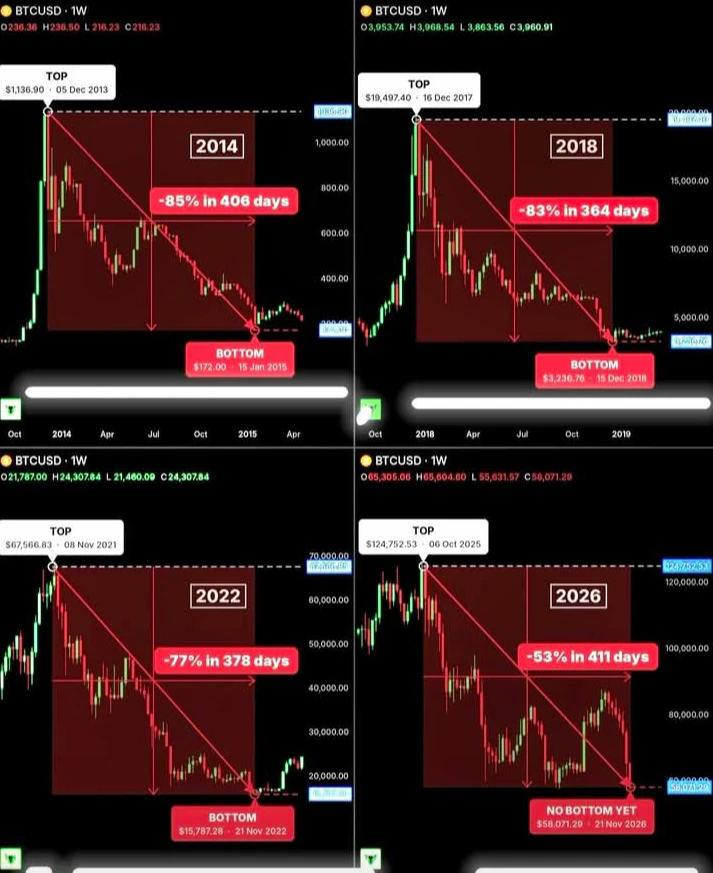
BITCOIN IS NOW IN THE LONGEST BEAR MARKET IN ITS HISTORY...

Every past bear market ended within 13 months of the top:

• 2014: -85% in 406 days 📈
• 2018: -83% in 364 days 📈
• 2022: -77% in 378 days 📈

Today, Bitcoin is on day 411, down 53% from its $124,753 peak.

That's already longer than every bear market before it.

If history repeats, the bottom could be very close.

#crypto #altcoins #ethereum #solana
post-image
BTC-0.67%
ETH-1.26%
SOL-0.77%
#CookBacksFurtherRateHikes

Federal Reserve Governor Lisa Cook Supports More Interest Rate Hikes as Inflation Remains High!

The US economy is facing another important moment. Federal Reserve Governor Lisa Cook believes that more interest rate increases may be needed to control rising inflation. She says that inflation is still too high and there is not enough evidence that price increases are slowing down.

This news is important for financial markets because interest rates can affect almost every major investment market, including stocks, Bitcoin, Ethereum, and oth
post-image
BTC-0.67%
ETH-1.26%
  • 3
Trenches
FIONA
F
bade
b
FIONA
B34n...pump
Market Cap
$.
Change
.
24h Vol
$.
Holders
.
PIEVERSE
P
bade
b
PIEVERSE
0x0e...25a9
Market Cap
$.
Change
.
24h Vol
$.
Holders
.
IDOL
I
bade
b
IDOL
0x3b...ab07
Market Cap
$.
Change
.
24h Vol
$.
Holders
.
CLAUDIA
C
bade
b
CLAUDIA
2j5S...W2ZM
Market Cap
$.
Change
.
24h Vol
$.
Holders
.
mihao
m
bade
b
mihao
4Cxj...pump
Market Cap
$.
Change
.
24h Vol
$.
Holders
.
🎯 BITCOIN MELTDOWN EXPLAINED: AI Stock Crash, Macro Storm & Gate.io Strategy!
live-cover
LIVE1,571
BTC-0.67%
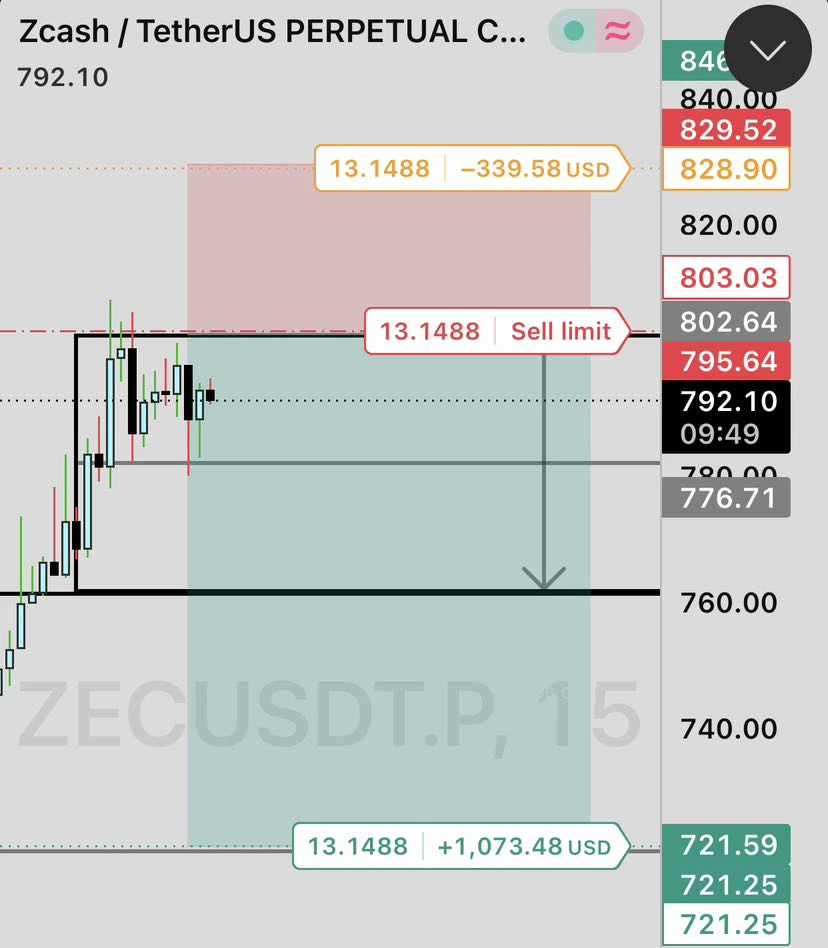
$ZEC Short idea. 15m chart. 📉

Price is approaching a heavy resistance block around 802. If the sellers defend this area, we could see a sharp drop toward the lower targets.

Entry: 802.64
SL: 828.90
TP: 721.59

Keeping this setup on the radar. Are you planning to short this? #Zec #$ZEC #ZEC: #ZEC,
post-image
ZEC+1.29%
Pat Dorsey’s economic moats are not just about high margins today.
The lasting advantage is a structural barrier – brand, switching costs, network effects, or cost advantages – that keeps competitors from eroding returns for years.
Investors who buy the temporary high-return story without the moat usually discover the returns were never durable.
post-image
🚨 FORMER RIPPLE EMPLOYEE IS BUYING MILLIONS OF DOLLARS IN $FLR ?! 🤯
In this video, I'm showing you my SHOCKING research into a former Ripple employee's balance to see what it reveals about his crypto investments..
If you hold $FLR, watch this!! 👇
🔗
post-image
FLR-0.24%
Who would’ve thought it would bounce back like this? If you want in, all you can do is chase it; another bunch of people trying to buy the bottom and call the top got wiped out
post-image
  • 2
#BTCETFOutflowsExtendTo3Days

Bitcoin ETFs are facing another challenging moment as outflows continue for three consecutive days. This development is attracting attention from investors and traders who are closely watching institutional money flows.

ETF outflows can indicate that some investors are reducing their exposure to Bitcoin. This may create additional selling pressure and affect market confidence, especially when the overall crypto market is already weak.

However, ETF outflows do not automatically mean Bitcoin will continue falling. Market sentiment, tr
BTC-5.94%
  • 3
$BTC $BTC $ETH $GT Hold for 3 days and you'll make a 15% profit. Don't miss out
post-image
BTC-0.67%
ETH-1.26%
GT-2.41%
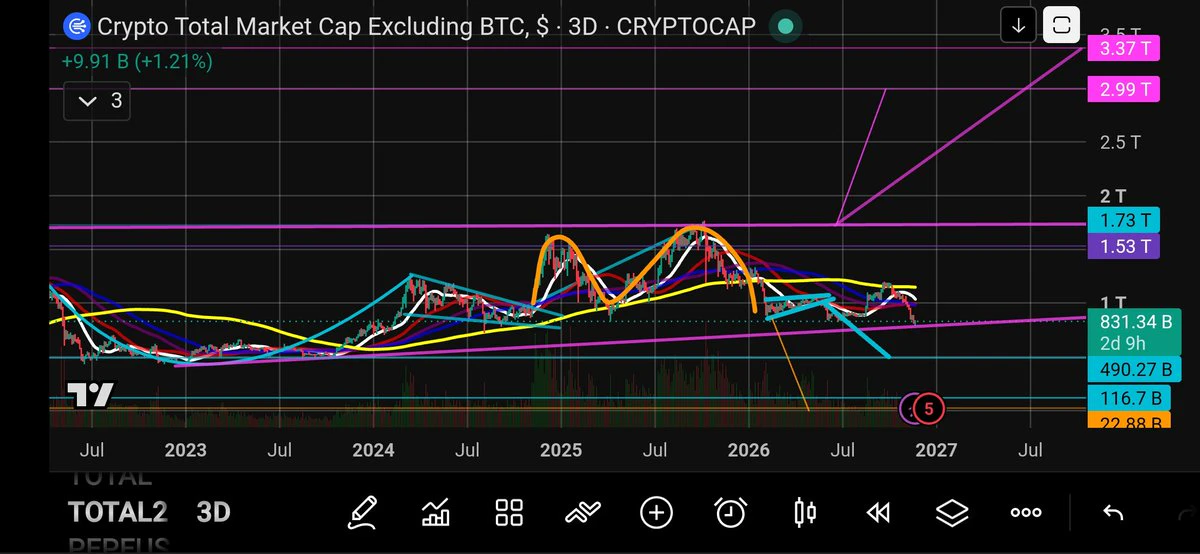
$TOTAL 2 Marketcap EXCLUDING $BTC 🚨
3D Chart Analysis 🔎
The bulls have been able to defend this area 4 times already. Will they be able to do it a 5th time?
The pink converging trendlines appear to be forming a very large ascending triangle. This is a handle to a very large cup and handle pattern.
The bulls will want to defend this zone of $832B-$722B or risk collapse to $490B.
A potential rebound to the upside is looking quite possible.
If the top pink trendline of the ascending triangle is broken to the upside at $1.75T. Then the targets of $2.99T and $3.37T will be activated.
Yes we are
post-image
BTC-0.67%
ETH-1.26%
SOL-0.77%
Please someone should help me check the price of $PI and $HAMSTER
post-image
PI-9.45%
HAMSTER-6.95%
$SOXS Look at the candlesticks from the past few days in reverse and it becomes crystal clear: the tails along the bottom get shorter with each candle, and the wicks along the top do too. A shorter lower wick means the people testing lower prices have called it a day; a shorter upper wick means the people pushing up are only willing to stick out half a hand.

Both ends are shrinking, leaving only the body rising. This is called an upward Bollinger Band squeeze, the most typical pattern: nobody is dumping, nobody is running, volume is like a rising tide, and the price climbs on its own momentum
SOXS+1.46%
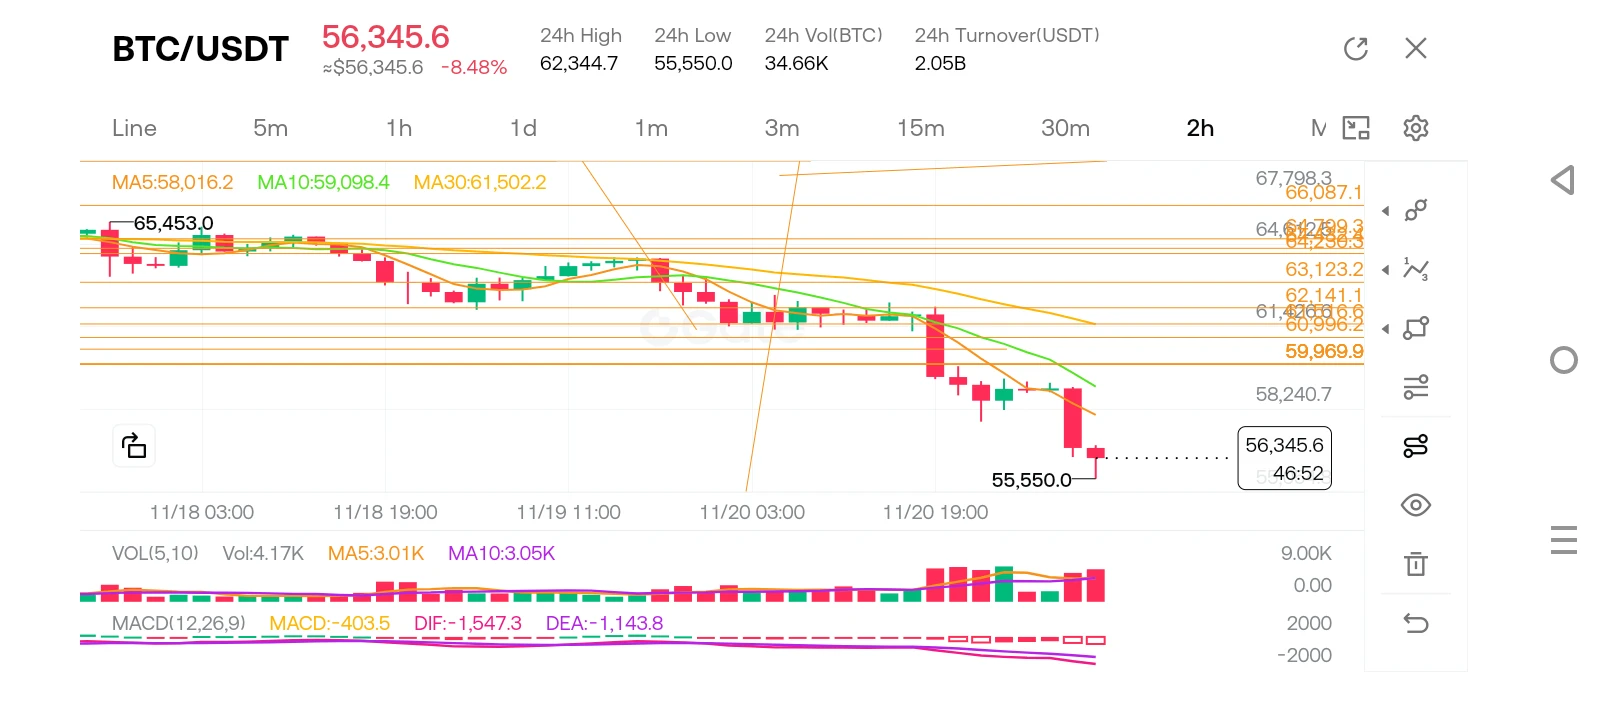
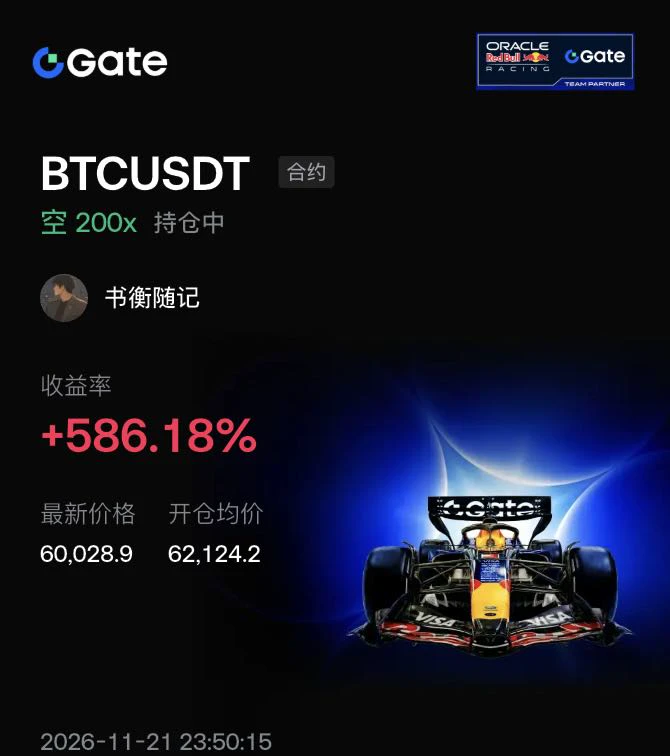
$BTC It has rebounded to around 60000, so why am I still holding a short position?

The short position I opened around 62124 is currently up nearly 6x. I chose to go short mainly based on the 4-hour structure. The price repeatedly failed to rebound, with each high lower than the last, while the short-term moving averages remained capped by the medium-term moving averages above, indicating that bears had consistently been in control.

BTC later fell below 62000, and the move clearly accelerated, reaching a low near 55105. This decline largely matched my expectations.

The price has now rebounde
post-image
BTC-0.65%
ETH-1.23%
SOL-0.74%
  • 1
First thing to do in the big city: take off my long johns!!!
Finally done with everything and eaten my fill. Good night 😴
#Zec #WCTCS9 #ShareWeekly
CRASHES BELOW $800! Is This a Golden Buying Opportunity or Could Another 20% Drop Be Coming?

Zcash (ZEC) is facing intense selling pressure, and the latest decline has created serious concerns among spot investors and futures traders. The most important question right now is whether this is a temporary correction that could create an attractive buying opportunity or the beginning of another major downward move.

According to the latest available market snapshot, ZEC was trading around $736.22, down approximately 16.99% in 24 hours and 21.01% over seven days. Its 24-
btc
live-cover
LIVE1,272
ETH-1.26%
BTC-0.67%
SOL-0.77%
#BTC跌至9月以来新低 BTC Under Global Liquidity Withdrawal: After Falling Below the 200-Week Moving Average, Is $57.8k the Bottom or Just a Waystation?

The most painful thing about this decline is not how far prices have fallen, but that it offers no chance to catch your breath. U.S. stocks, gold, silver, copper, and crypto assets have almost all fallen. From November 19 to 20, spot gold briefly dropped to around $3,525 per ounce, its lowest level since September 2025, bringing its cumulative decline this quarter to about 15%; silver fell to $41.25, platinum to $1,299, and LME copper lost nearly 9% f
NVDA-13.84%
$ANT
Yesterday, it was still the king of AI

Today, it nearly fell back to square one

Anthropic taught investors a lesson on just its second day as a public company

Holy shit

Guys

This plot is way too damn intense

November 19

Anthropic officially made its debut on the U.S. stock market

Its IPO price was $83

It opened at $111.5

At one point during the day, it topped $115

It still closed up 17% on its first day

What was the market saying at the time?

The AI revolution is here

Claude is about to take off

Everyone was bullish

Everyone was hyping it up

It was as if buying Anthropic
post-image
ANT+0.00%
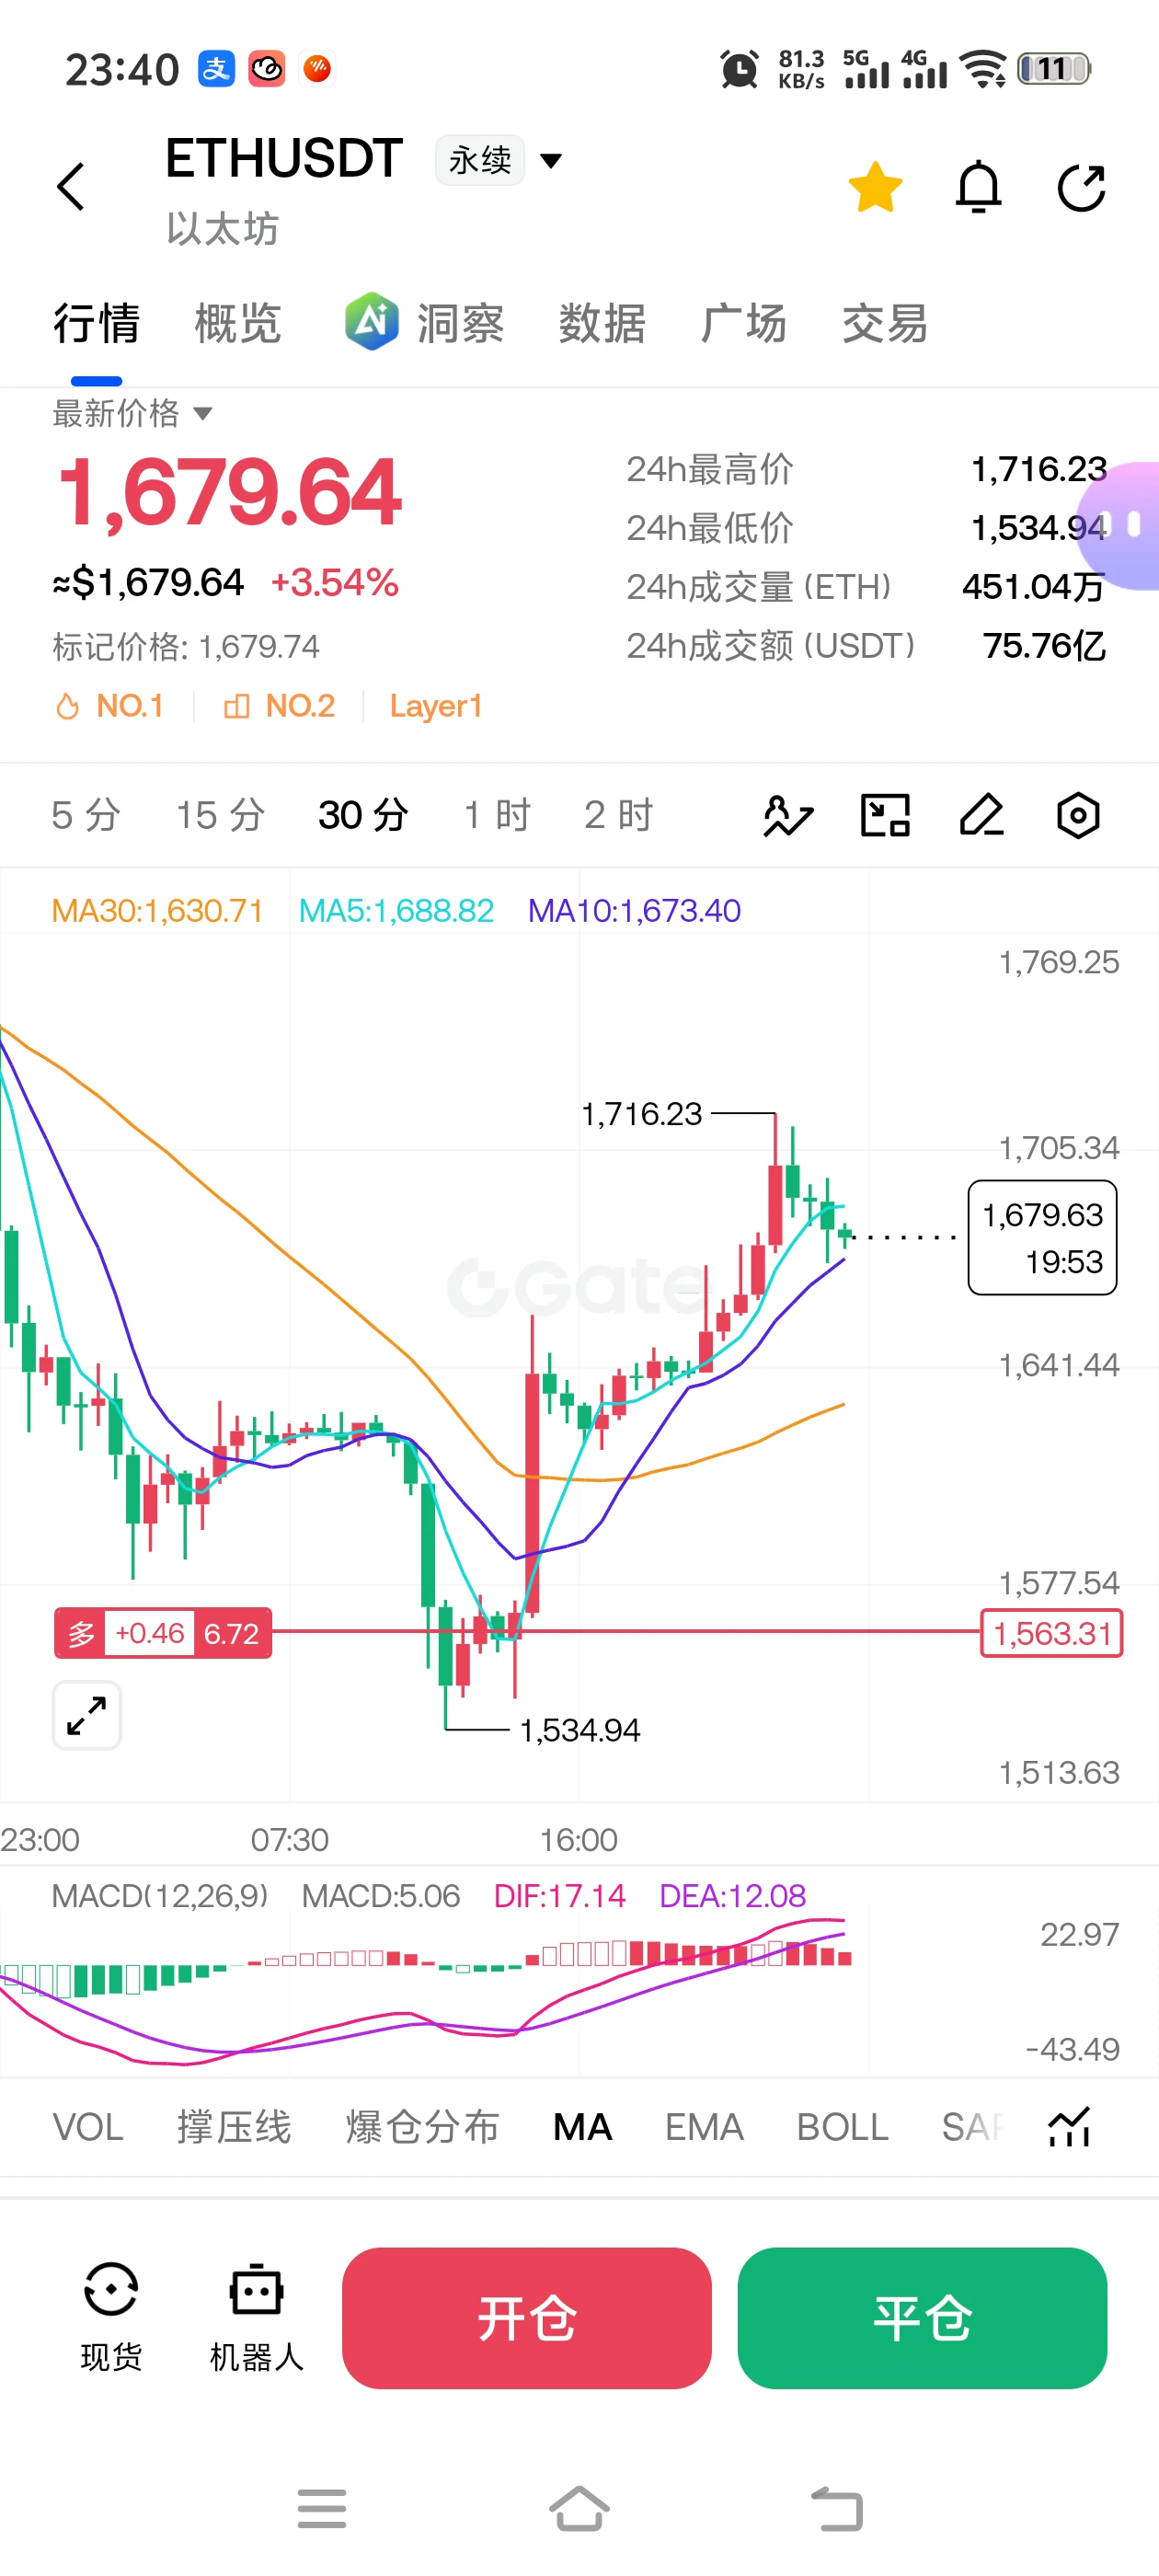
$ETH The current market structure is outlined as follows:

【Lower Defense Zone】- Short-term buffer zone: 1,580 - 1,600 USDT, the core area where buyers and sellers have repeatedly battled recently, with prices finding support there multiple times- Key defense: the 1,500 USDT round-number level, which is both psychological support and an area of concentrated structural demand; a break below it would indicate a marked weakening in market sentiment- Last-resort support: 1,536.59 USDT, corresponding to a previous low on the chart and serving as a reference for the final short-term line of defense
post-image
ETH-1.26%
Load More

Join 40 M users in our growing community

⚡️ Join 40 M users in the crypto craze discussion

💬 Engage with your favorite top creators

👍 See what interests you

Trending Topics

BTCBreaksBelow60K

2.1M Views29.9K Discussing

BTC fell below $60,000 on November 20 for the first time since July, alongside a tech stock selloff and broader pressure on risk assets. Will $60K become resistance, or can BTC quickly reclaim it? What price or volume signals would convince you that selling pressure is easing?

GateDirectIPOPhase3ANTAllocates92100Shares

775.2K Views4.9K Discussing

NvidiaDropsNearly14Percent

325.2K Views7.6K Discussing

View More