Square
Following
Hot
News
Notifications
Profile
Share your thoughts
placeholder
Article
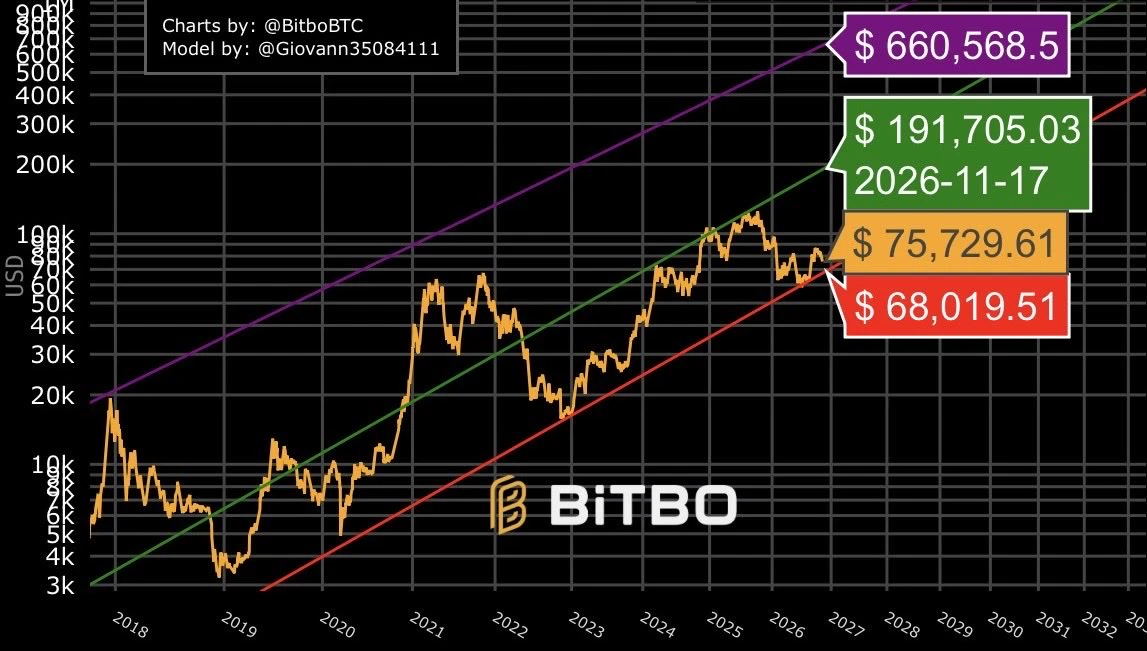
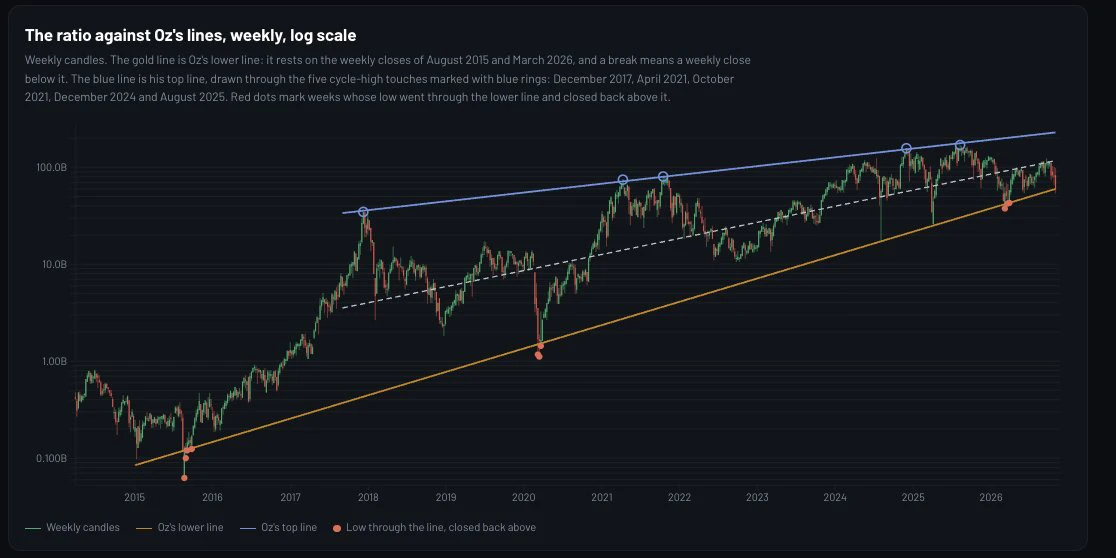
During the 2020-21 bull run bitcoin was trading significantly higher than fair value (green line) during a large portion of the cycle.
During the 2024-2025 bull run bitcoin barely even touched fair value and has been stuck between the support (red line) and fair value channel since 2022.
Today we’re sitting only 11% above support and a trip to resistance (purple line) would require a 771% price surge.
Bitcoin historically spends very little time near this red line and in the last 4 years has barely broken fair value.
No model is perfect but sentiment right now feels exactly the same as this
post-image
BTC-0.67%
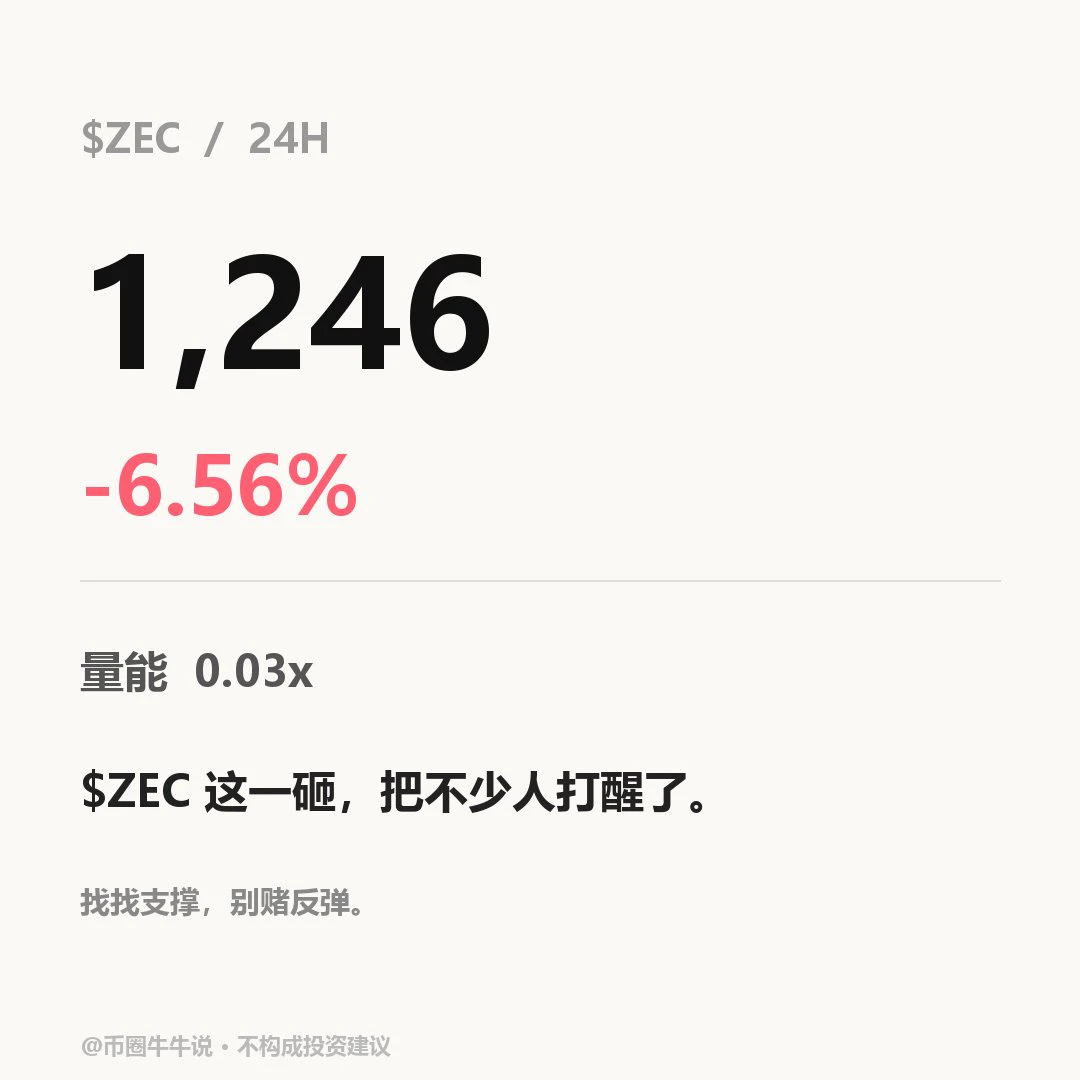
$ZEC Currently at 1246.5, down 6.56% over 24H (range: 1242.05–1364.08). The 1H trend is weak, with RSI at 12.56, price below the EMA20 at 1282.85, and a volume ratio of 0.03. The 4H trend is weak, with RSI at 51.52, price below the EMA20 at 1282.90, support at 1159.00, and resistance at 1387.89. If price moves above and holds the 1364.08 resistance, it can be monitored; a break below the 1242.05 support would weaken the structure. Review whether price holds above 1364.08 and reclaims 1242.05; volume is only 0.03x. A low-volume hold above resistance, or a break below support without a subsequen
post-image
ZEC+1.16%
Trenches
ZIG
Z
bade
b
ZIG
0x8c...1145
Market Cap
$.
Change
.
24h Vol
$.
Holders
.
BTC
B
bade
b
BTC
C5xp...pump
Market Cap
$.
Change
.
24h Vol
$.
Holders
.
José
J
bade
b
José
87CQ...1UJT
Market Cap
$.
Change
.
24h Vol
$.
Holders
.
STONK
S
bade
b
STONK
6GmA...UNgx
Market Cap
$.
Change
.
24h Vol
$.
Holders
.
IDOL
I
bade
b
IDOL
0x3b...ab07
Market Cap
$.
Change
.
24h Vol
$.
Holders
.
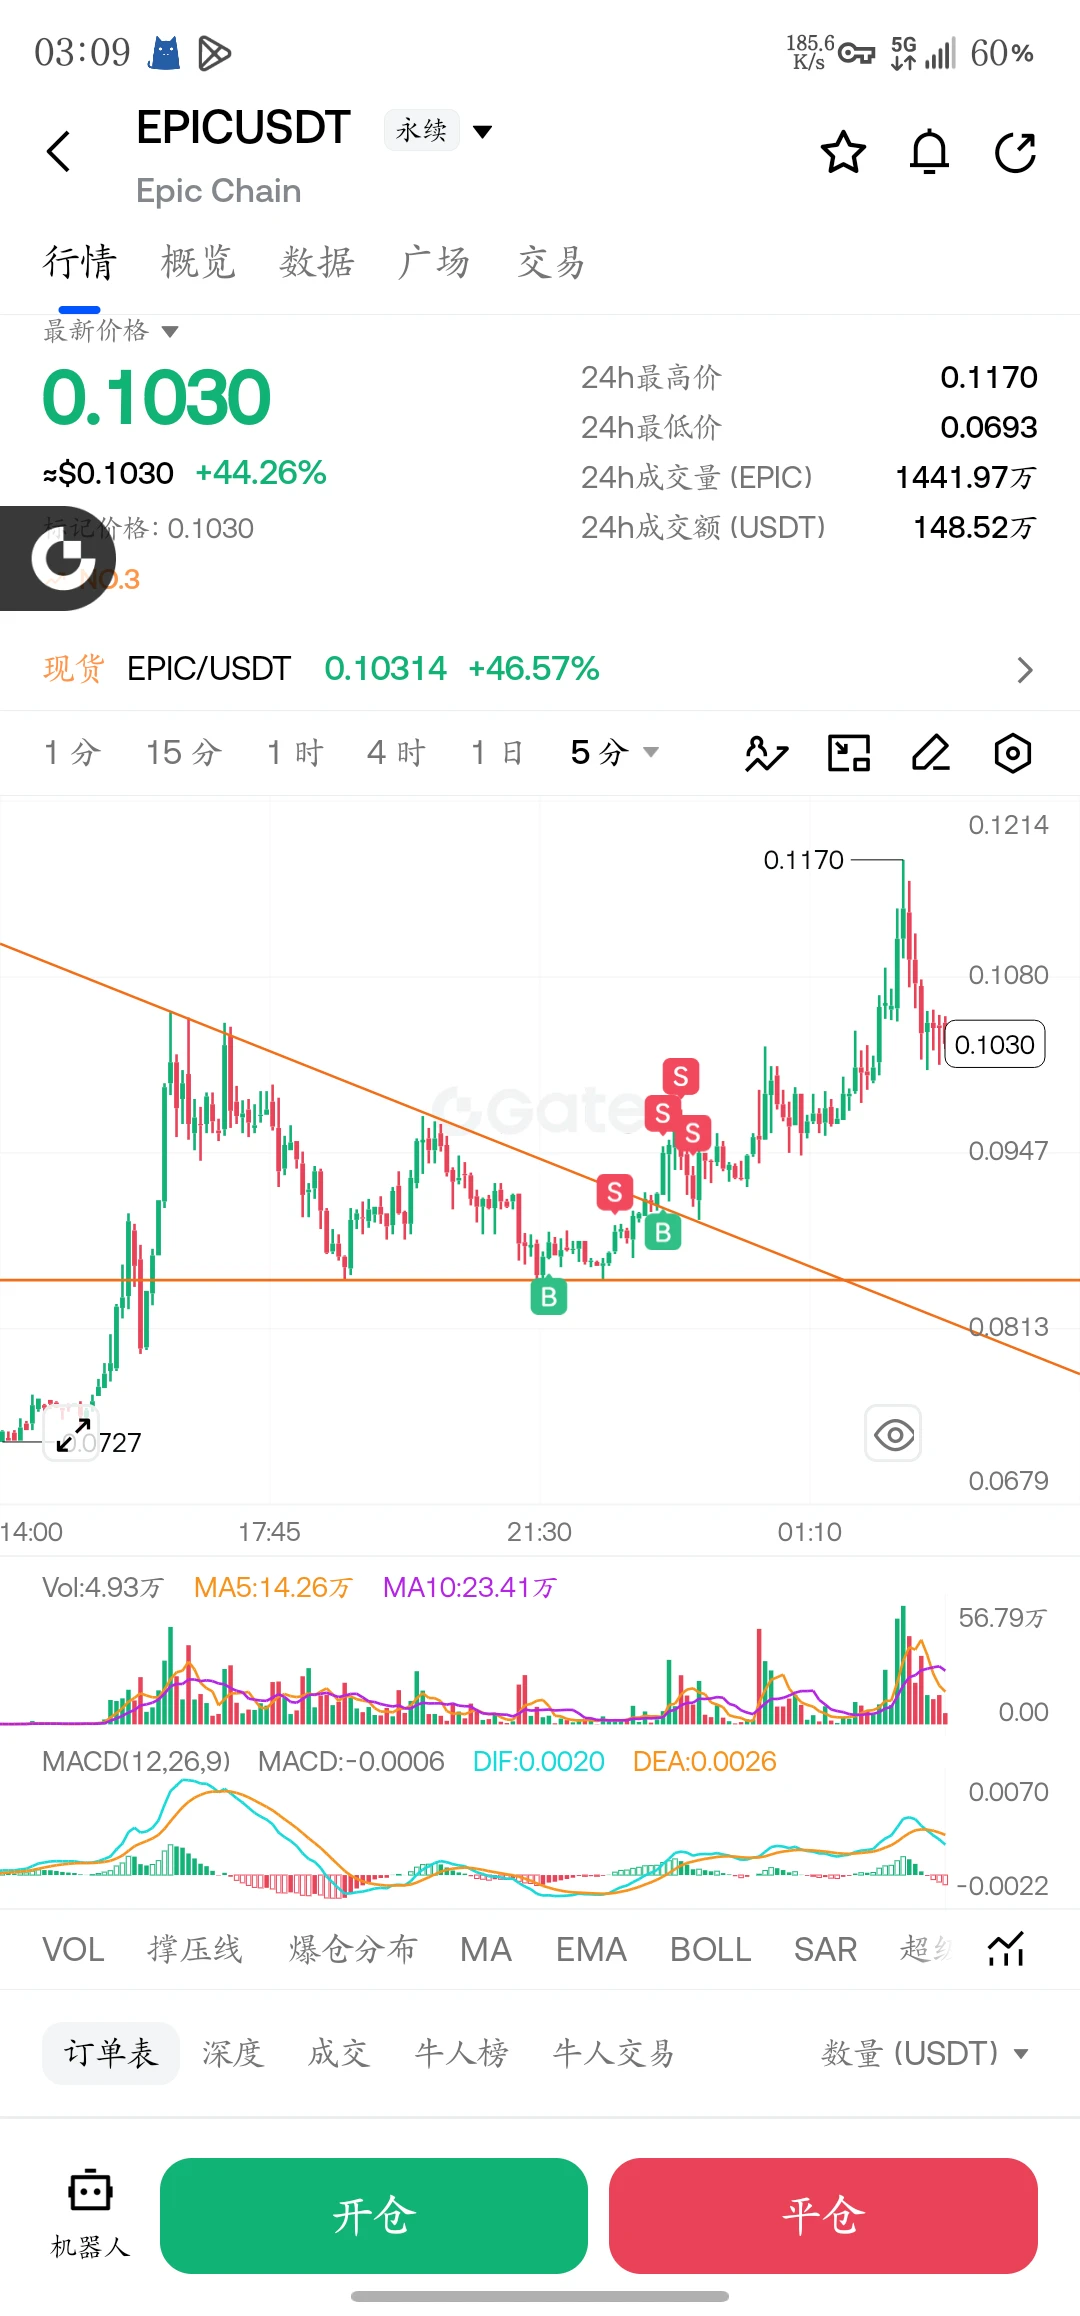
$EPIC A pullback stopped me out at breakeven. I’m seriously losing it—this shakeout completely threw me off. I had my stop-loss at 0.0845, then added to my position after the breakout and moved my stop to breakeven. If I hadn’t set a stop... but there’s no point in what-ifs. I was sure I’d capture today’s top gainers. I’m mentally exhausted. I’ll take some time to regroup
post-image
EPIC-9.89%
  • 1
Why does it have to be a Chinese teacher?
post-image
👀 THE NEXT VIRAL #MEMECOIN COULD BE HIDING IN PLAIN SIGHT! 🚀
Who's holding a low-cap gem before it gets the spotlight? 💎
Shill your strongest 1000X candidate below! 👇🔥
Let's discover the next big community together.
#Memecoins #Crypto #1000XGems #Altseason
post-image
MEME-0.94%
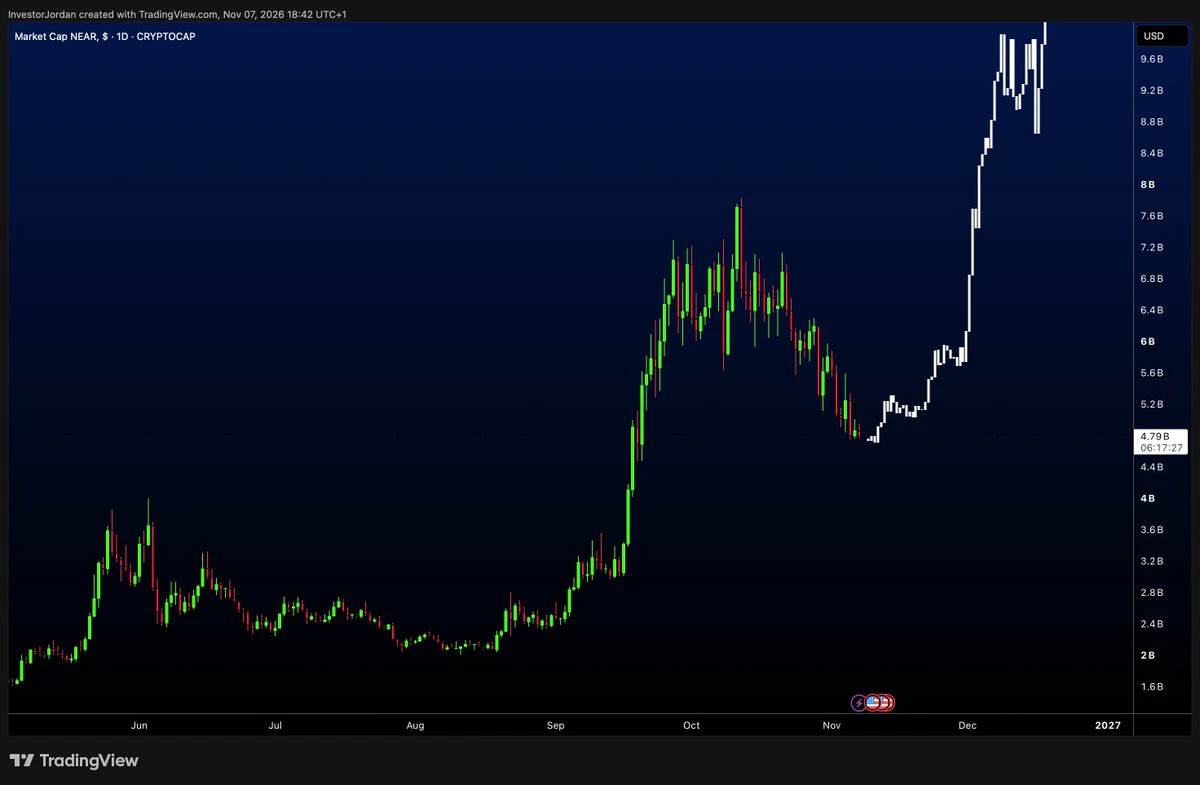
$NEAR 🧠
It's giving $ZEC before it exploded from $500 to $1700 vibes.
Both rallied hard, stalled and then continued running once the market recovered.
Time for @NEARProtocol to chase double digits 🚀
post-image
ZEC+1.16%
  • 1
$SIGN ‌ just showed some serious volatility. Is a reversal finally brewing?

SIGN is trading near $0.00937 after briefly dipping to $0.00828 and bouncing sharply.

That long lower wick suggests buyers stepped in, but the daily trend remains bearish below the Supertrend at $0.01133.

Key levels I'm watching:

Support: $0.0090
Major support: $0.00828
Immediate resistance: $0.0106
Breakout zone: $0.0111–$0.01133

A sustained move above $0.01133 could signal a stronger recovery. Losing $0.00828 would put sellers back in control.

Interesting reaction from the lows, but bulls still have work to d
SIGN-2.90%
AMD+11.55%
Finally showing some real life, back above those moving averages. $SOXL is starting to look formidable again, making me wonder if we're really targeting recent highs or just teasing us. Take profit: 48.45 Stop loss: 44.72 Still active: $XRP : Current price 1.1621 - 24-hour change: -1.87%$IDOL : Current price 0.035111 - 24-hour change: +31.95%
post-image
SOXL-1.16%
XRP-1.15%
IDOL-6.71%
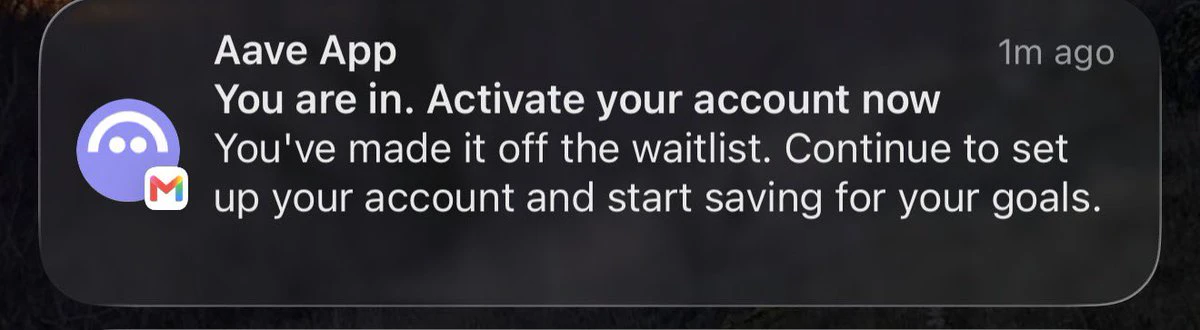
almost forgot I signed up for this, they put me on waitlist for 8 months
already found better alternatives too
how can they expect people to wait 8 months to use their app?
post-image
A string of big wins 🤩🤩 Today's trade was a big win $ONE & $AKE
Everyone, $ONE will get ready for a sharp drop and continue shorting 🥂
post-image
ONE-1.19%
AKE+6.07%
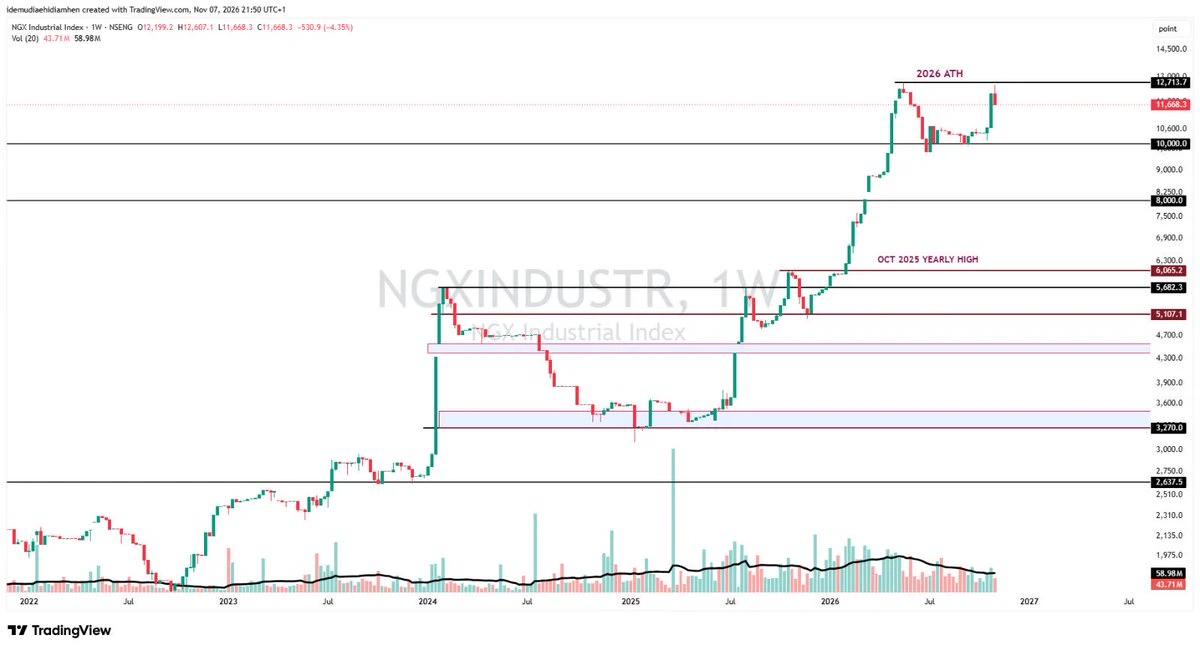
NGXINDUSTR
If you’ve been following Greenticker Warriors on YouTube, you’ll recall what I said three weeks ago. I expected the NGX Industrials Index to respect 10,000 points, and I said DANGCEM would be the one to drive any major run.
We nailed the call on the run. I expected the index to mint a new ATH, but we came up just 7 points shy before the market rejected that level. What we’re seeing now looks like a healthy pullback to me.
So, what do I see on the chart?
I’m still watching 10,000 points. That’s the level I want the bulls to defend, and I expect it to hold.
#NFA
post-image
INDEX+0.00%
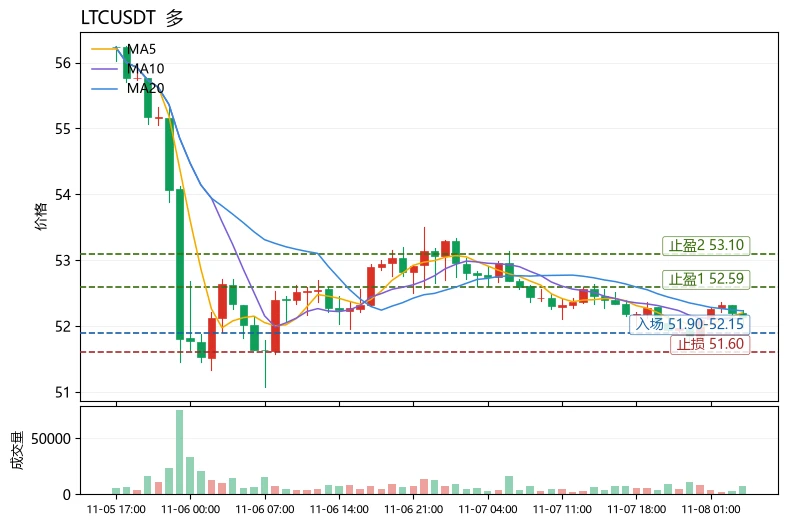
$LTC Current price: 52.14. The first resistance above is the Bollinger upper band at 52.59, and support below is the Bollinger lower band at 51.87. These two levels are where bulls and bears are currently locked in a short-term battle. Why give the price levels before explaining the logic? Because the first step in reading a chart is always to establish your bearings, not to predict.

Using LTC as an example, here's a reusable way to assess trend health: moving averages show direction, MACD shows momentum, and RSI shows positioning. A healthy trend requires all three to align. Currently, MA5=5
post-image
LTC-0.09%
PEPE+0.97%
ESPORTS | Long 🟢 | Bullish | 15-minute, 24h: +6.04% | Volume: 46.5M USDT
Long rationale: Price above EMA200; EMA20/50/200 bullish alignment; RSI14 at 58.0; MACD histogram positive; ADX14 at 23.8; volume at 0.43x the 20-candle average; trend pullback/continuation.
Entry: 0.011007
Stop-loss: 0.0105583
Take-profit 1: 0.0115678 | Take-profit 2: 0.0119043 | Take-profit 3: 0.012353
Entry price is for reference only; do not chase highs. The strategy is invalidated if the stop-loss level is reached. Technical analysis only; this does not constitute investment advice.
$ESPORTS
post-image
ESPORTS-5.30%
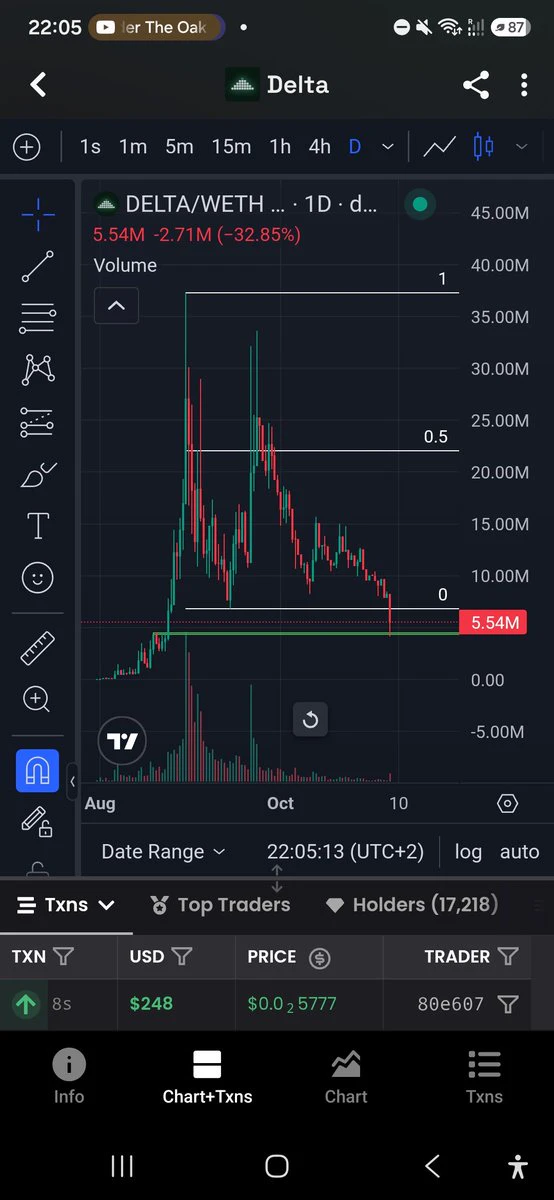
Bought $DELTA @deltaliquidity here on the capitulation/FUD
post-image
BTC ETH MARKET PREDICTION
live-cover
LIVE53
Old Trump really does keep his word and follow through. He said he’d wipe out Iran’s whole family after the midterms, and then he actually did it.

Here we go again: a familiar weekend “limited strike” on the Strait of Hormuz.

After the strike, he said Iran was very eager to reach a deal. Iran’s Security Council replied that it wants to see concrete action from the U.S. and won’t accept promises on paper.

Now that the Democrats are in power, can they rein Old Trump in? Stop using Iran to draw candlestick charts. Leave Iran alone—and leave us alone too, okay?
Genuine question: Are girls’ dorm rooms all this messy these days?
post-image
MARKET PREDICTION
live-cover
LIVE13
Just as I thought..
Midline mayhem
BTC/VIX
post-image
BTC-0.67%
Load More

Join 40 M users in our growing community

⚡️ Join 40 M users in the crypto craze discussion

💬 Engage with your favorite top creators

👍 See what interests you

Trending Topics

USAIStocksHitHard

21.1k Views3.67k Discussing

U.S. stocks sold off sharply on Thursday, November 5 (UTC). The Nasdaq closed down around 5.5%, entering correction territory, while the Philadelphia Semiconductor Index plunged roughly 12%, with chip stocks including $NVDA and $AMD posting steep losses. Beyond profit-taking, investors are growing concerned about the pace of AI data center construction, capital spending, and future returns on investment. The key question now is whether the AI sector’s lofty growth expectations need to be repriced. Where do you think the next opportunities will emerge: chip stocks, tech giants, or other sectors?

USNonfarmPayrolls

34.41k Views4.34k Discussing

StakeOnLaunchpoolToShare450KVLX

9.9k Views828 Discussing

View More