Square
Following
Hot
News
Notifications
Profile
Share your thoughts
placeholder
Article
Eshu Live_Over all crypto market updates
live-cover
LIVE3,415
Good morning everyone☀️
Happy Wednesday
Another day another opportunity to keep building keep grinding and move forward
Wishing everyone a productive day
post-image
Trenches
mihao
m
bade
b
mihao
4Cxj...pump
Market Cap
$.
Change
.
24h Vol
$.
Holders
.
HOLD
H
bade
b
HOLD
4iJ7...pump
Market Cap
$.
Change
.
24h Vol
$.
Holders
.
X
X
bade
b
X
9VZe...pump
Market Cap
$.
Change
.
24h Vol
$.
Holders
.
PIEVERSE
P
bade
b
PIEVERSE
0x0e...25a9
Market Cap
$.
Change
.
24h Vol
$.
Holders
.
DacityCoin
D
bade
b
DacityCoin
DKYc...pump
Market Cap
$.
Change
.
24h Vol
$.
Holders
.
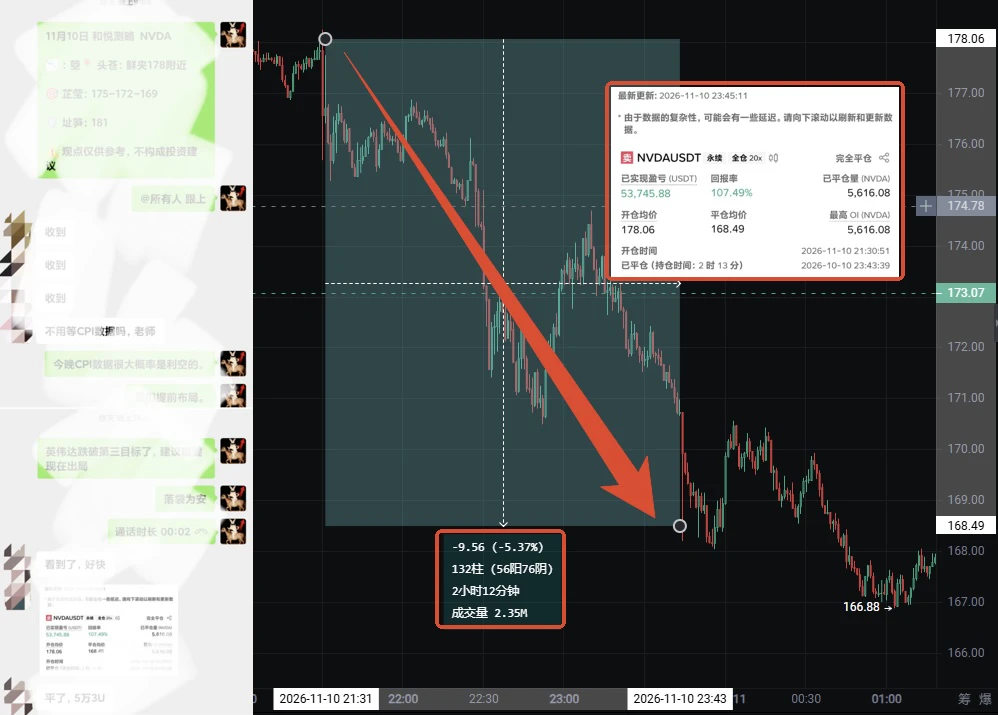
Late-night shock! Jensen Huang scandal sparks a selloff, with $NVDA closing in on the $166 mark!

Last night, NVIDIA shares plunged more than 6% intraday to $166.88, posting a 5.37% daily loss. The main trigger was CEO Jensen Huang admitting to an affair and being implicated in a suspected espionage scandal. The board urgently launched an independent investigation, while shareholder class-action lawsuits and rumors of FBI involvement gained traction, unleashing a full-blown governance crisis.

That same day, Bank of America removed NVDA from its “US 1” preferred list, and Wells Fargo cut its
post-image
NVDA-0.35%
  • 2
  • 2
Why do well-crafted trading plans still get distorted so easily in live trading?

Many traders do have a plan.

Their entry conditions, stop-loss levels, take-profit targets, and position sizes have all been set in advance.

But once they enter the market, things change: when prices rise, they worry about missing out; when prices fall, they are reluctant to cut losses; after a series of losses, they rush to make their money back; and after a series of wins, they become overconfident.

In the end, they are no longer following the original trading plan, but a different set of rules constantly re
post-image
$LINK I'm accumulating more link for the long term.
a strong project with real demand and revenue.
the daily chart is still bearish but don't keep waiting for the perfect entry. buy and hold, or put it in a bot until the market picks up again.
$NVDA $MU $SPCX #SOL #AVAX
NVDA-5.47%
MU-1.20%
SPCX+0.72%
SOL-0.77%
AVAX-0.10%
In cryptocurrency trading, many people spend a lot of time studying candlestick charts, indicators, and trading strategies, yet overlook a harder problem to solve: their own emotions.

Why do some traders have decent trading systems but still end up losing money repeatedly? Often, the problem isn't the market, but emotions affecting execution.

First, FOMO (fear of missing out). Seeing BTC suddenly rise, they fear missing an opportunity and chase the price regardless of its level, only to face a pullback right after entering.

Second, greed. They have already reached their take-profit target,
post-image
BTC-0.67%
$BLUAI With a market cap of just $8 million, can one sudden rally really send it flying? The market is so small that it can rise fast, but it can fall just as fast. Don’t get carried away by a single green candle. 90-day trading P&L: +$1,510.48, +69.01%; $BLUAI currently +14.68%. The explosive potential and pullback risk of small-cap coins have always gone hand in hand. Before chasing, think carefully about which leg of the rally you’re getting in on. Risk warning: The above is only a personal trading record and market observation, and does not constitute investment advice. Crypto assets are
post-image
BLUAI-1.71%
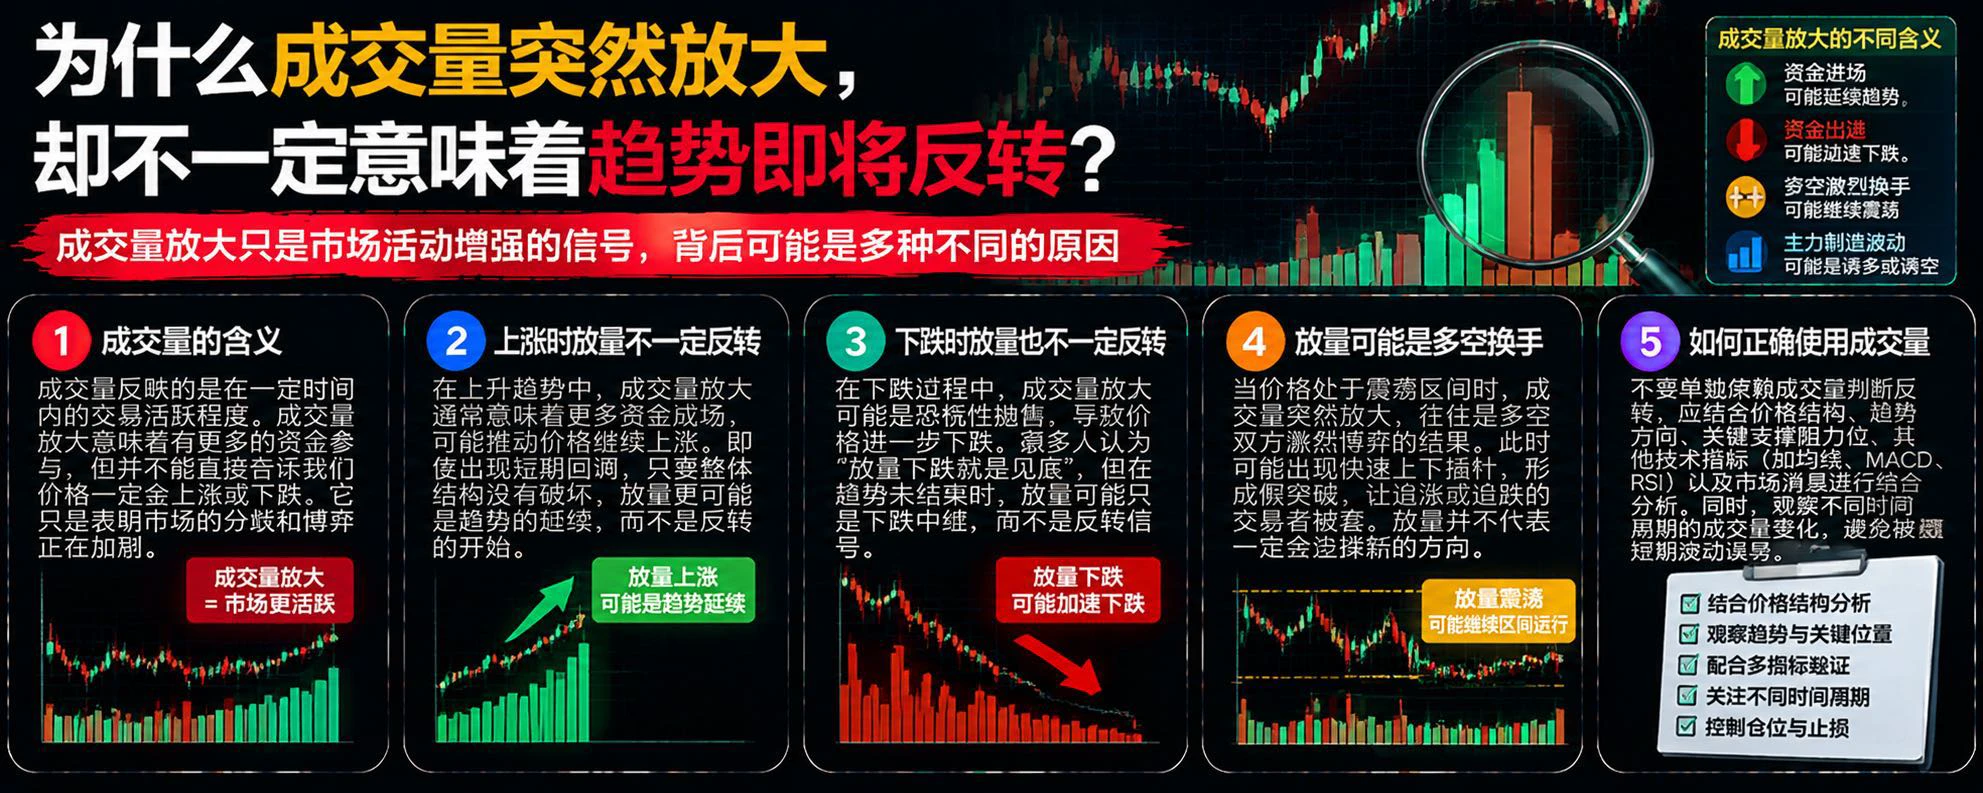
Why doesn't a sudden surge in trading volume necessarily mean a trend reversal is imminent?
In cryptocurrency trading, many people see a sudden surge in trading volume and assume the market is about to reverse. But the reality is not that simple. The same increase in volume can mean completely different things under different market conditions.
First, trading volume reflects how active the market is. Higher volume means buyers and sellers are participating more actively, but it cannot tell us on its own whether buyers have the upper hand or sellers are rushing to exit.
Second, a surge in volum
post-image
Yesterday we were still talking about how the ChiNext was probably close to bottoming out, and today the market answered with a big bullish candle.
The star of today's market was undoubtedly Zhongji Innolight. As the undisputed leader in optical modules and computing power, it led the charge today, sending the ChiNext soaring 2.86%.
After falling nearly 45% from its peak, a rebound is only natural once the decline has run its course. Today's rally on heavy volume is the strongest signal that confidence is returning.
That's the leader status of Zhongji Innolight—when it leads, the entire tech s
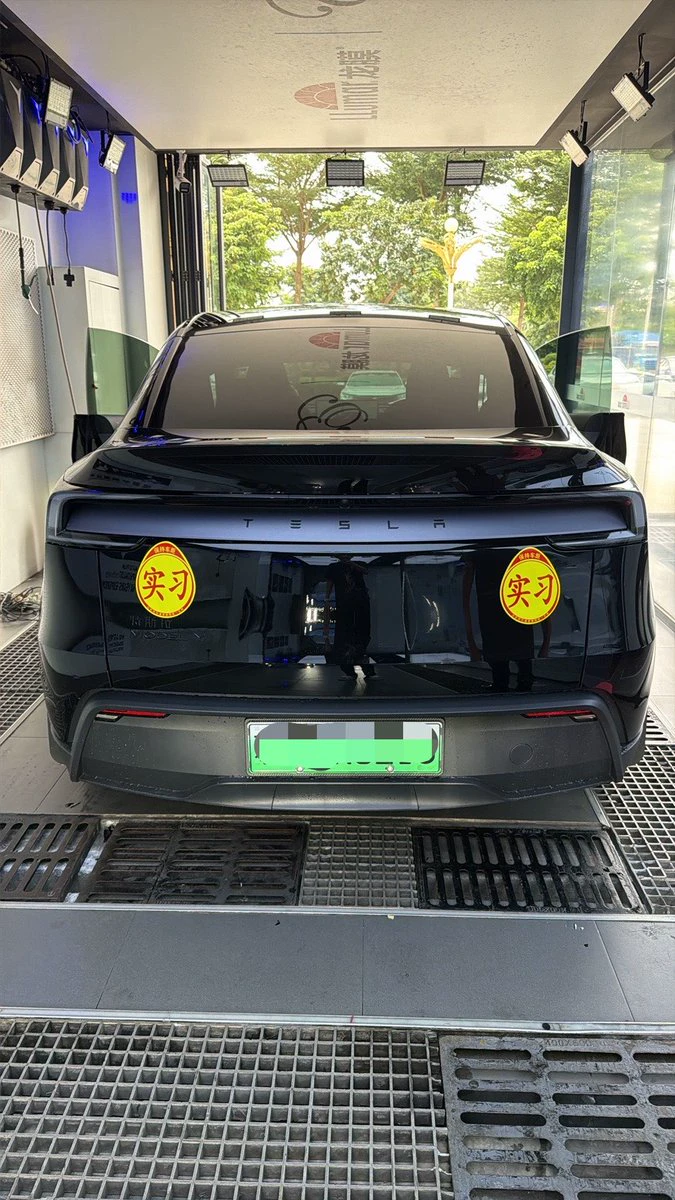
Just posting about your internship boosts your popularity by 200%.
post-image
In the cryptocurrency market, many people look for trading opportunities every day, but few take the time to make a trading plan. They go long when they see BTC rising and short when they see prices falling. When the market moves slightly against them, they start questioning their judgment. This kind of trading without a plan can easily leave an account stuck in repeated losses.

So, what should an effective trading plan include?

First, define your market direction. Before entering a trade, analyze whether the market is currently in an uptrend, downtrend, or ranging phase. Don’t decide the di
post-image
BTC-0.65%
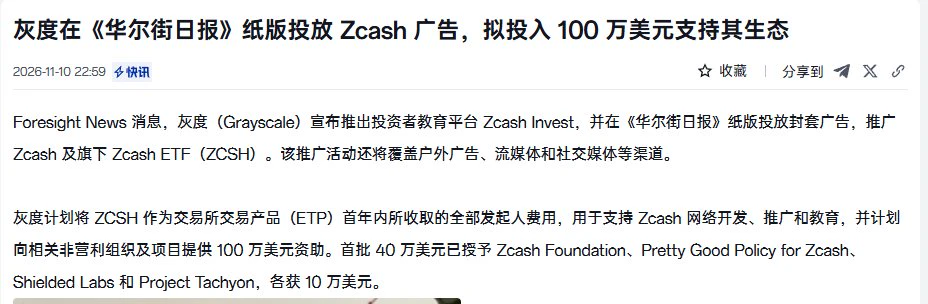
Buying the Dip While Prices Plunge: What’s Grayscale’s Play?
ZEC’s latest drop has been ugly. It fell for five consecutive days, losing more than 20% in total, and briefly dropped below $1,000 intraday today.
Over the past 30 days, it’s down nearly 20%, but it’s still up more than 70% year over year. A pullback from the highs and a collapse in the trend are two different things.
The reasons for the drop aren’t complicated.
Before the NU7 upgrade, ZEC had already climbed above $1,380. Once the upgrade went live, it became a point for investors to take profits.
On top of that, October CPI came i
post-image
ZEC+1.16%
BTC-0.67%
  • 7
  • 2
CPI Exceeds Expectations, U.S. Stocks Come Under Broad Pressure! Has the Most Dangerous Moment for AI Tech Stocks Arrived?

With U.S. CPI exceeding expectations, U.S. stock investors are once again calculating interest rates.
October headline CPI rose 0.4%, while core CPI rose 0.3%, both above market expectations.
For U.S. stocks, the issue is not just higher inflation, but that markets are starting to worry the Fed may continue tightening monetary policy.
Why are tech stocks especially sensitive?
Because many high-growth companies, especially AI firms, have valuations based on revenue and pro
SPCX+0.72%
  • 25
$BTW I took a 32,000 loss cutting my position last week, and today I finally made it back. Don’t rush to chase—look at the data first: the current price is 1.1768, up 17.55% in 24h, but it surged to a high of 1.3526 before getting dumped back to 0.9483. The range exceeded 40%, and the 73.2M trading volume shows intense turnover—a classic sentiment-driven market, not a trend.
My plan: don’t chase at the current price. Wait for a pullback to the 1.05–1.10 range and buy in batches, keeping the position below 15% of total funds and entering in three tranches. Set a stop-loss below 0.94; if it brea
BTW-7.42%
  • 7
Taiwanese girls are still the ones who dare to speak up.
This interview is really interesting.
Who has the original video?
post-image
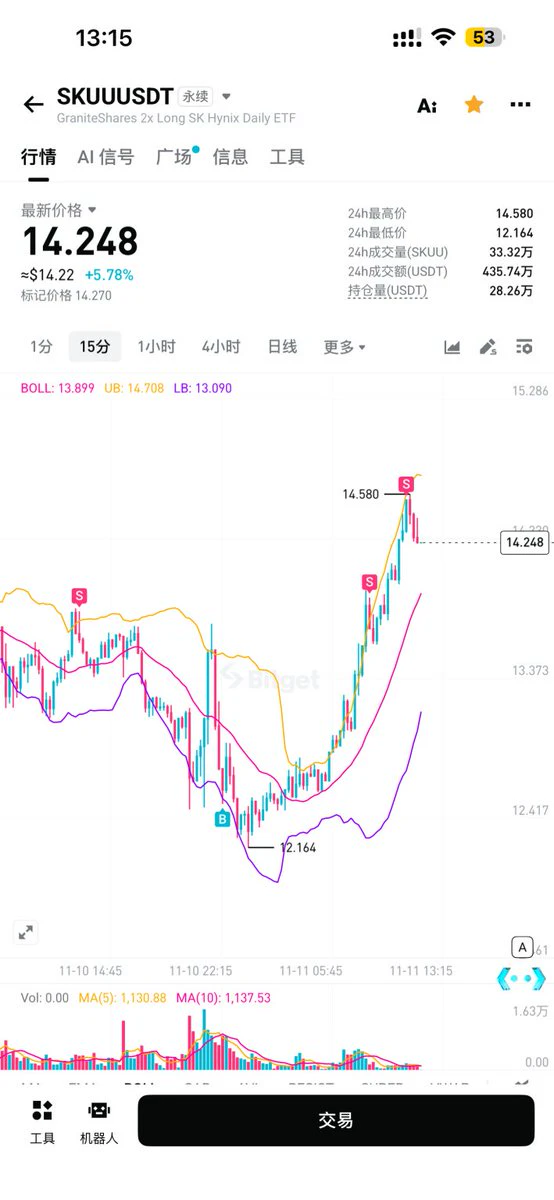
#SKUU When others are fearful, I’m greedy: a perfect swing trade in SK Hynix
post-image
SKUU+1.96%
SK Hynix+5.36%
SKHY-3.62%
Why Can a Strategy Perform Well in Backtests Yet Continuously Lose Money in Live Trading?

A trading strategy may have a high win rate in backtests, a consistently rising equity curve, and a seemingly acceptable maximum drawdown.

But once it is put into the market, the results can be completely different: trading costs keep adding up, actual execution prices deviate from expectations, and several trades in a row lose money. The once-impressive equity curve gradually loses credibility.

Where exactly does the problem lie?

Backtesting evaluates a strategy’s performance under specific historica
post-image
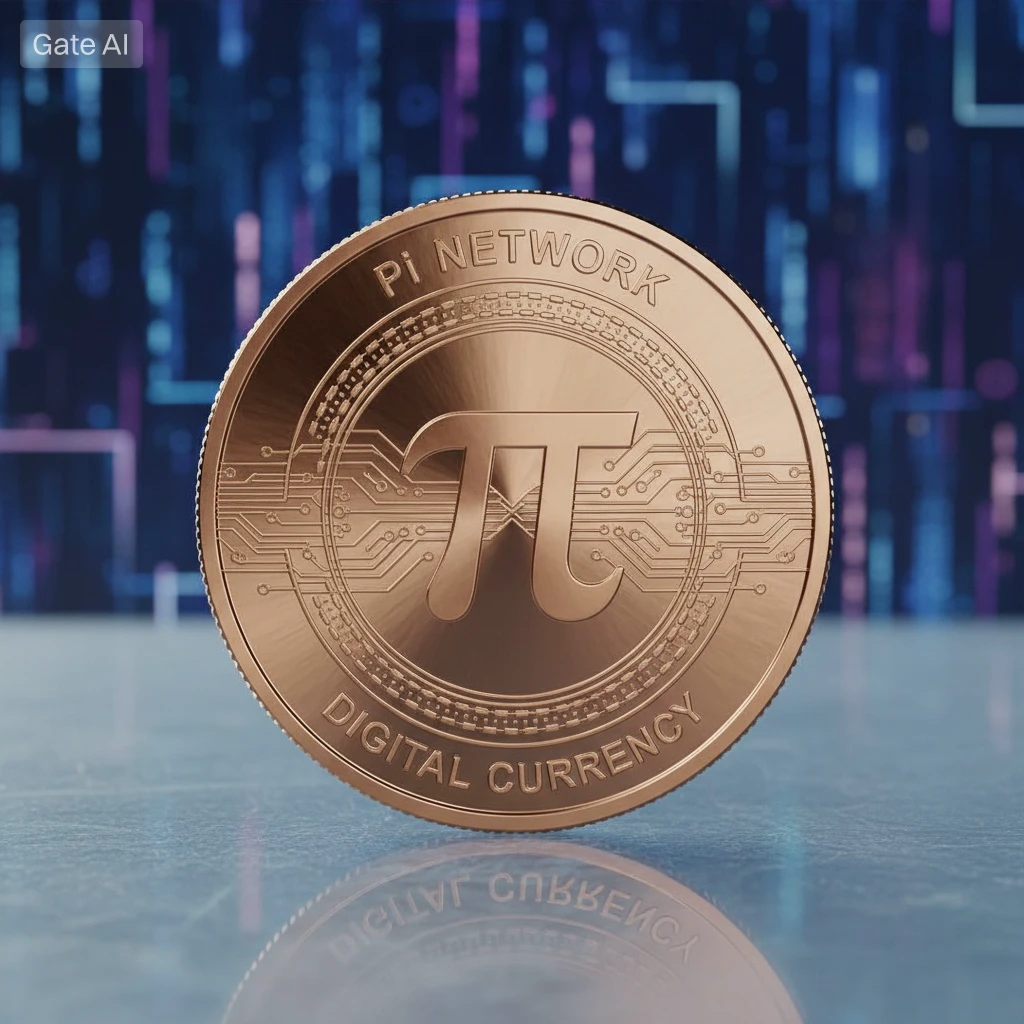
Pi Day is March 14. What if Open Mainnet happens on Pi Day? Price would be symbolic: 3.14 on 3/14. Do you think Core Team is waiting for symbolic date or they don't care about symbolism?
#PiNetwork
#ShareWeekly
#GateSquare
#WCTCS9
post-image
PI-0.60%
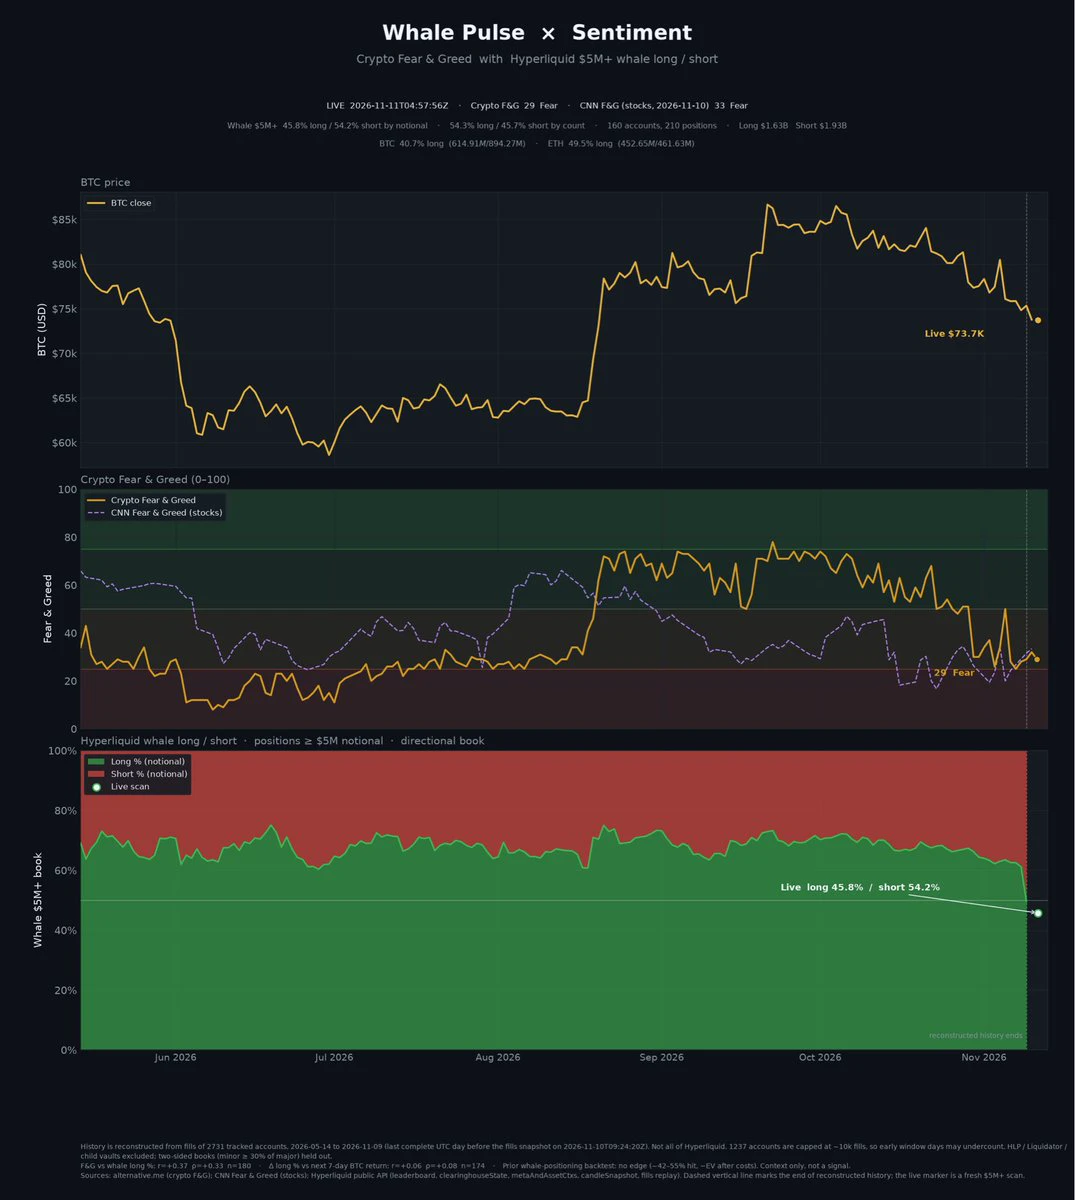
Quant insight:
Shorts continue to stack up at the bottom
post-image
UP-2.33%
AT-4.79%
Market update
live-cover
LIVE2,064
Load More

Join 40 M users in our growing community

⚡️ Join 40 M users in the crypto craze discussion

💬 Engage with your favorite top creators

👍 See what interests you

Trending Topics

GateGlobalComplianceExpansion

14.19k Views330 Discussing

Gate continues to expand its global compliance footprint, now covering 81 regulated jurisdictions across Europe, North America, Asia, and Oceania. From MiCA and U.S. state-level MTLs to Japan’s FSA, Dubai, and Australia-related regulatory approvals, global exchanges are entering a new stage of compliance competition. Do you think regulatory strength will become as important as products and liquidity for exchanges in the future?

USOctoberCPIBeatsExpectations

83.14k Views2.57k Discussing

AnthropicIPOValuationCouldReach1.4T

10.75k Views1.58k Discussing

View More