Square
Following
Hot
News
Notifications
Profile
Share your thoughts
placeholder
Article
Strategy Removed from MSCI: Is the Largest Corporate Bitcoin Treasury About to Crumble?

I just saw the news that Strategy was removed from MSCI, and many Bitcoin investors immediately got nervous: if the stock keeps falling, could it drag Bitcoin down with it? 😂 The concern isn’t unfounded, but the two aren’t necessarily tied together.

First, look at the scale: Strategy holds 850,364 BTC, an enormous amount. It’s also often treated as a leveraged alternative to Bitcoin, so when its stock falls, market sentiment can easily turn fearful.

But simply put, selling in the stock market and sellin
BTC-0.67%
What do you call this $BTC pattern? Back at $66K 🤣
313,828 traders liquidated. Total liquidations were $1.97B.
GG WP CZ. The undefeated pardoned champion of crypto.
post-image
BTC-0.65%
Trenches
Snoopy
S
bade
b
Snoopy
7mEh...47Cn
Market Cap
$.
Change
.
24h Vol
$.
Holders
.
mihao
m
bade
b
mihao
4Cxj...pump
Market Cap
$.
Change
.
24h Vol
$.
Holders
.
bill
b
bade
b
bill
85Rh...pump
Market Cap
$.
Change
.
24h Vol
$.
Holders
.
AGT
A
bade
b
AGT
0x5d...e274
Market Cap
$.
Change
.
24h Vol
$.
Holders
.
PIEVERSE
P
bade
b
PIEVERSE
0x0e...25a9
Market Cap
$.
Change
.
24h Vol
$.
Holders
.
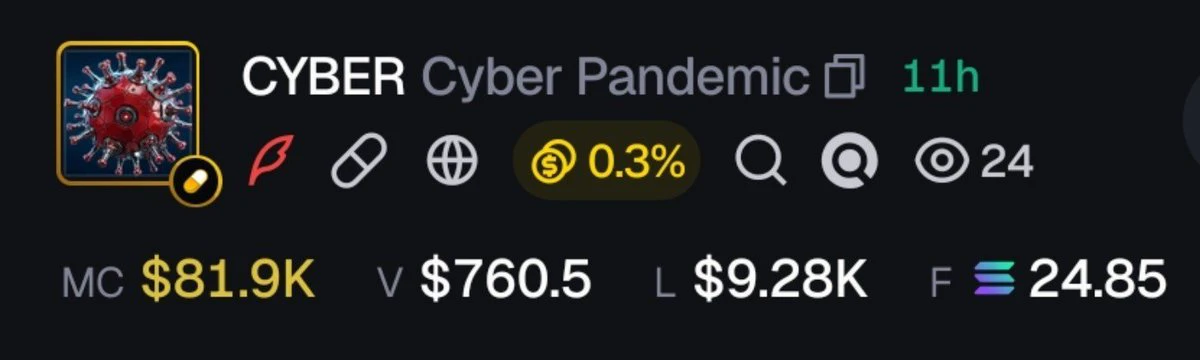
Speed run to 10mn
post-image
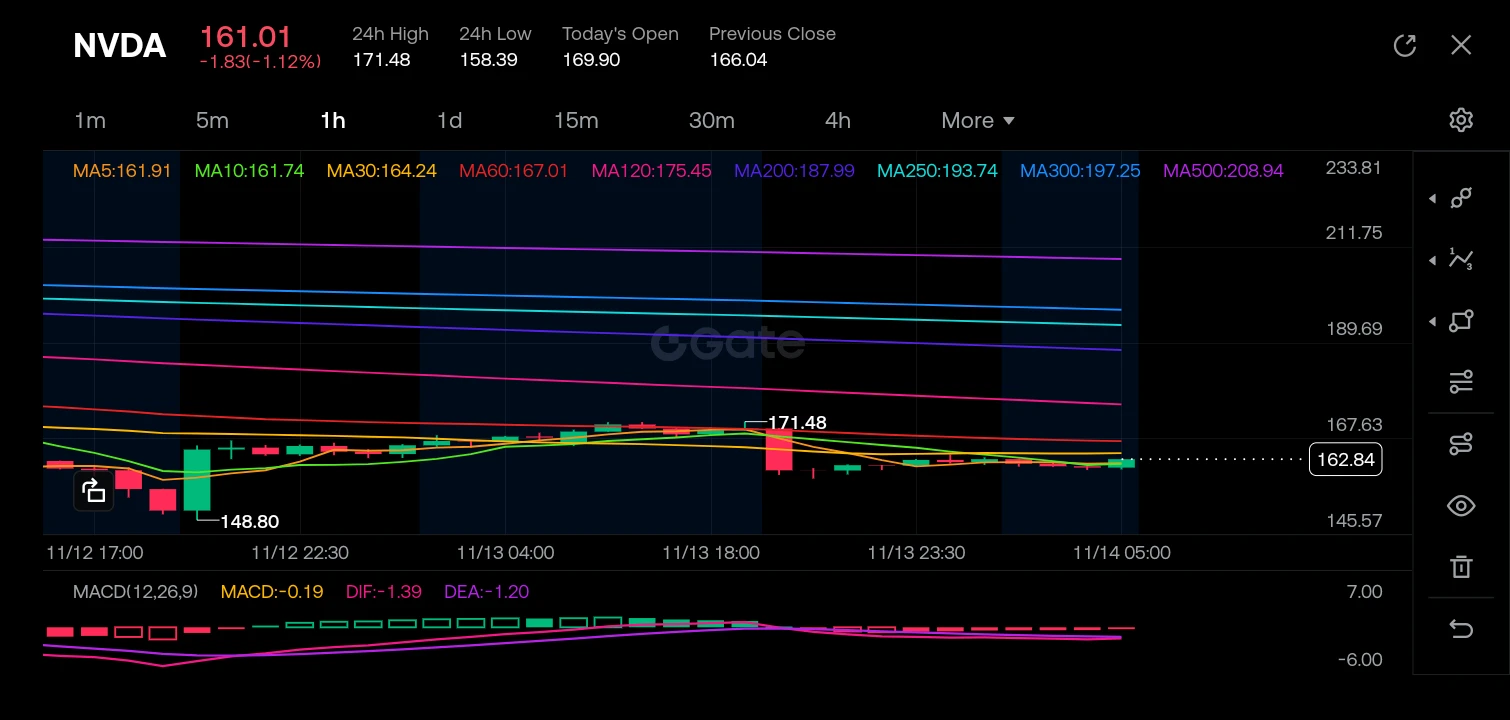
$NVDA ‌
The 1-hour chart reveals a distinct bearish breakdown structure, where price action has sharply rejected the upper resistance zone near 171.48 and cascaded downward. Currently, the price is consolidating in a tight range around 161.01, hovering significantly below the major moving averages (MA60 at 167.01 and MA120 at 175.45), which act as dynamic overhead resistance. The MACD indicator confirms this bearish momentum, showing a negative histogram and the signal lines (DIF and DEA) trending downward below the zero line, indicating that sellers are currently in control of the intraday t
post-image
NVDA-1.92%
  • 4
  • 1
gm breakpoint day
see you in london
post-image
$HYPE This move also couldn’t escape the market-wide sell-off😥

Over the weekend, it fell all the way from around $73 to $60. The several rebounds along the way failed to change the pattern of lower highs

But I think there’s another detail about HYPE worth watching: early this morning, the price quickly broke below $62, hitting a low near $60 before rapidly bouncing back and leaving a pronounced long lower wick on the 4H candlestick

This shows that buyers did step in around $60

However, considering the previous price action, this lower wick isn’t enough to prove that the bulls have regaine
post-image
HYPE+0.33%
  • 3
  • 2
market updtes
live-cover
LIVE1,281
U/USDT is falling,
USD1/USDT is falling,
USDG/USDT is falling
RLUSD/USDT is falling.
I ask, you answer—where has the money from these high-yield, investment-oriented stablecoins gone?
USD1+0.00%
USDG+0.02%
RLUSD+0.00%
Bro, listen $PENGU just got hit by a massive sell-off, and the real money-making opportunity is right here. Look at the chart. The price fell all the way from $0.0060 to $0.0045. Everyone panicked, and everyone sold at the bottom. What happened next? The selling pressure stopped. The price left a long lower wick and immediately bounced back. This wasn't a coincidence; whales were picking up cheap coins while retail traders panicked. More than 19 billion PENGU changed hands in 24 hours. Volume doesn't lie. Big players are buying heavily while you're still hesitating. I'll be direct: the price
post-image
PENGU+0.40%
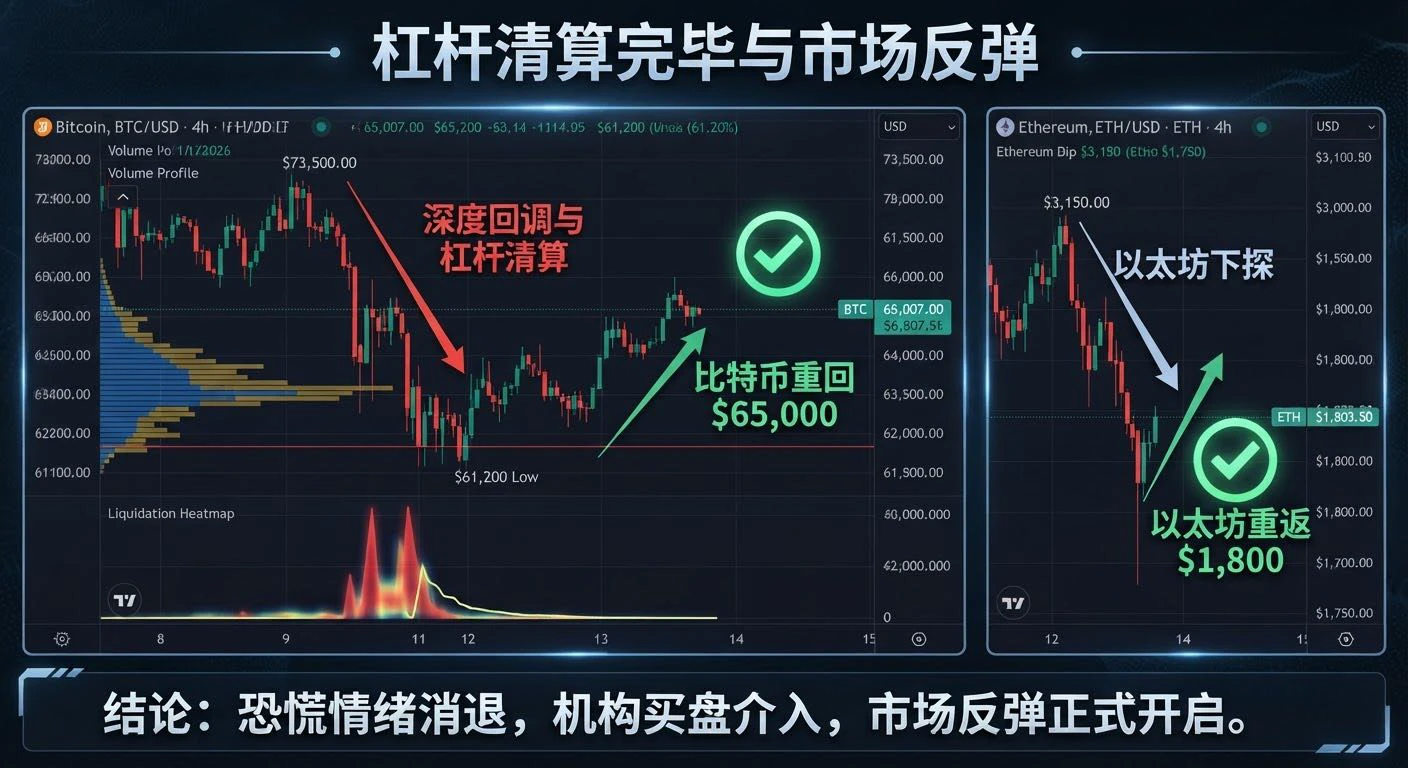
Leverage is dead; spot is king.

✅ Bitcoin is back at $65,000
✅ Ethereum rises above $1,800
The panic is over, and the crash-driven shakeout is officially finished.

Markets always reward patience with intense pain. Those who caught the bloodied coins just above $60k a couple of days ago now hold the safest position in this rebound. Next, watch closely for a confirmed retest of key support, hold your spot positions, and don’t get shaken out easily.
post-image
BTC-0.67%
ETH-1.26%
Pi fell from 3U to 0.06. If you’d listened to Youlong earlier, you wouldn’t have gotten wrecked. He kept predicting 0.3→0.1→0.05; getting node privileges was the right time to enter. Those on exchanges without nodes are just exit liquidity. Youlong’s timing has been solid this time, and at least he got the direction right. Did you take his advice? Feel free to discuss who missed the entry—or who’s a swing-trading expert
PI-0.60%
$AKE This -13.63% bearish candle is a market-maker shakeout, not a crash. 24h trading volume is 745.8M, and the turnover has shaken out all the weak hands. The low of 0.0085 was a precise wick that swept out leveraged longs before the price was pulled back to 0.0115—a classic bloodbath followed by a rebuild. There’s no negative fundamental news, and no large on-chain outflows; this drop is purely a sentiment-driven selloff. My plan: scale in between 0.0100 and 0.0110, with a stop-loss at 0.0080 (admit you’re wrong if it breaks the previous low) and a first take-profit at 0.0160. Keep your posi
AKE+6.39%
  • 1
  • 2
On the 14th, I opened a BTC long near 68,000. I kept adding to bring down my average entry, then trimmed the position. After the price pulled back, I added again and trimmed again. I took partial profits on the long, locking in 1,800 USDT.
BTC-0.67%
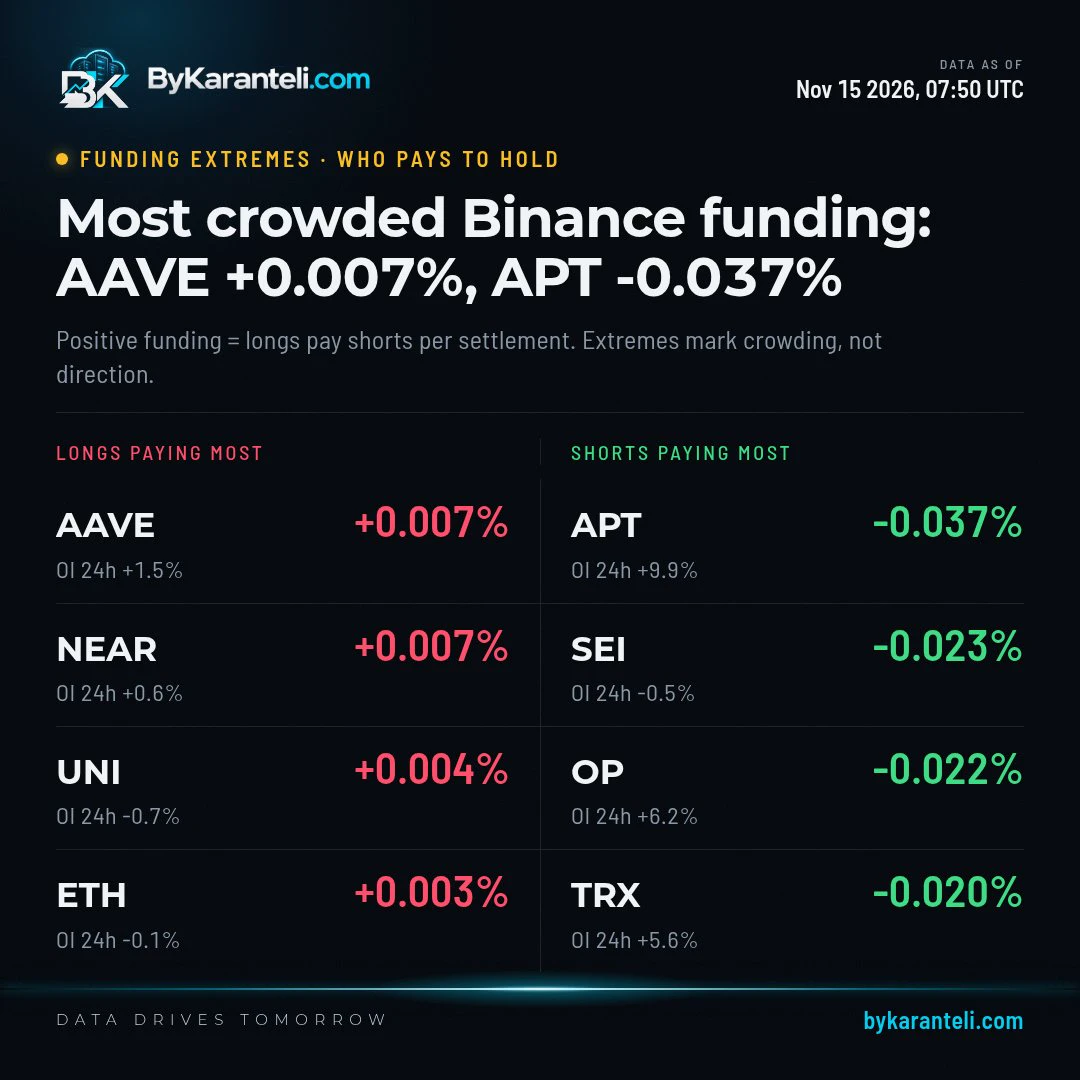
Shorts on $APT pay the steepest funding on our board, yet open positions grew 9.94% in 24 hours. That -0.04% fee, paid to longs, falls on a larger pool of positions.
post-image
APT-1.57%
Brother Peng remembers that gold rallied after the midterm elections, essentially because the market anticipated that Trump's aggressive tactics would be constrained, with the rebound driven by a short-term easing of geopolitical tensions. But Iran's position remains firm, with no signs of backing down.
The Fed's rate hikes often come when Trump struggles to properly resolve the turmoil in the Middle East. Whether ground troops are deployed later or Iran imposes shipping fees in the Strait, either could drive inflation higher and force the Fed to choose to raise rates.

In addition, tensions b
GLDX-0.40%
PAXG+0.37%
  • 2
Reportedly $350B+ wiped from crypto in just one week.
$BTC dumped toward $62K, with $1.9B in liquidations in 24 hours.
@ hack aftermath, MSCI dropping @Strategy, ETF outflows.
post-image
BTC-0.65%
MSCI+1.34%
cryto live now
live-cover
LIVE909
Weekly review: Resistance levels were laid out in advance, and the pullback unfolded as expected!
Looking back at the BTC and ETH outlooks shared publicly over the past few days, every resistance zone for a rebound was clearly marked ahead of time. As the market played out, the pullback largely followed our earlier assessment.
No speculative predictions detached from the market—we simply follow the market structure to find opportunities. Only act when you understand what you’re seeing; keeping a steady pace is the safest approach. #比特币跌破7万美元 #ETH一度跌破2000美元 $BTC $ETH
post-image
BTC-0.65%
ETH-1.23%
Load More

Join 40 M users in our growing community

⚡️ Join 40 M users in the crypto craze discussion

💬 Engage with your favorite top creators

👍 See what interests you

Trending Topics

GateIPOAccessAnthropic

348.6K Views2.7K Discussing

Gate IPO Access Phase 3 features Anthropic (ANT), with USDT subscription interest starting from 100 USDT. Successful allocations will be delivered as real shares to Gate Stock Accounts. Indicative price: $70–$78/share Subscription: Nov 12–17 (UTC+8) Allocation is not guaranteed. Please manage risk accordingly.

Dr.HanOxfordUnionSpeech

151.2K Views510 Discussing

USOctoberPPIBelowExpectations

480.7K Views1.4K Discussing

View More