






Square
Following
Hot
News
Notifications
Profile
Share your thoughts
placeholder
Article
This is way too accurate!🤭
I recently learned about life codes, and they’re pretty interesting.
My result says I’m a No. 4, a management planner.
I’m drawn to building comprehensive frameworks and tend to reason things through with data and logic. Deep down, I unconsciously seek certainty. I use the same mindset when researching the market and analyzing cycles, and comparing the results, I feel it’s highly accurate.

Curious about everyone else: What number did you get?
Feel free to share your traits!✨
*For fun and self-reflection only
#BTCBreaksBelow60K Bitcoin briefly slipped below the $60,000 mark on November 20, marking its lowest levels since the summer and testing a psychological floor that many market participants had been watching closely. The move came amid broader pressure on risk assets, with technology stocks facing significant selling and sentiment turning more cautious across markets. What began as a sharp intraday decline raised immediate questions about whether this level would hold or whether further downside was still ahead.
By Friday’s session, Bitcoin had dropped from levels near $61,400 earlier in the da
BTC-0.67%
Trenches
IDOL
I
bade
b
IDOL
0x3b...ab07
Market Cap
$.
Change
.
24h Vol
$.
Holders
.
PIEVERSE
P
bade
b
PIEVERSE
0x0e...25a9
Market Cap
$.
Change
.
24h Vol
$.
Holders
.
FIONA
F
bade
b
FIONA
B34n...pump
Market Cap
$.
Change
.
24h Vol
$.
Holders
.
CLAUDIA
C
bade
b
CLAUDIA
2j5S...W2ZM
Market Cap
$.
Change
.
24h Vol
$.
Holders
.
Singularity
S
bade
b
Singularity
7R4M...pump
Market Cap
$.
Change
.
24h Vol
$.
Holders
.
ELSA | Long 🟢 | Bullish | 15 minutes 24 hours: +0.59% | Volume: 36.4M USDT Long rationale: Price above EMA200; EMA20/50/200 are in bullish alignment; RSI14 is 51.3; MACD histogram is positive; ADX14 is 23.4; volume is 2.87 times the 20-candle average; trend pullback/continuation. Entry: 0.06789 Stop loss: 0.0667006 First target: 0.0693768 | Second target: 0.0702688 | Third target: 0.0714582 For reference only; do not chase the price. Hitting the stop loss invalidates this strategy. Technical analysis strategy only, not investment advice. $ELSA
post-image
ELSA+5.80%
$ENA Cycle Divergence: 1-Hour Strength, 4-Hour Weakness—Which Will Shift First?
Currently, $ENA is at 0.0989 USDT, down 0.60% over 24 hours, with a range of 0.0897–0.1002. The 1-hour trend is bullish, with support at 0.0897 and resistance at 0.1; the 4-hour trend is bearish, with support also at 0.0897 and resistance at 0.1181. The two timeframes give opposing signals, and the direction is still being contested.
The 1-hour RSI is 75.6, already in overbought territory, and EMA20 at 0.09770221 is below the price; the 4-hour RSI is 37.8, indicating weakness, and EMA20 at 0.10242771 is above the
post-image
ENA+8.04%
$BMT Short thesis update:
On the 4-hour timeframe, price is trading in the 0.02016–0.02023 range. I’m watching to see whether sellers step in around this area. If price reclaims 0.0206, the bearish thesis for this move is invalidated—momentum and structure are what matter.
The current 4-hour quote is 0.0202, below the EMA50 at 0.0206, so bears remain in control. The 1-hour RSI reads 49, with no overbought or oversold extremes so far.
Short zone: 0.02016–0.02023. Targets in order: 0.01997, 0.01981, 0.01959. Stop-loss: 0.02058
The above is only my personal opinion and does not constitute financ
post-image
BMT+5.93%
Maybe after $ON , my friend 😎✋$IDOL
$AGT
post-image
ON+4.77%
IDOL-6.71%
AGT-26.77%
$MITO This coin's about to moon—grab some
post-image
MITO+8.51%
Market Prediction
live-cover
LIVE2,611
BTC-0.67%
#NvidiaDropsNearly14Percent NVIDIA fell nearly 14% in a single session on November 20, marking one of its sharpest declines in recent months. The broader market followed, with the Nasdaq Composite dropping approximately 5.28% and AI-related semiconductor stocks experiencing widespread selling pressure.

What makes this move notable is the context. NVIDIA had recently delivered strong earnings and raised guidance, yet the stock still faced heavy selling. This reaction suggests that investors are no longer focusing solely on growth numbers. Instead, the market is starting to question the sustain
NVDA-13.84%
NDAQ-0.95%
Nov 22 morning session: ETH resumed moving sideways after a rebound. Watch the 1674–1692 range first.

There is support at 1674–1676, where you can wait for a brief long opportunity after the price stabilizes. If it fails to break through 1689–1692, watch for a pullback. If it later holds above 1692 on increased volume, look next at 1697–1705; if it breaks below 1672, watch 1663 and 1653.

My approach is to stay mostly inactive in the middle and wait for confirmation at key levels. Don’t let a sharp rally or sell-off throw off your rhythm. The key now is which of these two levels gives a direc
post-image
ETH-1.23%
  • 2
🧠 $TAO : THE AI COIN WITH A BITCOIN SUPPLY

Bittensor has a max supply of 21 million, just like Bitcoin.

11.7 million TAO are in circulation, about 56%.

It trades at $185.33, 75.5% below its $757.60 all-time high.

Its market cap is $2.17 billion.

Could TAO be the Bitcoin of decentralized AI?
post-image
TAO+0.41%
  • 1
#ThreeLaunchpoolProjectsNowLive #ShareWeekly

Three Gate Launchpool Opportunities, Three Different Strategies: Looking Beyond APY, Token Supply and Reward Potential

When three different projects enter the Gate Launchpool at the same time, the natural reaction is to compare their reward allocations and advertised returns. But from my perspective, the more interesting question is what happens after the Launchpool campaign ends.

INFI, ValueX (VLX), and KOR Protocol (KOR) represent three opportunities that deserve separate evaluation. Each has a different reward structure, and participants shou
VLX+0.00%
BTC-0.67%
ETH-1.26%
GT-2.41%
NBA & NFL best week I can remember.
Is this day and age I should start charging $999.98 a month now right?
post-image
BTC markets predictions
live-cover
LIVE2,582
BTC-0.67%
$IDOL ‌ ‌
IDOL has recently become one of the most talked-about—yet highly controversial—assets in the crypto market. The massive green candle visible on the chart signals a surge of over 50% within 24 hours. However, the story behind this rapid ascent is not merely one of "discovery"; it also involves a complex equation of liquidity and risk.

IDOL is the native token of the MEET48 ecosystem. The project aims to integrate AI-powered content creation, virtual idols, and the fan economy into the Web3 space. Fans can use the token to participate in voting, make purchases during virtual events,
IDOL-6.71%
  • 4
  • 1
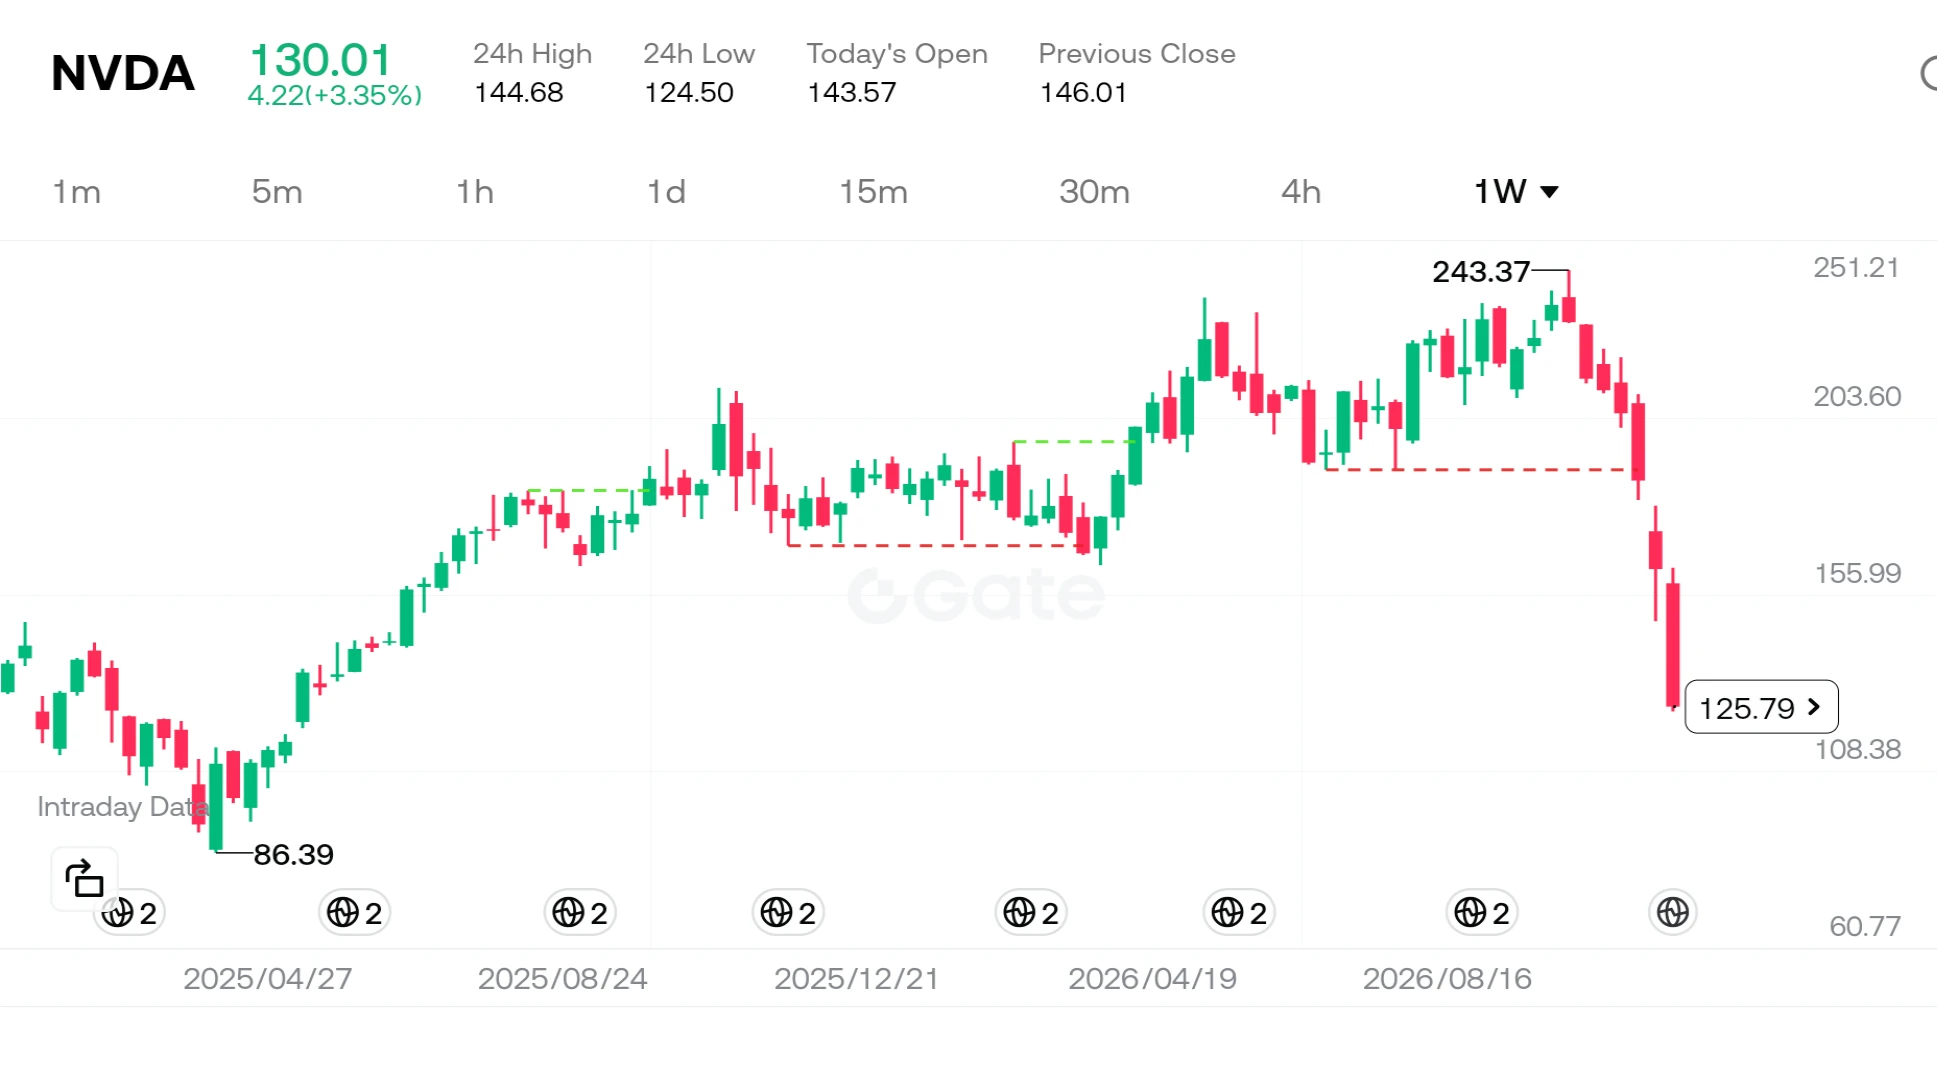
Nvidia shares failed to bring any cheer to investors, slipping to the $130 level in weekend trading. The sharp decline from the stock's peak of $243 can no longer be dismissed as a mere "market correction." The formal investigation launched by the U.S. Securities and Exchange Commission (SEC) into the company’s accounting practices has served as the primary catalyst for this downturn.

So, what does this investigation signify, and why has it shaken the stock price so profoundly?

Looking first at the company itself: as the driving force behind the artificial intelligence revolution, Nvidia has
post-image
User_any
$NVDA ‌
Nvidia has been losing ground for seven consecutive weeks—a trend not seen since 2008. The stock plummeted 14% last Friday alone, bringing its total decline over this seven-week period to approximately 46%. As clearly illustrated on the chart, the price has retreated from a peak of $243 to the $125 range. So, what is the story behind how this once-most-valuable company reached this point?
In reality, this is not merely a stock market correction; it is the result of three major, intersecting storms hitting the same vessel.
First, let’s look at the company’s internal dynamics. Uncertainty within management following a CEO transition, combined with the SEC’s decision to investigate the company’s accounting practices, has severely shaken market confidence. But that is not the whole story. The massive scale of spending on artificial intelligence has led investors to ask: "So much money is being spent—but when will we see a return?"
Meanwhile, macroeconomic headwinds have also shifted. Minutes from the Federal Reserve’s meetings indicate that nearly all officials expect interest rate hikes to continue. A high-interest-rate environment exerts significant pressure on growth stocks, which are valued based on their projected future cash flows. This situation has impacted not only Nvidia but the S&P 500 as well; the index fell 8.6%, marking its worst week since April 2025 and pushing it into correction territory.
Even the major Anthropic IPO that took place last week was not enough to halt this wave of selling. For many analysts, this situation serves as proof that the market is no longer focused on "new narratives," but rather exclusively on "cash flow and profitability." The fact that gold and silver have fallen to their lowest levels in over a year, combined with oil’s decline for the third consecutive week, highlights just how fragile risk appetite has become. Investors have effectively "retreated to their corners."
The most important lesson for individual investors here is that, regardless of how strong a company’s operational performance may be, macroeconomic headwinds and management uncertainties can fundamentally shake its valuation. Nvidia’s core business model remains robust, yet the market is currently pricing in risks rather than the company’s growth story. In times like these, the wisest approach is to avoid leverage and—instead of attempting to call the "bottom"—wait for prices to stabilize.
Do you believe this decline in Nvidia presents a long-term investment opportunity, or are we witnessing the deflation of an artificial intelligence bubble?
#Nvidia #Macro #TechStocks
#ShareWeekly #WCTCS9
Not investment advice.
repost-content-media
NVDA-13.84%
  • 2
  • 2
$NAORIS Up 15% in a day, touching a high of 0.036—is the “breakout pattern confirmed”?
There’s a widely circulated claim: once the price clears the previous high and closes green on heavy volume, the pattern is confirmed and it’ll keep moving up. Sounds convincing, but doesn’t hold up in practice. Today’s 24-hour trading volume was 13.8M. In a 15% green candle, that volume shows there was turnover, but also that selling pressure was absorbed—and being absorbed doesn’t mean it’s all been cleared. Looking at the move from 0.0296 to 0.036, the price has already covered a lot of ground. Structural
NAORIS+0.66%
  • 1
  • 1
U haven't felt enough pain yet
Buckle up alt coiners
$btc
post-image
BTC-0.67%
$DOGE Is Stronger Short-Term but Weak on the 4-Hour Chart—Which Will Turn First?
$DOGE is currently at 0.05517, up 1.174% over 24 hours, with an intraday range of 0.05077‑0.05569. The 1-hour chart looks relatively strong, with the price above EMA20 at 0.05475052. RSI14 is 78.74, nearing overbought territory, but the volume ratio is only 0.2, far below average, indicating limited participation from short-term buyers. A volume ratio of 0.2 means that trading volume over the past hour was only one-fifth of its recent average, making it difficult for buying pressure to persist. The 4-hour chart re
post-image
DOGE-0.22%
Load More

Join 40 M users in our growing community

⚡️ Join 40 M users in the crypto craze discussion

💬 Engage with your favorite top creators

👍 See what interests you

Trending Topics

BTCBreaksBelow60K

2.1M Views30.1K Discussing

BTC fell below $60,000 on November 20 for the first time since July, alongside a tech stock selloff and broader pressure on risk assets. Will $60K become resistance, or can BTC quickly reclaim it? What price or volume signals would convince you that selling pressure is easing?

GateDirectIPOPhase3ANTAllocates92100Shares

799.8K Views4.9K Discussing

NvidiaDropsNearly14Percent

335K Views7.6K Discussing

View More