
Square
Following
Hot
News
Notifications
Profile
Share your thoughts
placeholder
Article
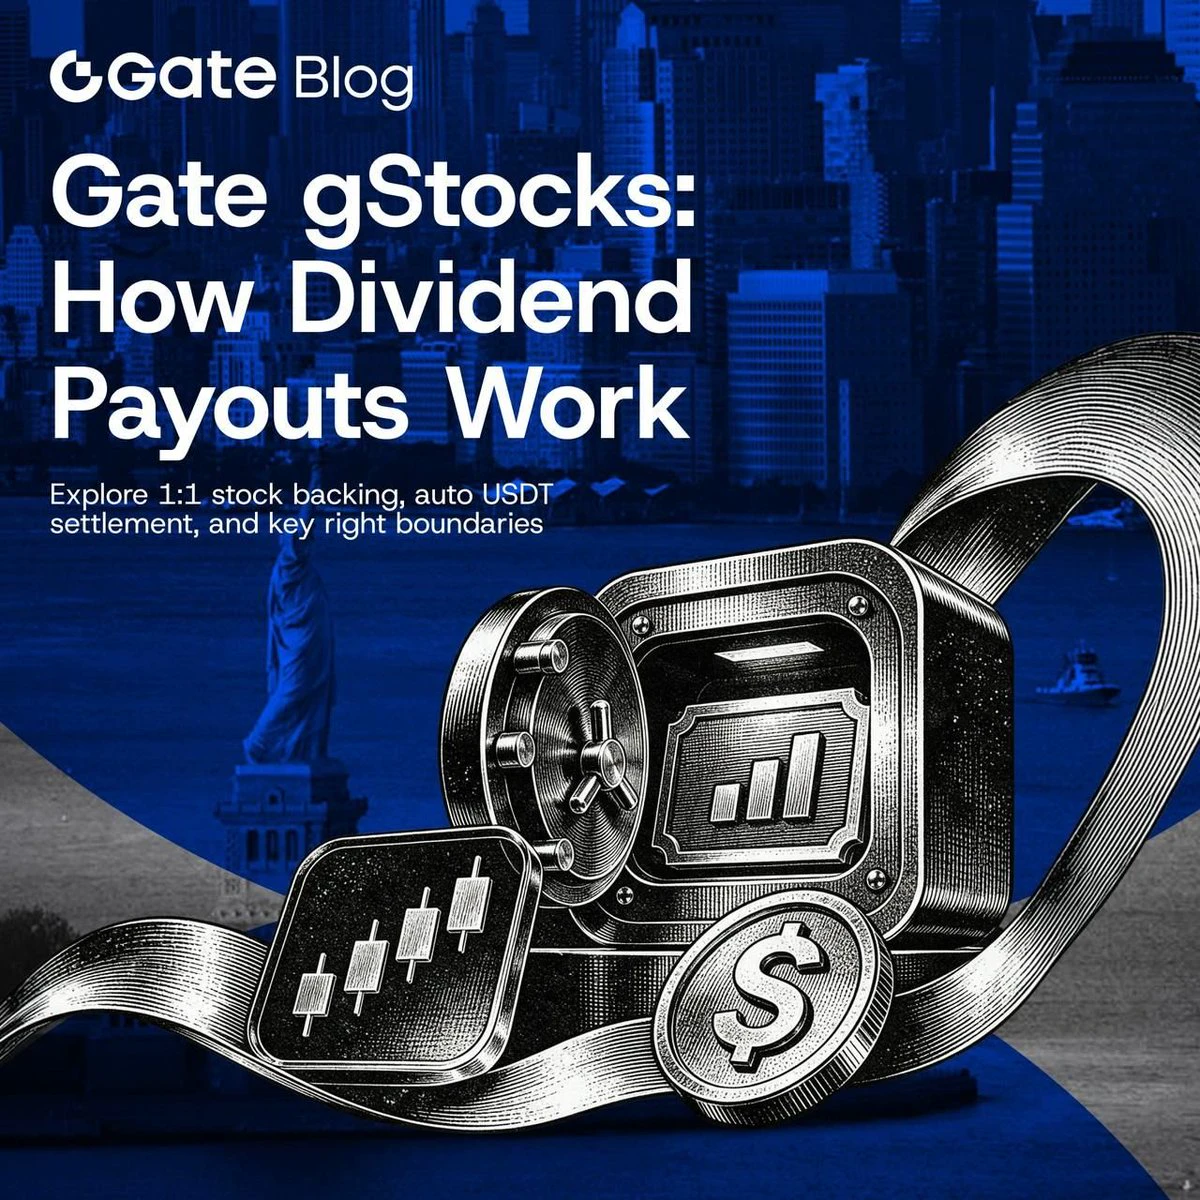
gate gstocks automatically credits eligible stock dividends in usdt, after a 10% withholding tax, with no manual claims required.
#GSTOCKS #DIVIDENDS $GATE
post-image
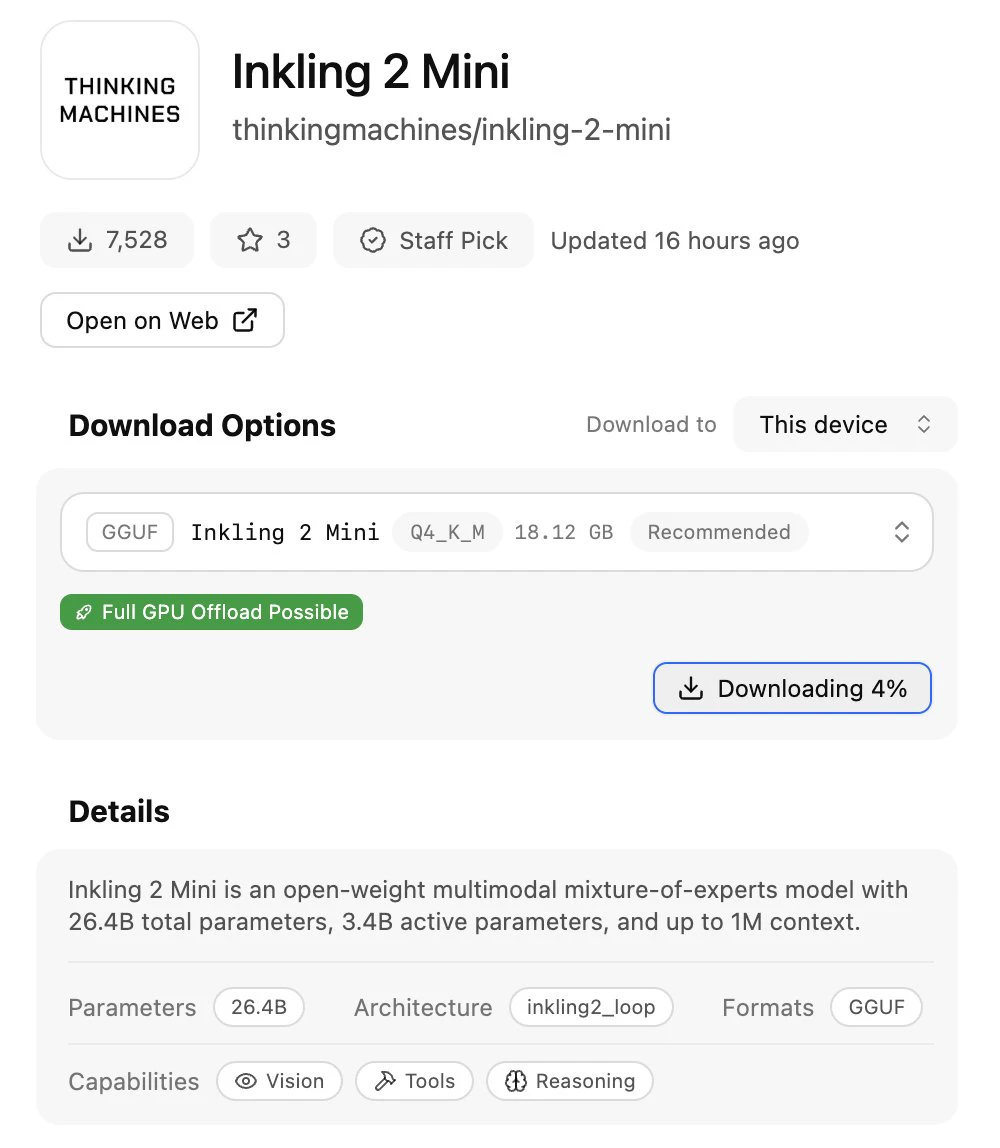
shorted anthropic stock + downloading this
ready for war
post-image
ANT-8.68%
Trenches
PIEVERSE
P
bade
b
PIEVERSE
0x0e...25a9
Market Cap
$
Change
.
24h Vol
$.
Holders
.
FIONA
F
bade
b
FIONA
B34n...pump
Market Cap
$.
Change
.
24h Vol
$.
Holders
.
IDOL
I
bade
b
IDOL
0x3b...ab07
Market Cap
$.
Change
.
24h Vol
$.
Holders
.
Singularity
S
bade
b
Singularity
7R4M...pump
Market Cap
$.
Change
.
24h Vol
$.
Holders
.
PUNANI
P
bade
b
PUNANI
2Tng...pump
Market Cap
$.
Change
.
24h Vol
$.
Holders
.
[New Streamer] Market Prediction
live-cover
LIVE2,604
BTC-0.67%
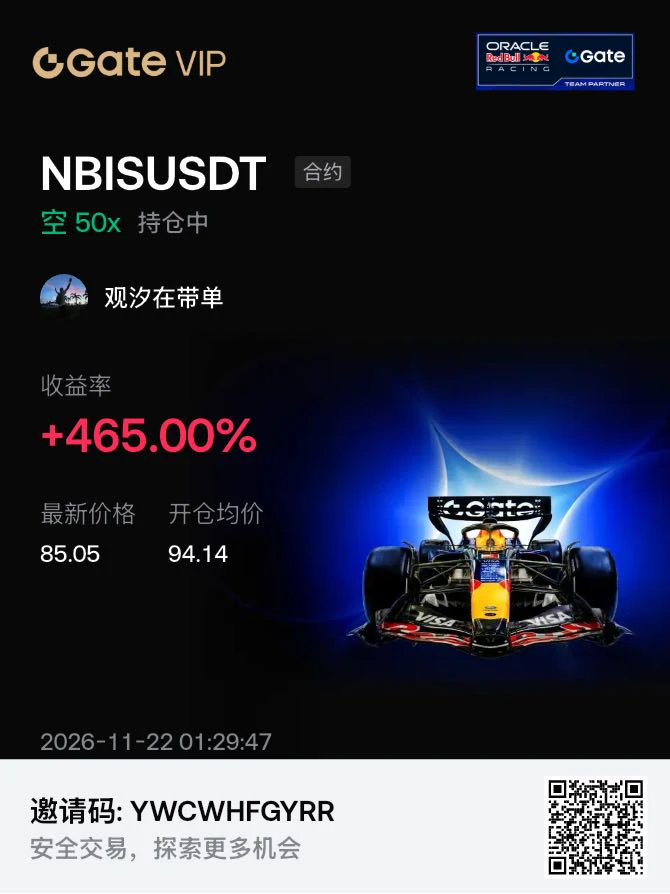
NBIS short position up +465% in unrealized gains overnight: Did I make money on this “computing power retreat”?

I’d just brewed a cup of tea around the close when NBIS dropped 16%, then bounced slightly after hours. My account showed a 50x short, average entry at 94.14, current price 85.05.
$BTC
I’m bearish on the stock: Nebius shares fell from 154 at the end of October to 81.31, nearly halving in a month. On November 20, they dropped 16% in a single day; RSI was around 31, with the indicators in bearish alignment. Q3 revenue was up 571%, an impressive figure, but quarterly capex was $7.3 bi
post-image
BTC-0.65%
SNDK-0.18%
AKE+6.39%
EVAA | Long 🟢 | Bullish | 15m 24h: +12.52% | Volume: 343.7M USDT
Long rationale: Price is above EMA200; EMA20/50/200 are in bullish alignment; RSI14 is 52.0; MACD histogram is positive; ADX14 is 21.0; volume is 0.65x the 20-candle average; trend pullback/continuation.
Entry: 6.2512
Stop loss: 6.01341
Take-profit 1: 6.54844 | Take-profit 2: 6.72678 | Take-profit 3: 6.96457
Entry price is for reference only; do not chase the price. The trading strategy is invalidated if the stop-loss price is hit. Technical analysis only. Not investment advice. $EVAA
post-image
EVAA-0.49%
Day two of copy trading—how’s the performance looking, guys? 🥳
$BTC The starting point of this trade wasn’t a call on direction, but positioning. The moment 56,000 was swept through, what was stacked below were other people’s stop losses, not my thesis. I placed my order at the lower edge of the cluster and waited for the market to burn through the fuel itself.

Only after reclaiming the round-number level and retesting without breaking lower was the structure confirmed. Until then, it was just a resting order; after that, it became a trade. The difference matters more than direction.

I barely did anything in the middle. With a high-leverage position, th
BTC-0.65%
ETH-1.23%
SNDK-0.18%
  • 2
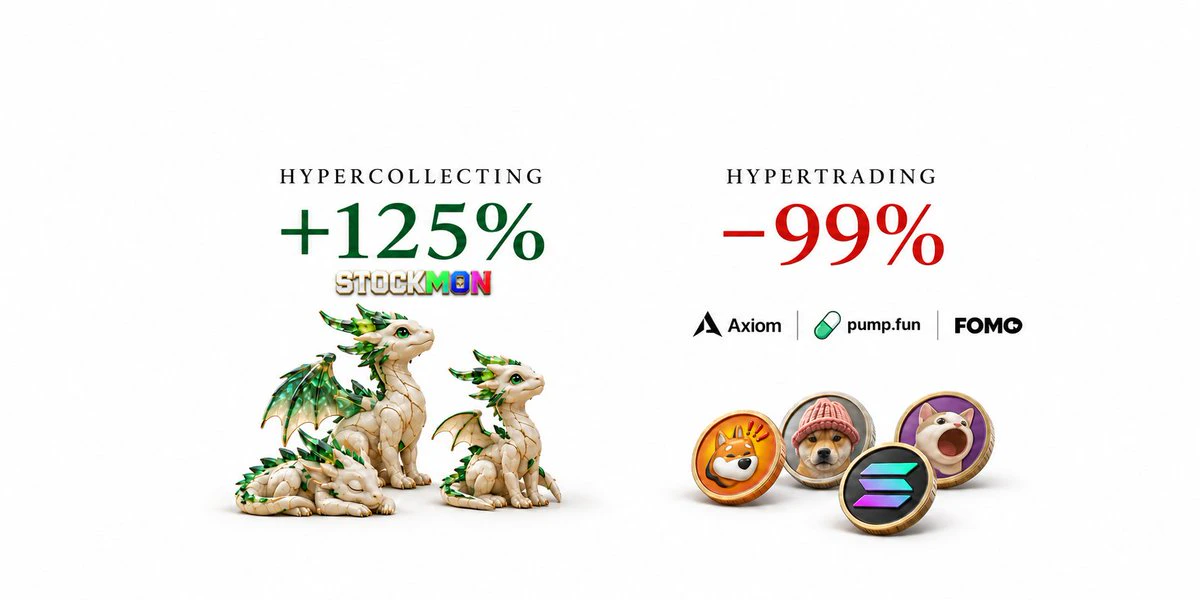
Hypercollecting >> Hypertrading
post-image
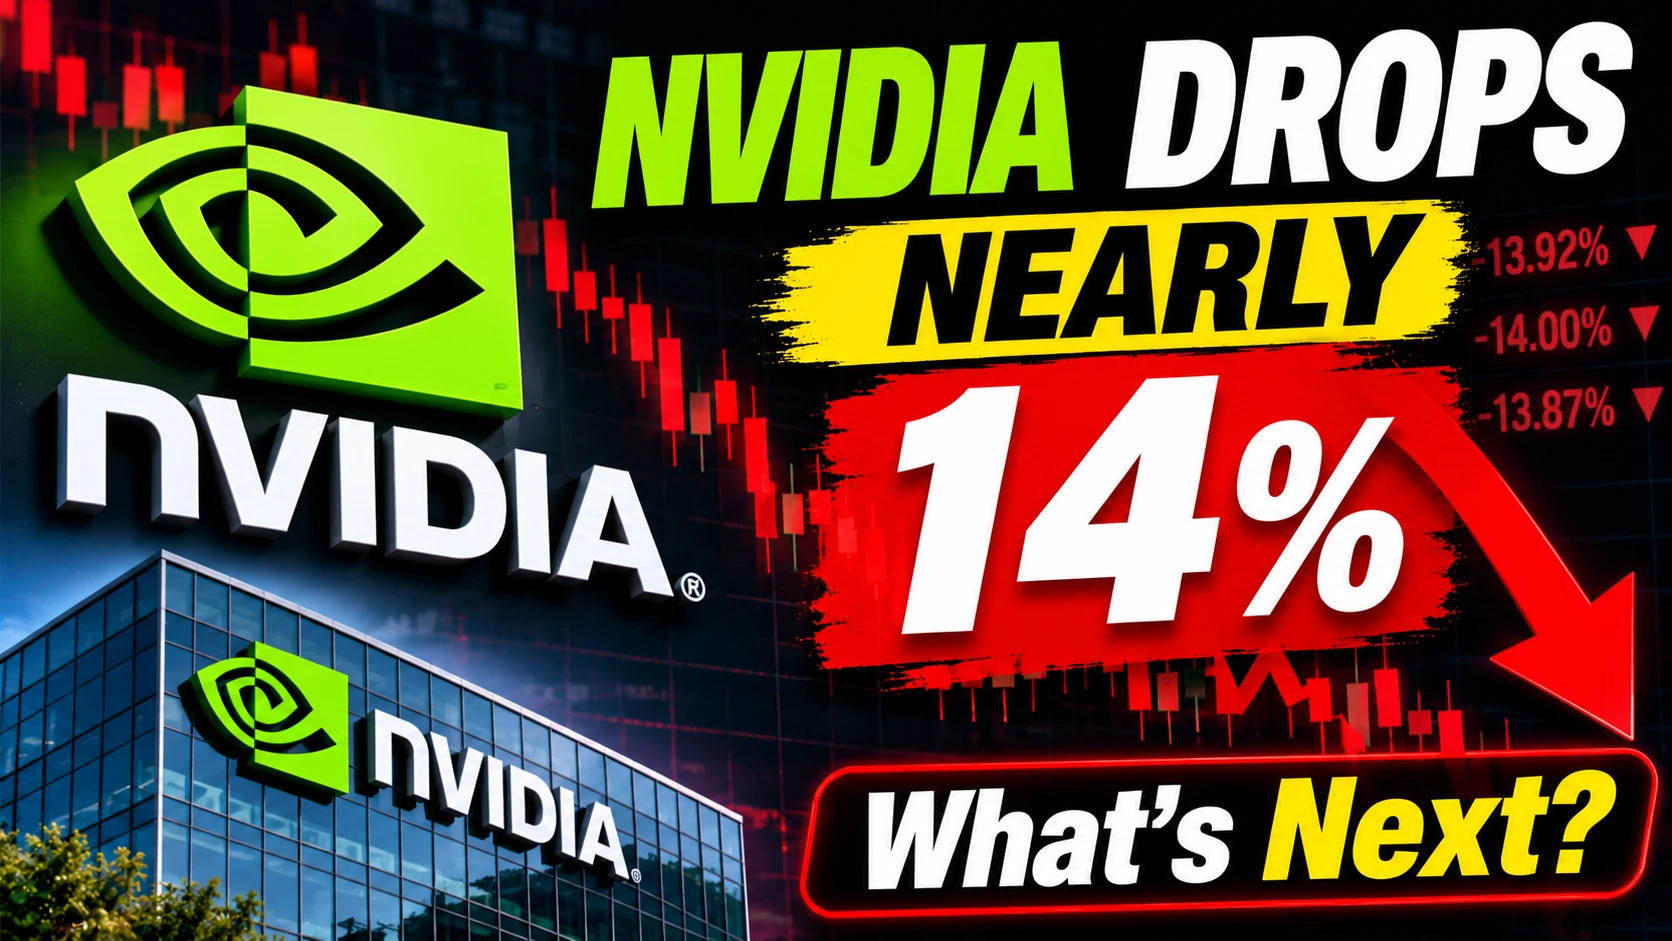
#NvidiaDropsNearly14Percent

Nvidia is facing a major market sell-off, with the stock dropping nearly 14% in a sharp move that has put investors on high alert. A decline of this magnitude can quickly change market sentiment, especially for one of the world’s most closely watched AI and semiconductor companies.

The move highlights how sensitive Nvidia has become to expectations surrounding artificial intelligence, chip demand, earnings growth, valuations, and future investment. After years of extraordinary enthusiasm around AI-related companies, investors are increasingly focused on whether gr
post-image
NVDA-13.84%
I just opened a quick short trade at $O and am entering now, with a sell price of 0.6200 or 0.6350. First target: 0.6000; second target: 0.5800; third target: 0.5600; final target: 0.5400++; stop-loss above 0.6750
post-image
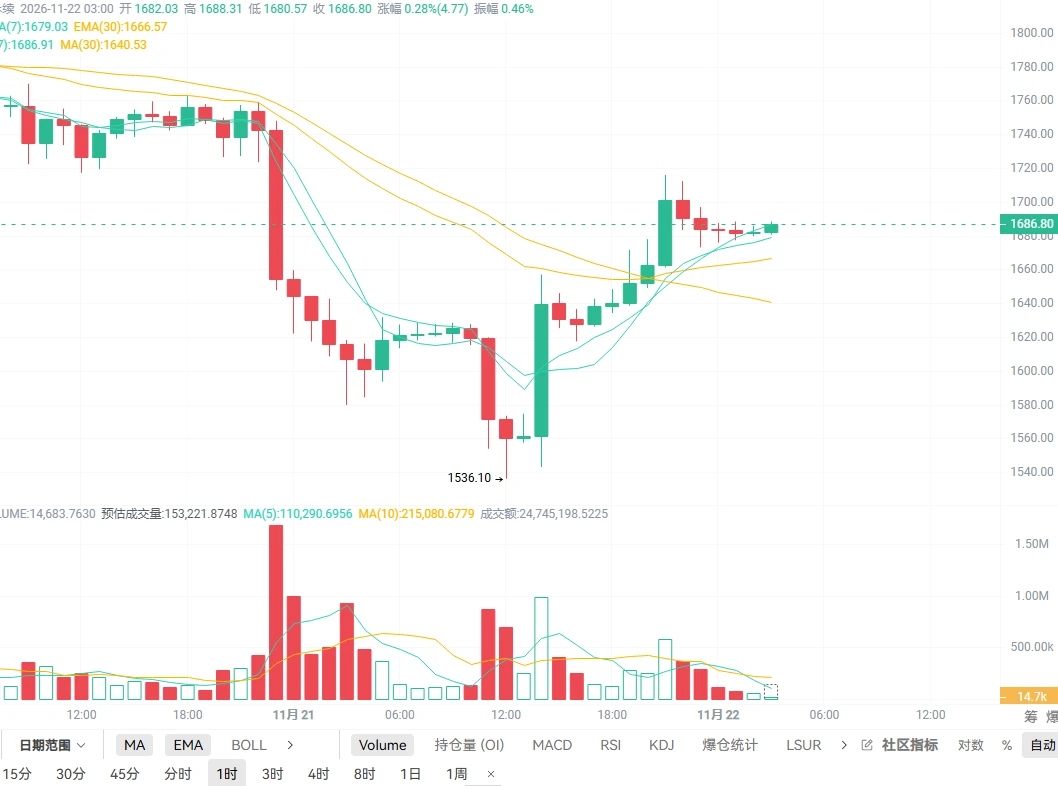
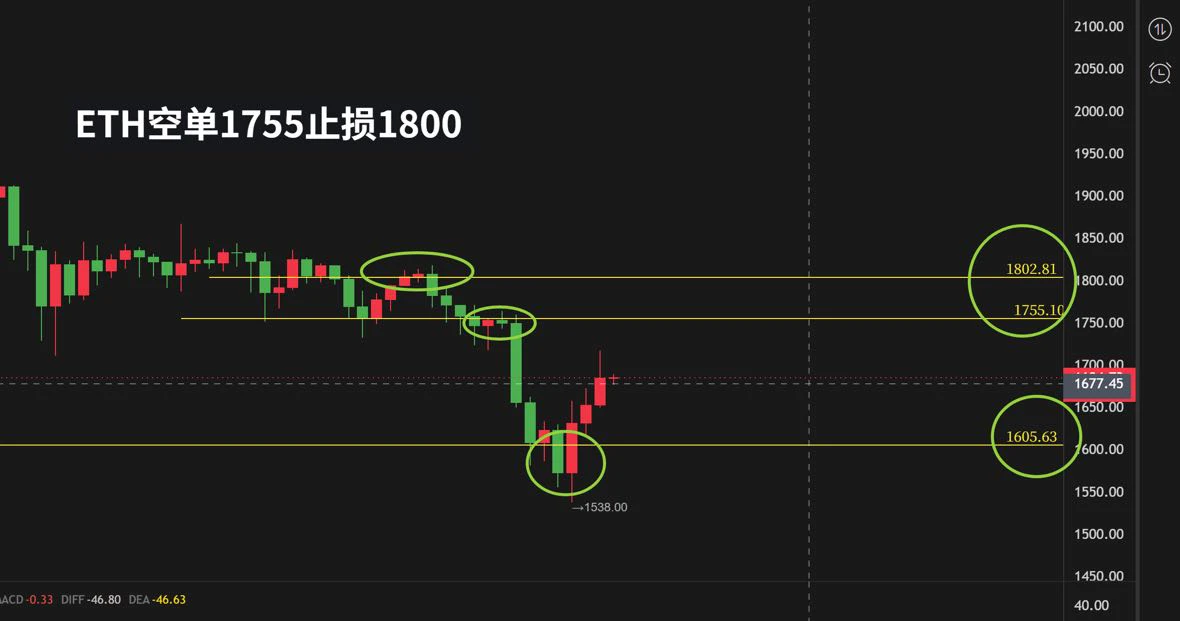
Yang Guang bit | November 22 $ETH Short-squeeze rebound; go short with the trend near medium-term resistance

【Today’s Plan】
Entry: Price rebounds to the 1700–1740 area
Stop-loss: 1770
Take-profit targets:
First: 1640–1620
Second: 1580–1540

【Key Takeaway】
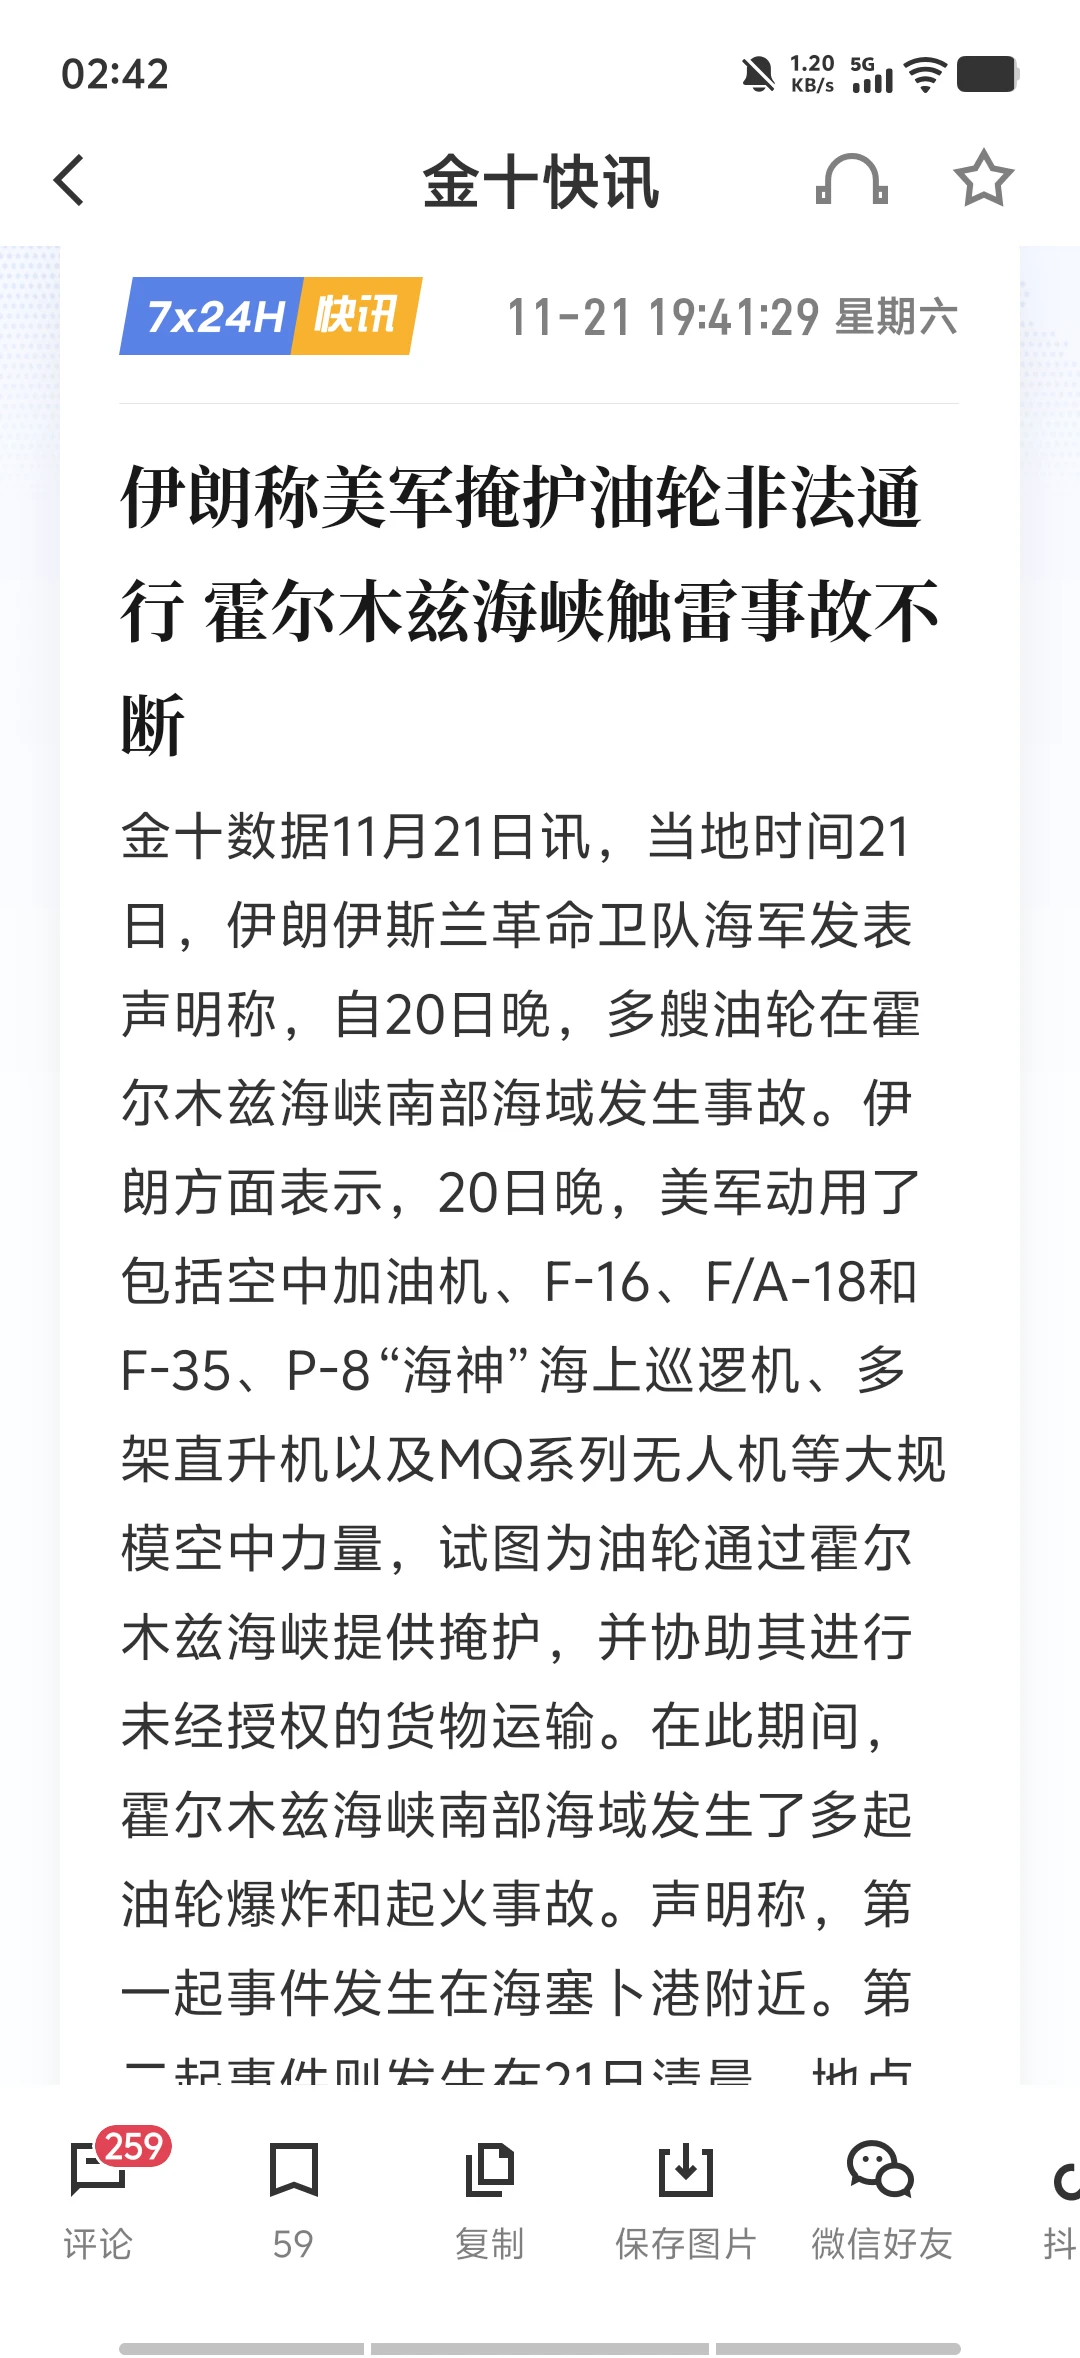
Geopolitically, in line with Bitcoin, the geopolitical risk premium quickly faded after Black Friday. Rising risk appetite drove an oversold rebound across the crypto market, but no agreement has been reached yet, so conditions may remain volatile. Expectations of Fed rate hikes persist, and the high-interest-rate environment puts greater va
post-image
ETH-1.23%
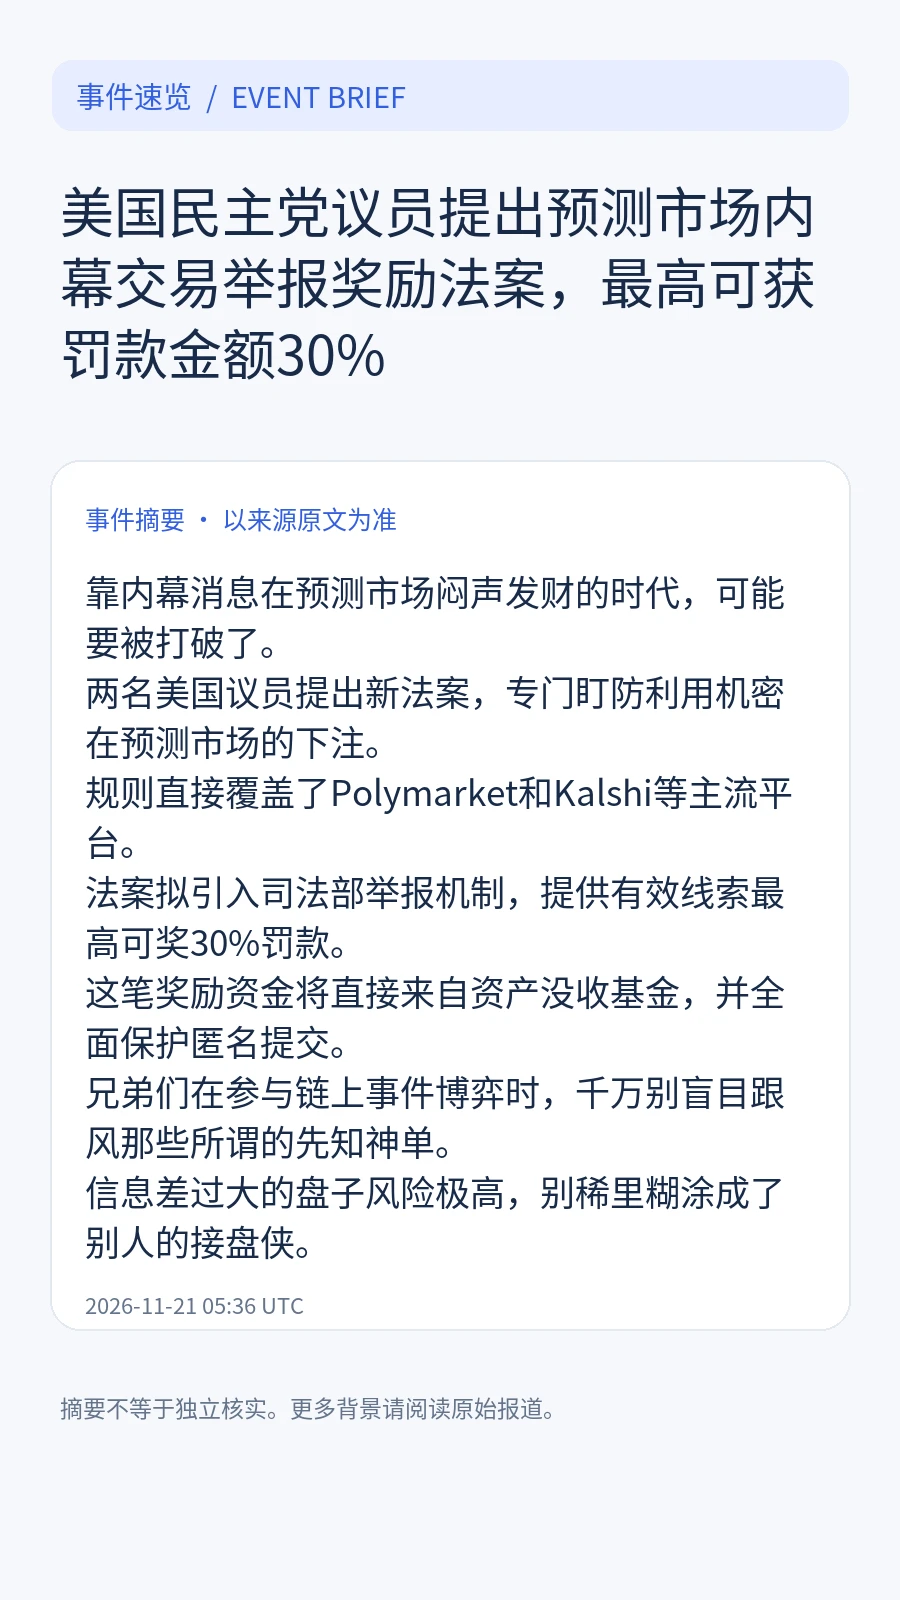
The era of quietly making a fortune on prediction markets with insider information may be coming to an end.
Two U.S. lawmakers have introduced a new bill specifically targeting bets on prediction markets made using confidential information.
The rules directly cover major platforms such as Polymarket and Kalshi.
The bill would establish a whistleblower program at the Department of Justice, offering up to 30% of fines for actionable tips.
The reward money would come directly from the asset forfeiture fund, and anonymous submissions would be fully protected.
Guys, when betting on on-chain events,
post-image
KALSHI+0.00%
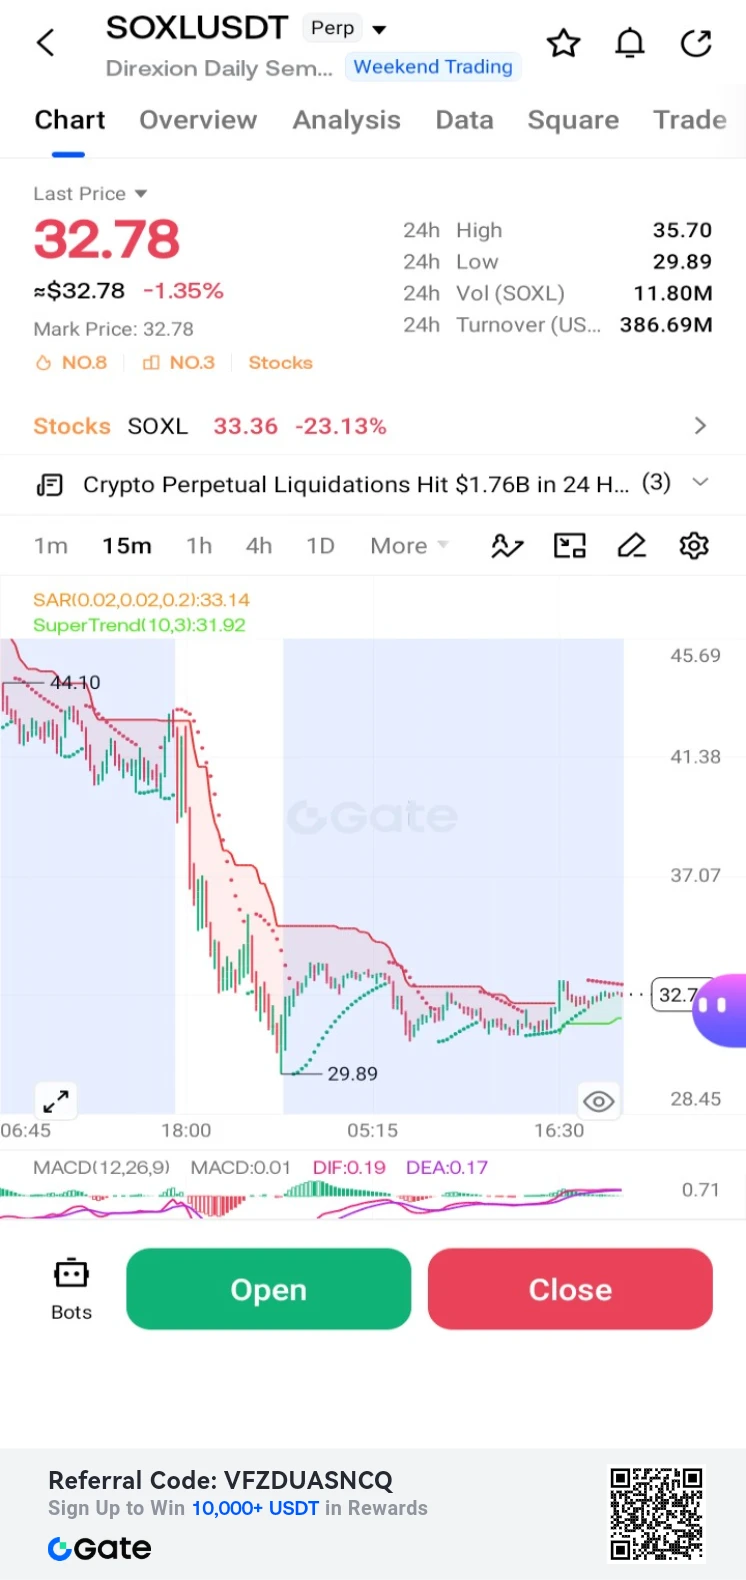
$SOXL /USDT Perp – "Oversold Bounce – Long"**
Trading Plan Long $SOXL
Entry: 32.78
SL: 29.89
TP1: 35.70
TP2: 37.07
SOXL is down -1.35% but showing a slight bounce from the 29.89 low. MACD histogram is stabilizing; targeting the 35.70 resistance.
post-image
SOXL-1.16%
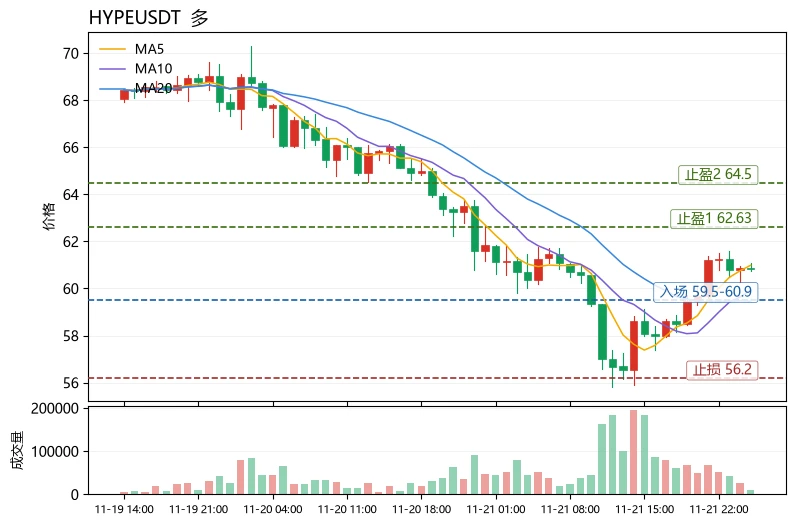
$HYPE Current price: 60.84. The first resistance overhead is the upper Bollinger Band at 62.63, while the first support below is MA20 at 59.46. The dividing line between bulls and bears lies between these two levels. I’m laying out the price levels first because this coin’s current structure is well suited to illustrating a reusable way to read charts: use moving average alignment to judge whether a trend is healthy.
First, the trend structure. MA5=60.98 remains above MA20=59.46, with the short-term moving average above the medium-term one—a nascent healthy bullish alignment. But the gap betw
post-image
HYPE+0.24%
DODO+11.43%
RENDER+0.47%
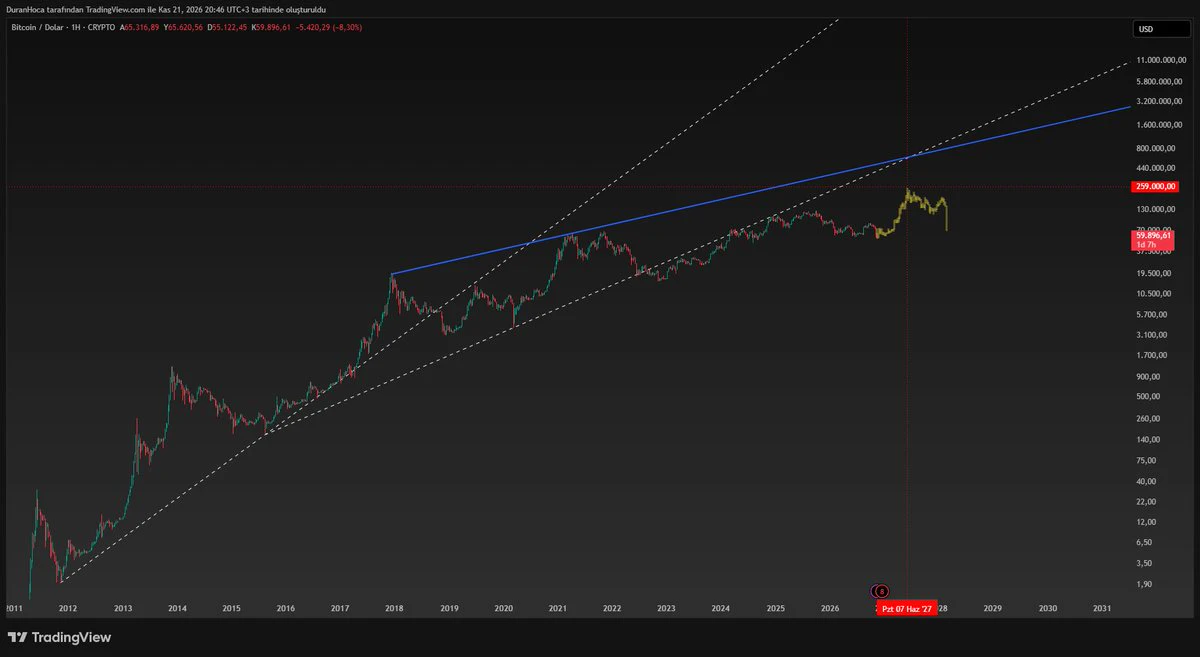
#BTC bitcoin:native
One possibility ...!
post-image
BTC-0.67%
Drop already, I want to buy the dip. Damn, it actually rebounded 5,000 points in one day. Is this still the Bitcoin I know? I really misjudged you. Sorry, Bitcoin😭$BTC $ETH $ZEC ‌ ‌ ‌
post-image
BTC-0.65%
ETH-1.23%
ZEC+1.29%
ETH Wealth Code
11/22
Yesterday, all the long trades from the strategy on the 21st were profitable. Next up: the short strategy
$ETH Short setup, for short trades before noon tomorrow only
post-image
ETH-1.23%
  • 1
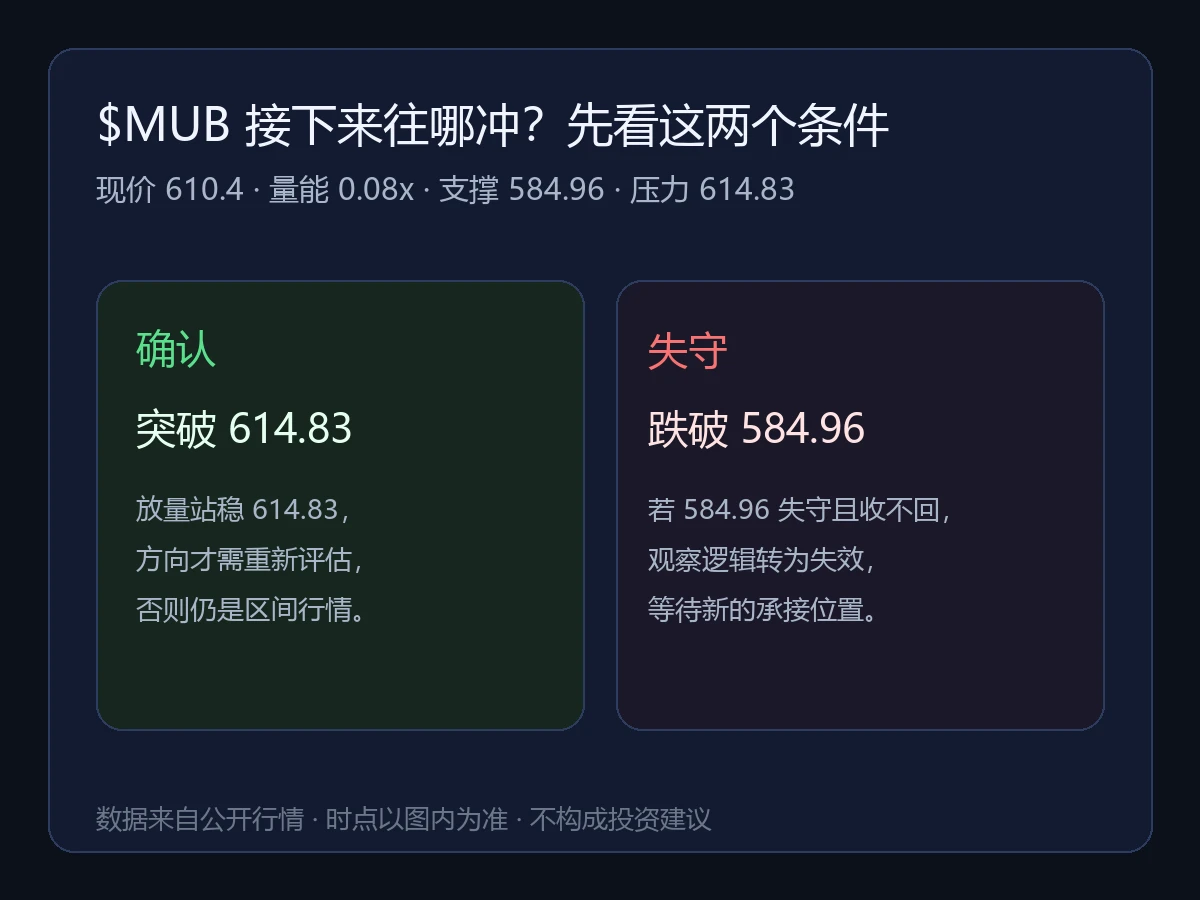
$MUB Strong on the one-hour chart, weak on the four-hour chart; RSI is 70 on one and 12.6 on the other—the timeframes are directly at odds. The current price is 610.4, up 1.20% over 24h, with a volume ratio of 0.08, indicating a clear drop in volume. I’m not chasing shorts. The four-hour chart is this deeply oversold, so cutting now would just mean selling at the lows to those stepping in. I’ll wait for a confirmed rebound: reaching 614.83 would show some strength; breaking below 584.96 means admitting defeat and stopping out. This isn’t about chasing a bounce—it’s about waiting for the market
post-image
btc
live-cover
LIVE707
BTC-0.67%
Load More

Join 40 M users in our growing community

⚡️ Join 40 M users in the crypto craze discussion

💬 Engage with your favorite top creators

👍 See what interests you

Trending Topics

BTCBreaksBelow60K

2.1M Views29.9K Discussing

BTC fell below $60,000 on November 20 for the first time since July, alongside a tech stock selloff and broader pressure on risk assets. Will $60K become resistance, or can BTC quickly reclaim it? What price or volume signals would convince you that selling pressure is easing?

GateDirectIPOPhase3ANTAllocates92100Shares

782.8K Views4.9K Discussing

NvidiaDropsNearly14Percent

328K Views7.6K Discussing

View More