Square
Following
Hot
News
Profile
Share your thoughts
placeholder
Article
#Crypto is about to go parabolic.
God candles loading. 🚀🚀
post-image
#NEARJumpsNearly10%
NEAR Jumps Nearly 10%: Is NEAR Protocol Preparing for Its Next Big Move?
The cryptocurrency market is showing renewed momentum, and NEAR Protocol ($NEAR) is attracting attention after a nearly 10% price jump. This move highlights growing interest in blockchain scalability, AI-related crypto narratives, and next-generation decentralized applications.
🚀 Why Is NEAR Protocol Gaining Momentum?
NEAR Protocol is designed to make blockchain technology faster, more accessible, and easier to use. Its developer-friendly infrastructure, scalable architecture, and focus on improving
BTC+0.48%
Trenches
AGT
A
bade
b
AGT
0x5d...e274
Market Cap
$.
Change
.
24h Vol
$.
Holders
.
CNPY
C
bade
b
CNPY
0xc6...ddd2
Market Cap
$.
Change
.
24h Vol
$.
Holders
.
FOLIO
F
bade
b
FOLIO
0x5f...e411
Market Cap
$.
Change
.
24h Vol
$.
Holders
.
Q
Q
bade
b
Q
0xc0...0589
Market Cap
$.
Change
.
24h Vol
$.
Holders
.
FTR
F
bade
b
FTR
DFMt...pump
Market Cap
$.
Change
.
24h Vol
$.
Holders
.
Why is $A worth singling out within the same sector? The answer lies in relative strength: $A 24h +11.87%, while $DOGE is up just +0.14% and $UNI just +0.03%. The two other active tokens barely moved over the same period, with funds clearly concentrating in $A.
Technically, $A is currently at 0.114, above MA5 (0.11184) and MA20 (0.10932), with the moving averages in a bullish alignment. RSI at 62.2 is strong but not overbought; the MACD histogram is positive, and momentum is still expanding. The Bollinger upper band at 0.117033 is the first resistance. The 30-candle amplitude is 14.04%; combin
post-image
DOGE+0.24%
UNI-0.56%
$Q ’s parabolic rally is finally starting to show signs of fatigue. Are we just waiting for the inevitable pullback, or can buyers launch one last all-out assault? Take-profit: 0.103169 Stop-loss: 0.136730 Market movements: $EPIC : Current price 0.2907 - 24-hour change: +24.76%$SOL : Current price 103.57 - 24-hour change: -0.08%
post-image
EPIC+12.50%
SOL+1.01%
What memecoin will do this? 🔥🚀
post-image
MEME-1.31%
MEMECOIN-9.68%
EIA data determines the short-term direction of crude oil
live-cover
LIVE1,390
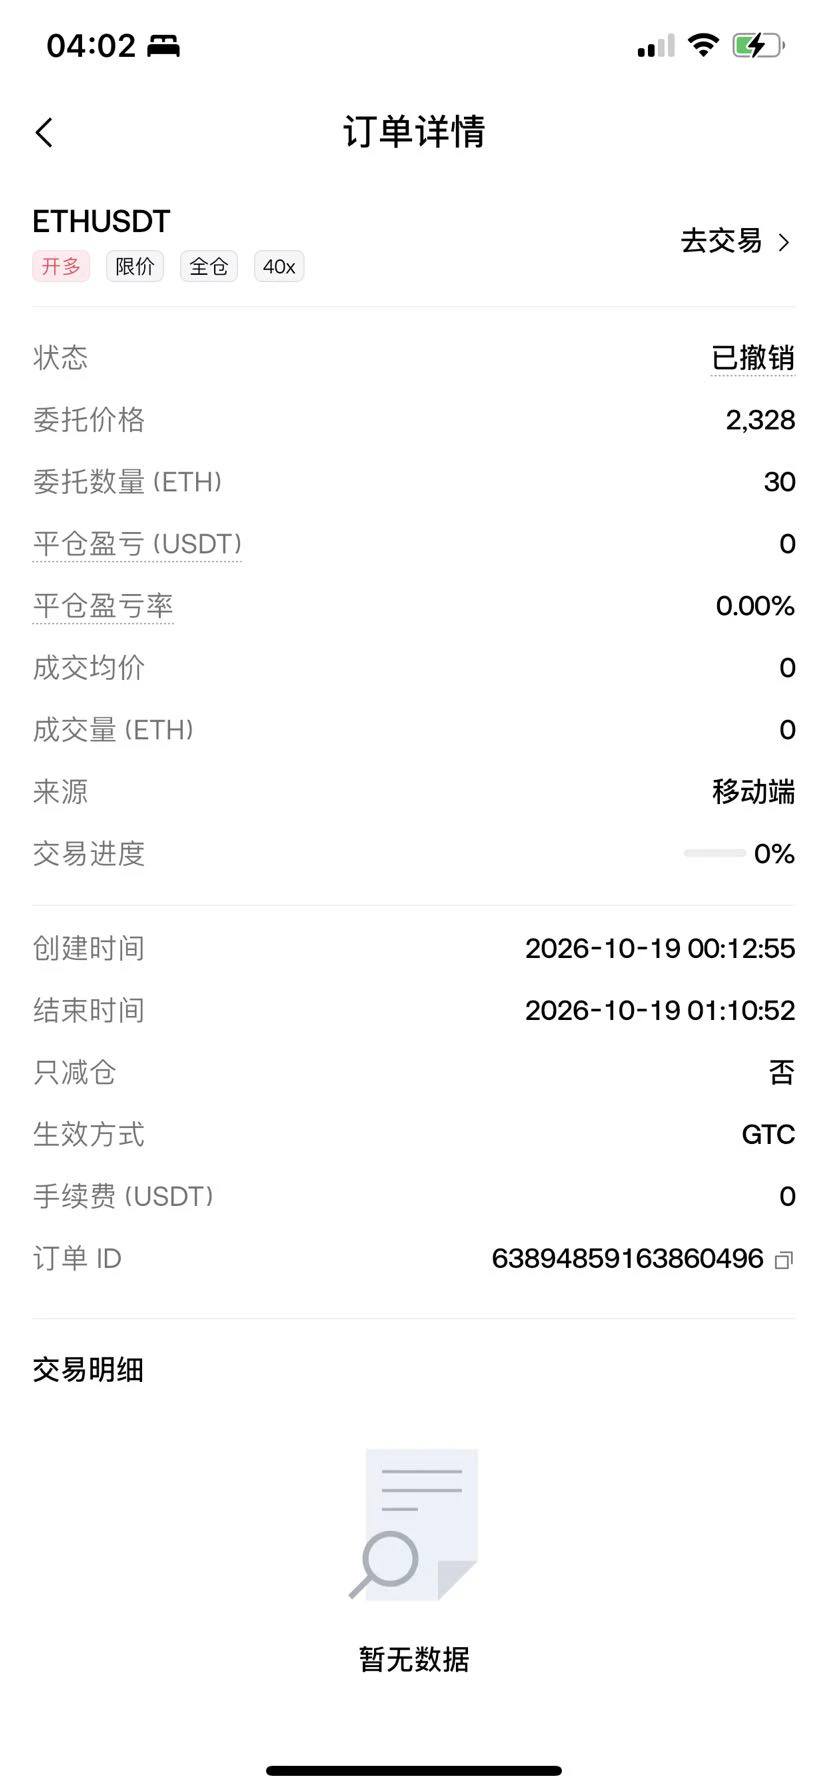
Why hasn't my buy order been filled at the price I posted
Can any expert shed some light on this
$NEAR Short-term outlook: Bullish, but this is a weak rebound rather than a trend reversal; the key is to use the moving-average structure to judge whether the trend is healthy. MA5=4.9252 is still below MA20=5.0484, the bearish moving-average alignment remains intact, RSI=41.7 is in the neutral-to-weak range, and the MACD histogram=-0.01993 remains negative, indicating that mid-term momentum has not turned bullish yet. A reusable approach is to first determine direction from the moving-average alignment, then assess the risk-reward ratio based on the price’s position relative to the Bollinge
post-image
NEAR-0.34%
ALT+11.69%
WLD+0.78%
$FIL I held through this whole move from 1.8 down to 1.05, and only learned to shut up after cutting losses of over $40,000. It’s now at 1.0641, down another 7.28% over 24h, with $165 million in trading volume—volume hasn’t dried up, which means panic selling is still underway. I’m not guessing the bottom; I’m following the data: the previous low of 1.0582 is the line in the sand. If it breaks, I’m looking at 0.9. My plan now: a 30% core position, scaling in between 1.06 and 1.08, selling half on a rebound to 1.15, with strong resistance at 1.22. Stop-loss at 1.03; if it breaks, I take the los
FIL-4.96%
Not sure how people got to the conclusion that rising odds on this polymarket bet equals TGE in December
Leaving aside the fact that there is only $500k traded so far, the rising odds are just an indicator that the vast majority of people is convinced that TGE will be execute by the end of the year
It clearly states in the rules “by” and not “in”
My bet is late November, I’m actually considering the 30% odds might be worth a go
post-image
$DOT is currently in a clearly weak position relative to others in the same sector, but this extreme oversold condition is precisely what warrants attention. Conclusion first: bullish on a short-term rebound, but this is a countertrend recovery rather than a trend reversal.
Compared with the other candidates in the same batch, $EPIC is up 30.66% over 24h, with MA5 crossing above MA20, bullish MACD, and RSI at 58.4—a typical strong performer; $BNB is down just 1.31%, with a 2.97% price swing, making it a heavyweight asset with relative downside resilience. Meanwhile, $DOT is down 6.04%; MA5
post-image
DOT-1.58%
EPIC+12.50%
BNB-0.54%
Stayed up refreshing on a weekend night, just waiting for the last batch of macro data to land. We’ll see once it’s out. This round, both inflation and industrial production data came in above expectations, and nobody can say for sure whether there’ll be another tightening move this year. After watching candlesticks for years, I only believe one thing: few people who bet on data come out ahead.
The market has only just recovered from that brutal beating. Leverage in the market has been wiped out, and the wounds are still fresh.
$ZEC Going to look at spot right now is unusual in itself—heard i
post-image
ZEC+0.76%
Remove two zeros, just like hi
$SUI shows signs of a potential bullish rebound
After an extended downtrend, buyers are trying to regain control near the bottom. If momentum continues and key resistance levels are broken, SUI may begin a stronger recovery. My upside targets: TP1: $1.04 TP2: $1.09 TP3: $1.15 Stop-loss: 0.90 The first major test is to reclaim $1.00 and hold above it.
If the breakout succeeds, the price could move toward $1.20 and eventually reach $1.50. Before anticipating a bigger move, I’ll first watch for confirmation signals.
$SUI
post-image
SUI-1.88%
$Q Warning‼️ A market plunge is coming
post-image
Q+122.65%
Cracking day on the Yorkshire Three Peaks yesterday
That climb up Ingleborough is no joke!
post-image
#交易机器人# I'm using a SOLUSDT futures grid bot on Gate; join me in copy trading
post-image
$AVA Is This Rally Built to Last?
$AVA gained 4.65% on the 1H chart, but short-term momentum alone doesn’t confirm a sustainable uptrend.
The key is follow-through: can buyers defend the gains, maintain trading activity, and absorb profit-taking?
If demand holds, momentum could continue. If buyers lose control, a pullback remains possible.
Would you enter now or wait for confirmation?
#AVA #Travala #CryptoAnalysis
post-image
AVA+33.93%
TODAY MARKET UPDATE ABOUT BTC AND ZEC AND BTW
live-cover
LIVE436
I got my start with traffic fees. Give me two months and I should be able to hit A5
post-image
Load More

Join 40 M users in our growing community

⚡️ Join 40 M users in the crypto craze discussion

💬 Engage with your favorite top creators

👍 See what interests you

Trending Topics

USSeptemberPPIBeatsExpectations

91.35k Views1.93k Discussing

US September PPI came in at 6.3% YoY, well above the 5.3% market expectation, pointing to renewed producer-side inflation pressure. Weekly jobless claims were 199K, broadly in line with forecasts. Could hotter inflation further reduce room for rate cuts, and what does it mean for $BTC, US stocks, and gold?

GateWCTCS9GlobalTradingCompetition

37.87k Views6.67k Discussing

GateBTCAndETHFuturesVolumeRanksTop3

53.8k Views1.81k Discussing

View More