Square
Following
Hot
News
Notifications
Profile
Share your thoughts
placeholder
Article
BTC NEWS
live-cover
LIVE1,162
#KOR One huge bearish candle, and we're meeting in hell—down over 2,000 U, sigh
  • 2
Trenches
ZIG
Z
bade
b
ZIG
0x8c...1145
Market Cap
$.
Change
.
24h Vol
$.
Holders
.
STONK
S
bade
b
STONK
6GmA...UNgx
Market Cap
$.
Change
.
24h Vol
$.
Holders
.
IDOL
I
bade
b
IDOL
0x3b...ab07
Market Cap
$.
Change
.
24h Vol
$.
Holders
.
MAGGIE
M
bade
b
MAGGIE
8rHo...PmZV
Market Cap
$.
Change
.
24h Vol
$.
Holders
.
FLOAT
F
bade
b
FLOAT
Bv1a...BMmr
Market Cap
$.
Change
.
24h Vol
$.
Holders
.
OpenAI CFO: Data center investments will not change due to the midterm elections.
live-cover
LIVE2,030
##GateLaunchesPoSECProofOfSecurity

Gate continues to strengthen its commitment to security and user protection with the launch of PoSEC (Proof of Security). This is an important step toward building a safer, more transparent, and more reliable cryptocurrency trading environment.

In the cryptocurrency industry, security is one of the most important things for every exchange. Users want confidence that their accounts, personal information, and digital assets are protected. Strong security systems help build trust and make the trading experience more comfortable.

PoSEC Proof of Security highli
  • 3
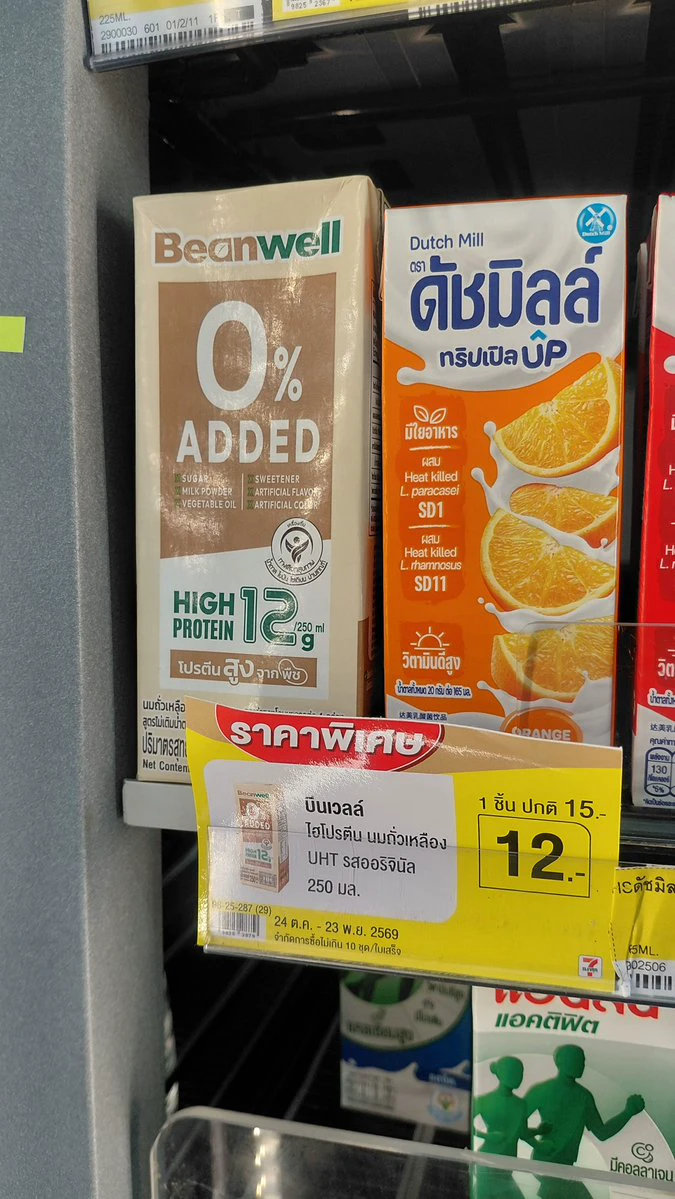
Does Beanwell taste good?
post-image
Are you guys still sticking with AGC
I did the math on today's freebie and only claimed 3u🤣
If you're not continuing, then that's that. Looks like agents are about to fizzle out
$AKE This coin really isn't suited for going long. When it gets dumped, there's no hesitation at all—30% or 35% drops seem like child's play, and bulls don't even get a chance to catch their breath. By contrast, $ONE has a much steadier trend and rarely sees those cliff-like crashes. Both coins have enough activity, so swing trading could definitely have potential, but if you're going long, $ONE is clearly more reliable than $AKE . Risk warning: The above is solely my personal opinion. Cryptocurrencies are highly volatile, and contract trading carries extremely high risks, so please make de
post-image
AKE+6.07%
How to Build Your Own BTC Trading System: From Random Trading to Consistent Execution

In the BTC market, many people study new technical indicators every day: MACD today, RSI tomorrow, and then a new trading strategy the day after. But even after learning a lot, they still have no clear rules when it comes time to place a trade, eventually falling into a cycle of repeated losses and constantly changing methods.
To change this, the first step is to build a trading system of your own.
First, determine your trading style. Based on your available time and risk tolerance, choose short-term, swing,
post-image
BTC-0.67%
Tong Ge's 11.8 BTC setup
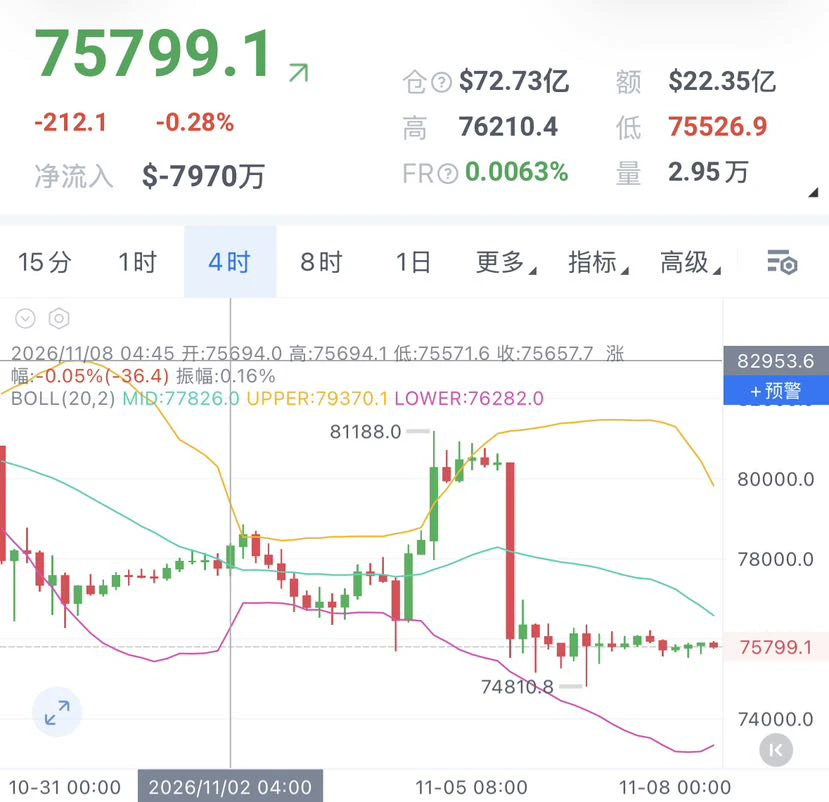
$BTC Short near 763-768, stop loss at 773, targets 750-745-740.

Weekend market: liquidity is thin and the order book is light, so one large order could create a long wick.
There are two things to fear most in this kind of market: chasing breakouts and holding losing positions. False breakouts are common on weekends, so don't rush to chase a direction just because the price suddenly surges.

Now, looking at the structure: BTC plunged from 81188 to 74810, then moved sideways in the 750-760 range for three days.

The decline has indeed slowed, but slowing down doesn't me
post-image
BTC-0.65%
With the same 1000U, the outcomes can be worlds apart. $MAGMA Today’s market is a textbook example—the price is now 0.2523, down nearly 11% in 24 hours, with a high of 0.2858 and a low of 0.2491. The price is now practically scraping the floor, and the 12.3M trading volume shows plenty of money is fleeing. People in the group were still calling for buying the dip this morning; now they’ve all gone silent.

Bullish view: 0.2491 is today’s solid floor, less than 1.3% below the current price. The bet is on an oversold bounce. Set a stop-loss below 0.245, keep your position under 20%, and aim to c
MAGMA-0.57%
$HUMA Only 9 hours left to determine whether 0.0116 is rock bottom or just halfway down. It’s at 0.0117 now, down 9.3% in 24 hours, with the low of 0.0116 right beneath us. Trading volume of 17.3M shows panic selling on rising volume—this kind of high-volume plunge is either the final drop or the prelude to a sell-off, with no middle ground.
Let’s run through the scenarios. First, if the 4-hour candle at 0.0116 closes with a lower wick and shrinking volume, that’s a spot to try for a short-term bounce: enter near 0.0117, set a stop-loss at 0.0112 (exit if it breaks the previous low), and targe
HUMA-1.99%
From a functional standpoint, could an emotional companion robot be considered an advanced silicone sex doll? Does it serve any purpose other than satisfying sexual desire?
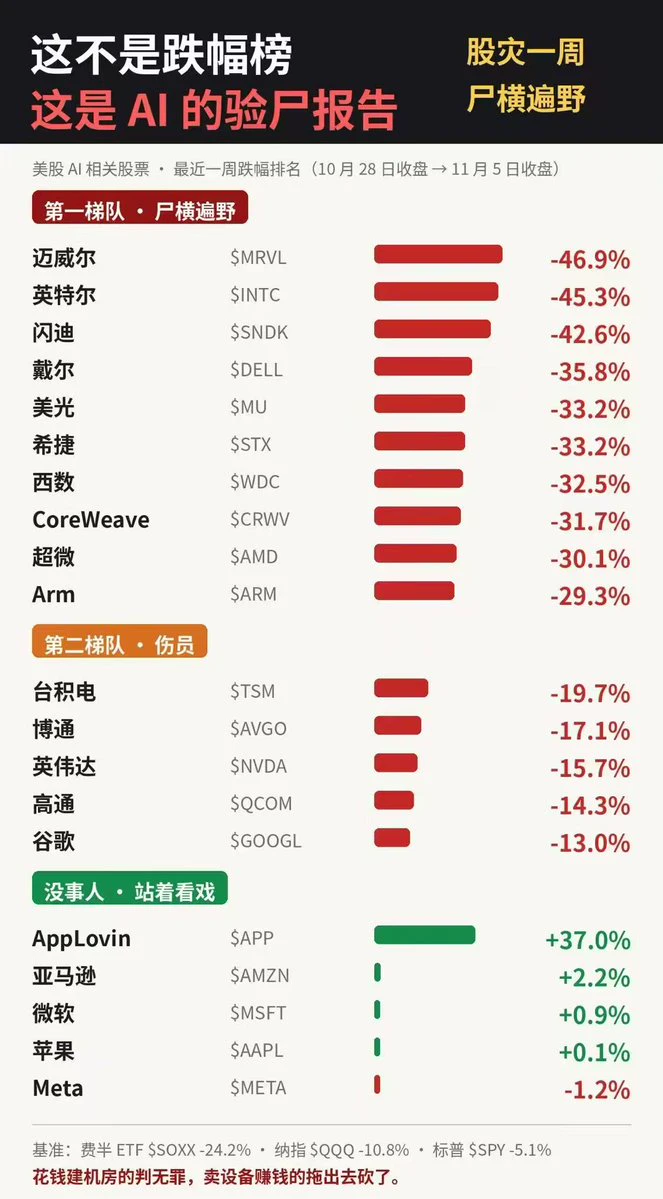
U.S.-listed AI stocks have taken a beating lately, especially computing, storage, and semiconductor stocks, which had surged the most before.
Take a look at this chart, from October 28 to November 5:
Marvell -46.9%
Intel -45.3%
SanDisk -42.6%
Dell -35.8%
Micron -33.2%
Western Digital -32.5%
CoreWeave -31.7%
AMD -30.1%
Even NVIDIA, Broadcom, and TSMC fell 15%–20%.
By contrast, tech giants like Microsoft, Apple, and Amazon have held up relatively well.
In this AI boom, GPU sellers are making money, server sellers are making money, storage sellers are making money, while data center builders are
post-image
INTC+8.00%
SNDK+3.53%
CRWV+6.18%
AMD+11.55%
NVDA+2.80%
  • 1
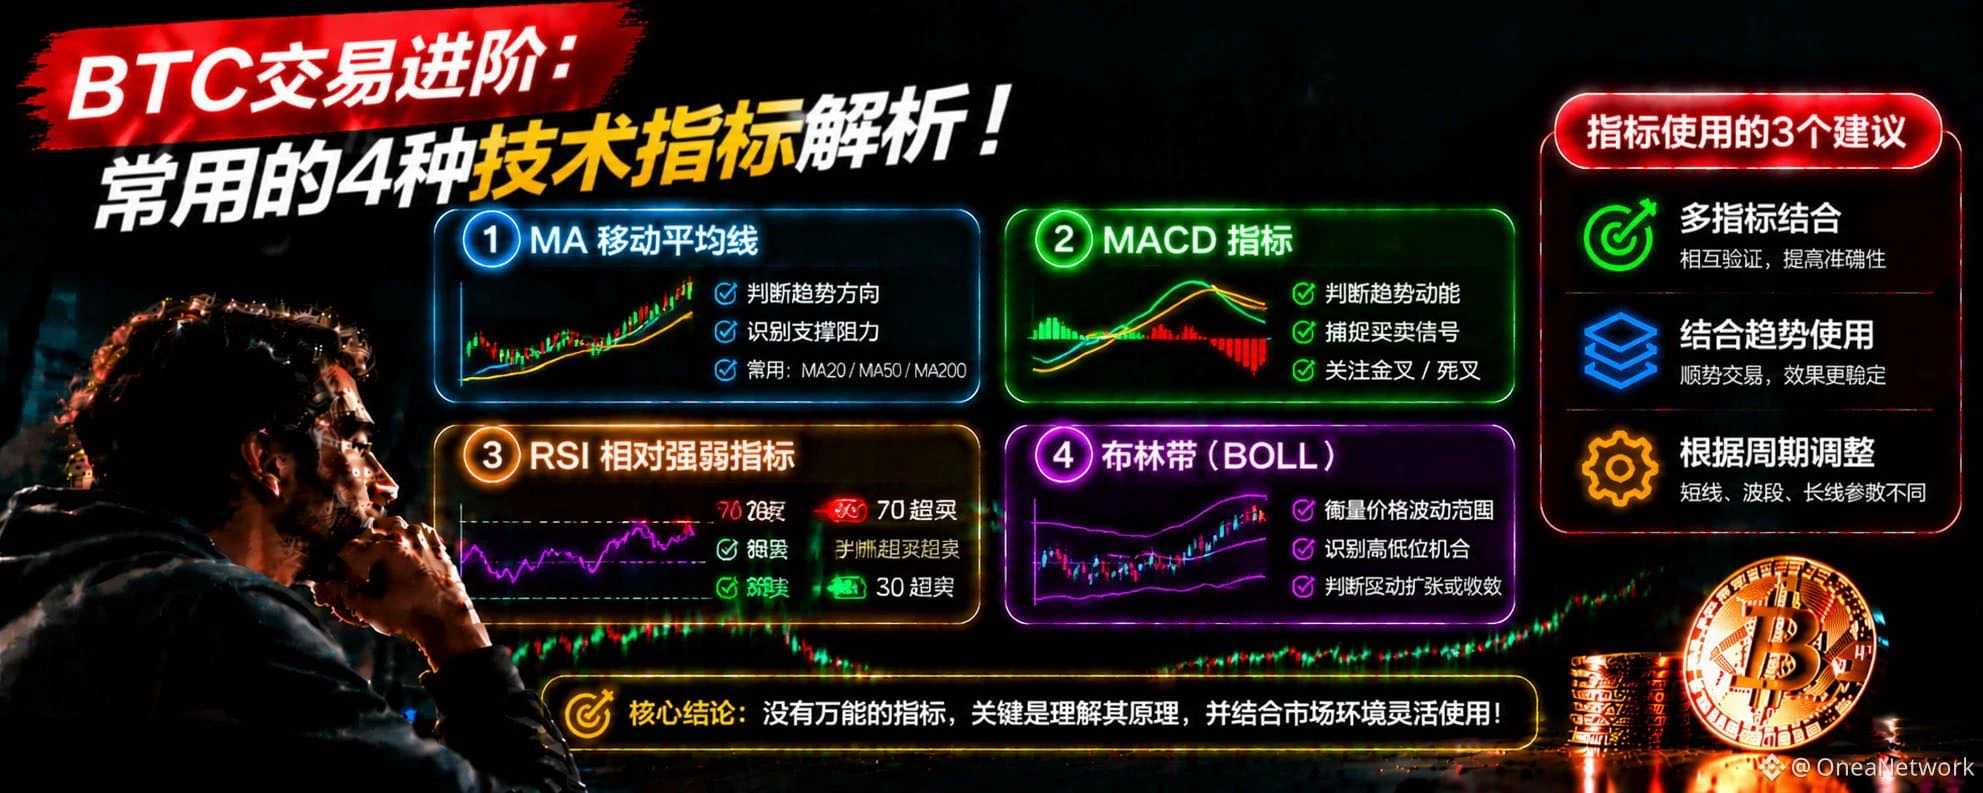
Multiple indicators give conflicting signals in BTC trading—which should you trust?
In BTC technical analysis, many traders are accustomed to using MA, MACD, RSI, and Bollinger Bands at the same time, hoping that multiple indicators will improve their judgment. But in actual trading, a common situation is that MA shows an uptrend, RSI has already entered overbought territory, and MACD shows signs of weakening momentum. In this situation, should you go long or short?
First, prioritize assessing market structure. Technical indicators are only auxiliary tools; price itself is the market’s most di
post-image
BTC-0.67%
BIRB | Short 🔴 | Bearish | 15 minutes 24 hours: -8.15% | Volume: 25.6M USDT
Short rationale: Price below EMA200; EMA20/50/200 in bearish alignment; RSI14 at 37.8; MACD histogram negative; ADX14 at 36.4; volume at 0.57x the 20-candle average; trend pullback/continuation.
Entry: 0.08865 Stop-loss: 0.0903247 Take-profit 1: 0.0865567 | Take-profit 2: 0.0853007 | Take-profit 3: 0.083626
Entry is for reference only; do not chase the price. The setup is invalidated if the stop-loss level is reached. For technical analysis only, not investment advice. $BIRB
post-image
BIRB-16.68%
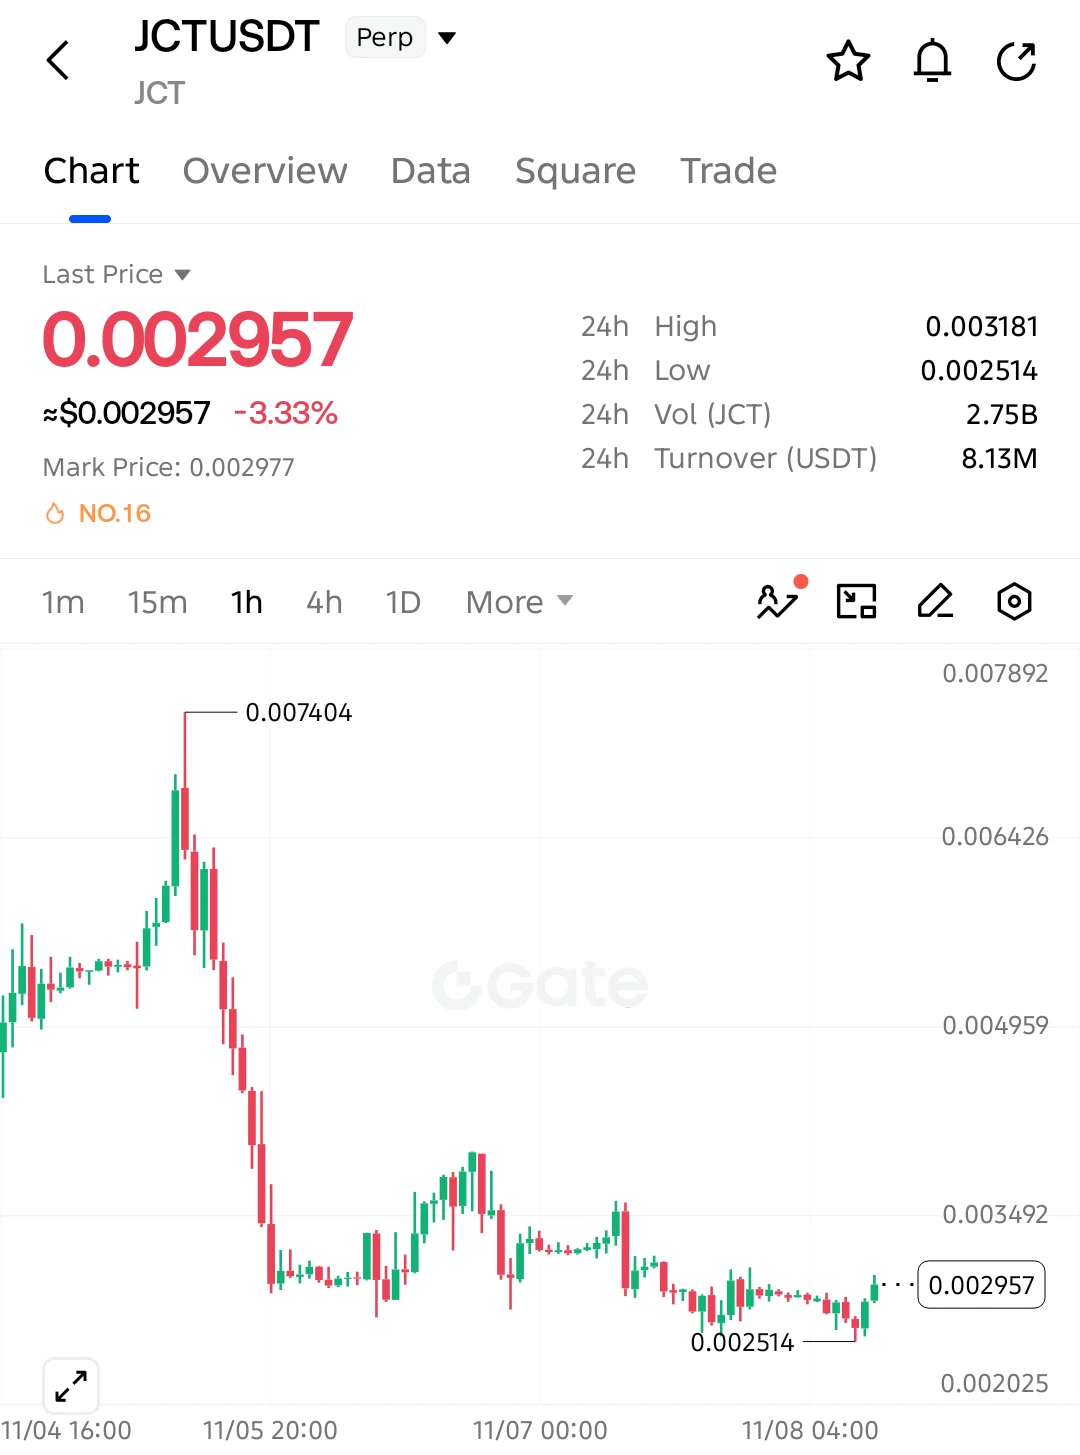
$JCT SHORT SETUP — BEARS EYE ANOTHER BREAKDOWN!

$JCT remains under heavy selling pressure after crashing from 0.007404. The recent bounce looks weak, and sellers could trigger another downside move!

Entry: 0.002957
SL: 0.003150

TP1: 0.002750
TP2: 0.002600
TP3: 0.002514
Final Target: 0.002300

The broader trend remains bearish, with lower highs and weak recovery attempts. Buyers are struggling to regain control, while a rejection near 0.003000 could bring renewed selling pressure toward 0.002514 and potentially lower.

Invalidation: A sustained recovery above 0.003150 weakens the bearish set
post-image
JCT-3.26%
#70%山寨币跌破200日均线 70% is a high proportion, but still far from extreme oversold territory. For now, it looks more like the market is continuing to weaken; there is no clear sign that a reversal is near.
The proportion has rebounded quickly: At the beginning of October, only about 10% of altcoins were below this line, but it has since risen to 70%, showing that the decline came quickly.
Still far from extreme oversold territory: At the end of June, this proportion once reached about 84%. Some analysts believe that only a reading above 90% counts as an extreme oversold signal.
The drivers are macr
BTC-0.67%
ETH-1.26%
SOL-0.77%
USDC+0.01%
Load More

Join 40 M users in our growing community

⚡️ Join 40 M users in the crypto craze discussion

💬 Engage with your favorite top creators

👍 See what interests you

Trending Topics

USCPIDataIncoming

3.48k Views1.51k Discussing

The U.S. October CPI report will be released on November 10 at 8:30 a.m. ET. September CPI came in at 3.7% year over year, and markets will be watching closely for signs that inflation is cooling, especially in core CPI. A softer-than-expected reading could strengthen rate-cut expectations, while hotter inflation may pressure risk assets through higher Treasury yields and a stronger dollar. How do you think this CPI print will move $BTC, U.S. stocks and gold?

USAIStocksHitHard

24.54k Views3.7k Discussing

USNonfarmPayrolls

43.56k Views4.43k Discussing

View More