Square
Following
Hot
News
Notifications
Profile
Share your thoughts
placeholder
Article
According to a report by The Information cited by IT Home, amid a global DRAM shortage and rising prices, TSMC is said to be researching the development of 3D DRAM at Nvidia’s request. If pursued, this could open up a new business, but would also expose the company to cyclical risks. TSMC denied the report, saying it would focus on logic chip foundry services.

The official position is that TSMC only does logic chip foundry work. However, the report cited two people familiar with the matter who said that, following a request from Nvidia, TSMC had begun developing a plan to manufacture 3D DRAM,
post-image
TSM+6.60%
NVDA+2.80%
BTC-0.67%
Market update
live-cover
LIVE2,008
Trenches
ZIG
Z
bade
b
ZIG
0x8c...1145
Market Cap
$.
Change
.
24h Vol
$.
Holders
.
STONK
S
bade
b
STONK
6GmA...UNgx
Market Cap
$.
Change
.
24h Vol
$.
Holders
.
IDOL
I
bade
b
IDOL
0x3b...ab07
Market Cap
$.
Change
.
24h Vol
$.
Holders
.
MAGGIE
M
bade
b
MAGGIE
8rHo...PmZV
Market Cap
$.
Change
.
24h Vol
$.
Holders
.
FLOAT
F
bade
b
FLOAT
Bv1a...BMmr
Market Cap
$.
Change
.
24h Vol
$.
Holders
.
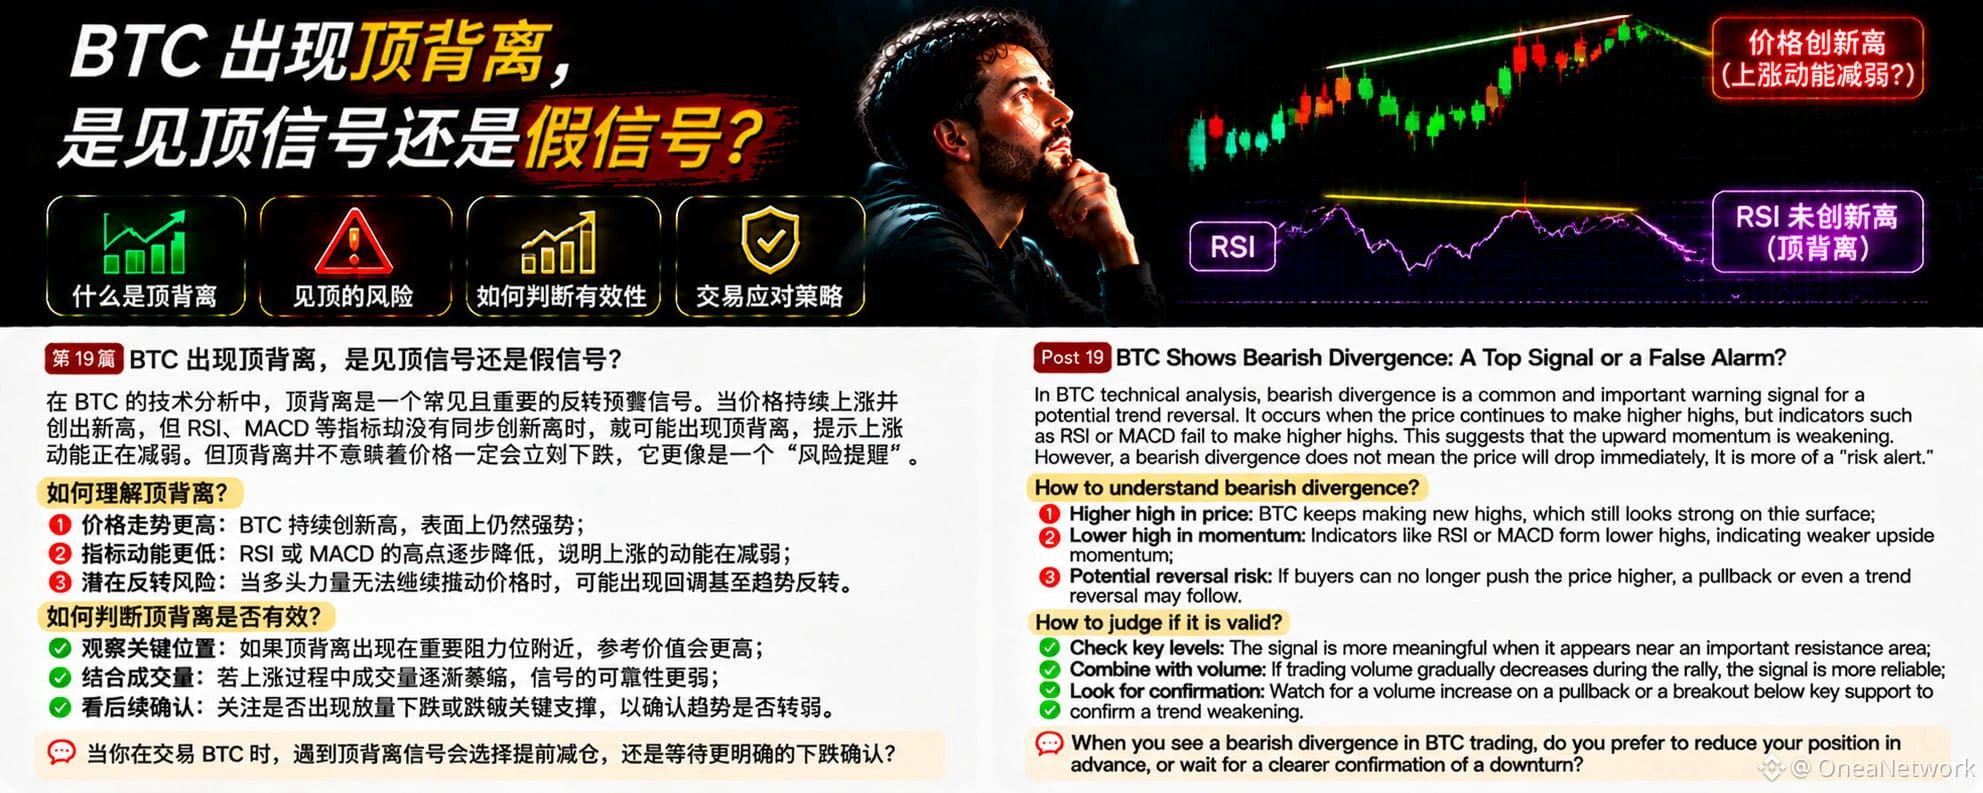
In BTC technical analysis, bearish divergence is a risk warning signal worth watching. Many traders see prices continually making new highs and assume the uptrend remains strong. But if prices continue to rise while indicators such as RSI or MACD fail to make new highs, bearish divergence may occur.
What is bearish divergence?
Simply put, it is when the price makes a higher high, but the technical indicator forms a lower high. This suggests that although the price is still rising, the momentum driving the rise may be weakening.
Why is bearish divergence worth watching?
First, upward momentum m
post-image
BTC-0.67%
How can you quickly reset your trading mindset after consecutive losses in BTC?
In BTC contract trading, consecutive losses are a phase many traders go through. The real danger is not the losses themselves, but the chain reaction that follows: rushing to break even, opening positions too frequently, continually increasing leverage, or even starting to violate your original trading plan. In the end, an ordinary loss can escalate into a greater risk to your account.
So, how should you reset after consecutive losses?
First, stop impulsive trading. If you’ve had several losing trades in a row, don
post-image
BTC-0.65%
Market opportunities are always there,
but opportunities that are yours are rare.
Market action that doesn't fit your trading framework,
no matter how lively, has nothing to do with you.
Forcing your way in
means using your capital to pay for someone else’s market.
Only trade opportunities you understand;
staying out is also a trade.
post-image
I came to the seaside to take in the beauty, yet my eyes remained fixed on the beautiful person I hold so dear! ❤️🌊
New streamer bts market
live-cover
LIVE1,529
🚀 Need powerful GPUs for AI projects?
RunPod offers on-demand GPU cloud computing for AI training, inference, and running LLMs.
⚡ Flexible GPU options
💰 Pay-as-you-go pricing
🔥 Fast deployment
Get started:
#RunPod #AI #GPU #CloudComputing
post-image
Are Bitcoin ETFs being shunned by institutions en masse? $870 million in outflows—is the bull market’s engine running out of fuel?

The Bitcoin market has recently staged a large-scale real-life version of Fast & Furious: prices haven’t fully recovered, but ETF funds have already started accelerating their exit.
U.S. spot BTC ETFs saw cumulative net outflows of nearly $870 million this week, and institutional funds have clearly become more cautious.
People used to think ETFs were a supercharger for Bitcoin, but now it seems even an engine can stall.
So, does this mean the bull market is over?
BTC-0.31%
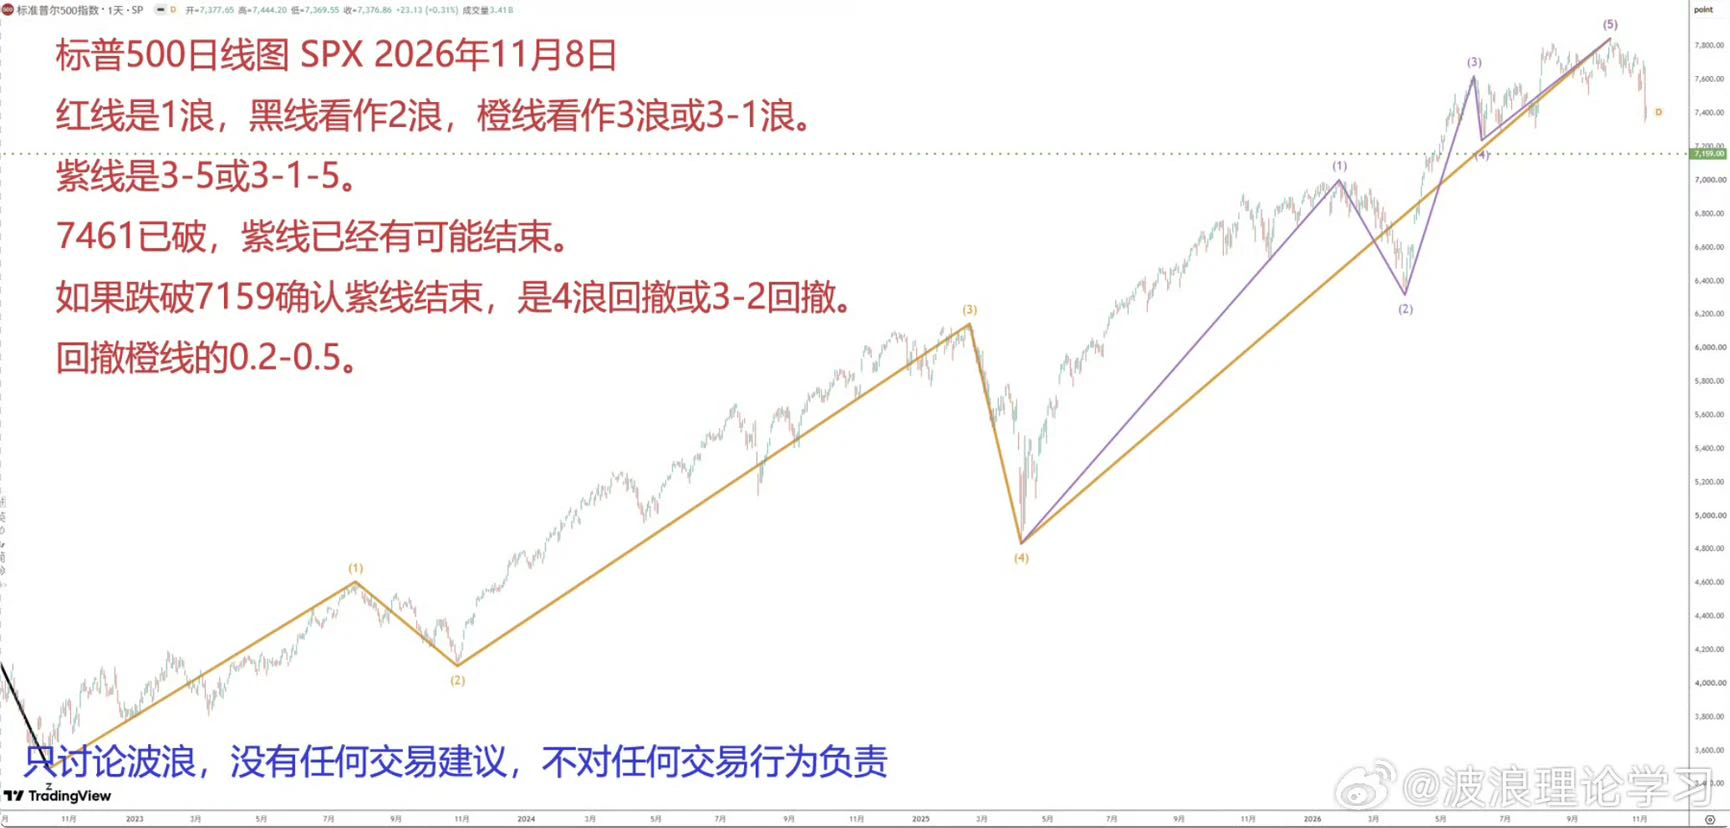
S&P 500: Warning began on September 15; on November 3, it “clearly formed a top at a minor degree.” Today, November 8, it broke below the monitoring point, expanding the top’s degree. ​​​$BTC ‌
post-image
BTC-0.65%
Is Goldman Sachs Not Afraid of an AI Selloff? $125 Billion Construction Plan Revealed—Is the AI Bull Market Not Over Yet?

As AI tech stocks plunge across the board, many investors have begun questioning everything, but Goldman Sachs is moving in the opposite direction, continuing to raise its forecast for U.S. data center construction spending and expecting it to reach $125 billion in 2028.
What does that mean? While the stock market is still debating whether AI is a bubble, the data center industry is already discussing where to build the next batch of facilities!
The main reason Goldman Sac
GS-0.30%
🐋 WHALE WATCH : A wallet received 3100 $ETH from Tornado Cash sold it for $6.92M USDC and moved the funds to Hyperliquid.
It then opened two 20x positions: long 169.47 $BTC $12.84M and short 5740 ETH $12.83M.
Someone with stolen funds is betting on BTC outperforming ETH. Watch both positions.
ETH-1.23%
BTC-0.65%
USDC+0.01%
HYPE+0.33%
Small amounts add up over time! Let them snowball
post-image
$ARB The chart keeps forming higher lows. Brothers, take the opportunity to earn a bowl of Vietnamese pho🤩Go long now🔥🔥Take-profit 1: 0.182 Take-profit 2: 0.2 Take-profit 3: 0.25 Stop-loss: 0.139$IDOL $AIN
post-image
ARB+1.17%
IDOL-6.71%
AIN+3.85%
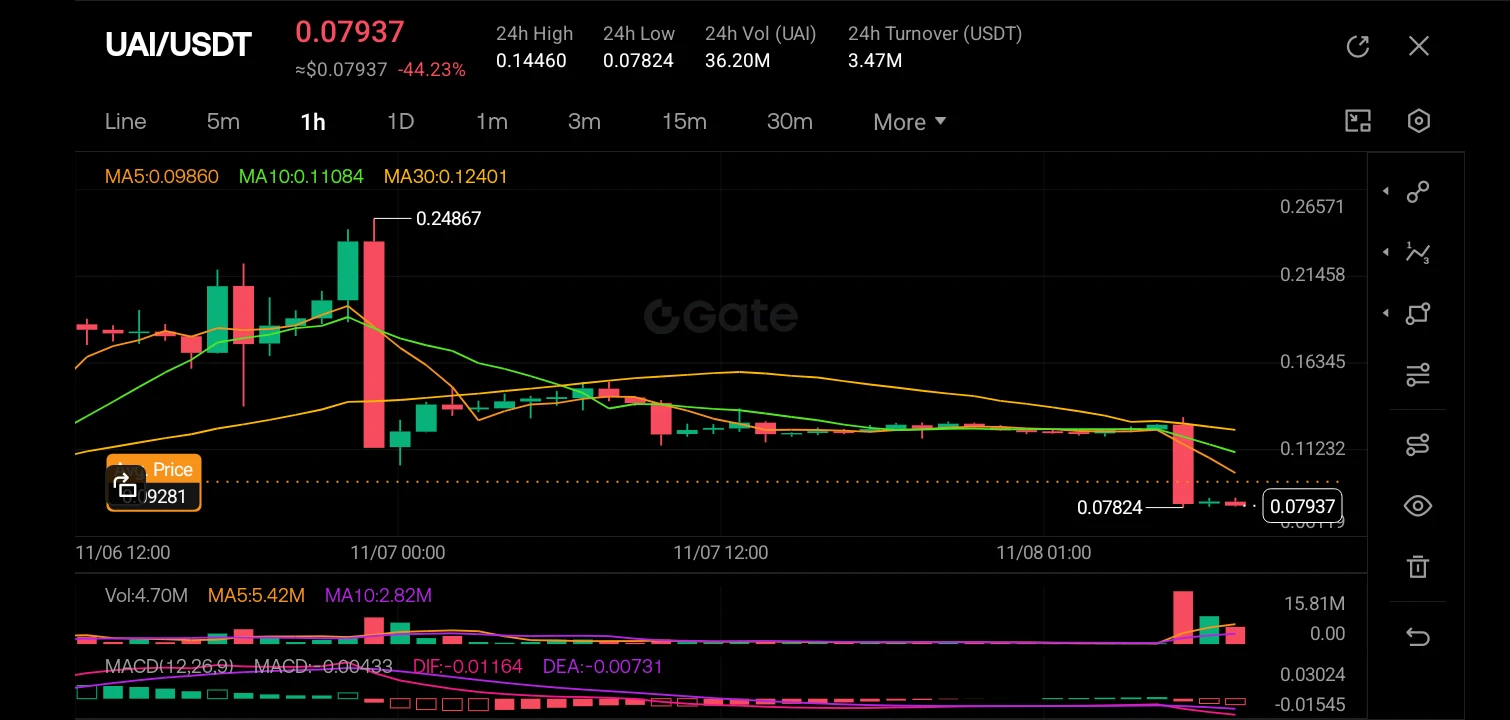
$UAI ‌
The 1-hour chart for UAI/USDT is showing a severe bearish breakdown, with the price currently sitting at 0.07937, representing a massive 44.23% drop over the 24-hour period. The chart clearly displays a steep waterfall decline from the recent high of 0.24867, completely obliterating the short and medium-term moving averages (MA5, MA10, MA30), which are now fanning out downwards in a classic bearish alignment. The most recent candle is a massive, long-bodied red marubozu that has crashed through any nearby support levels, accompanied by a significant volume spike (15.81M), indicating in
post-image
UAI-7.58%
  • 3
Buying the dip has already brought me to tears. Promise me, don’t cry so easily.
post-image
BTC, go long around the current price of 75,700, stop-loss at 74,800, target around 78,000. $BTC
post-image
BTC-0.67%
#ShareWeekly #Fed #WCTCS9

The Fed's December Decision Is Becoming More Complicated: Why Strong Employment Data Could Keep Interest Rates Higher for Longer

The latest U.S. non-farm payrolls data has introduced a significant shift in financial market expectations. Following the employment report, the probability of a Federal Reserve interest rate hike in December climbed to 77.7%, signaling that investors are increasingly concerned about the possibility of tighter monetary policy before the end of 2026.

This development is particularly important because the Federal Reserve is facing a delica
BTC-0.67%
  • 1
  • 2
$ENA is showing signs of selling pressure after a $10.27K long liquidation near $0.15359. This flush could create an opportunity for buyers if price stabilizes and reclaims short-term market structure. Watch for a bullish CHoCH, demand-zone reaction, and increasing buying volume before considering continuation.
Support: $0.1500 – $0.1470
Resistance: $0.1570 – $0.1620
Next Target: $0.1680
Confirmation: Reclaiming $0.1570 with strong volume could shift momentum toward higher liquidity. Failure to hold support may extend the downside.
Let's go $ENA 🚀
post-image
ENA+8.04%
𝗘𝗧𝗛𝗘𝗥𝗘𝗨𝗠 ⚡ | 𝗣𝗥𝗜𝗖𝗘 𝗦𝗧𝗔𝗕𝗜𝗟𝗜𝗭𝗘𝗦 𝗡𝗘𝗔𝗥 $𝟮,𝟮𝟯𝟳

💰 Price: $2,236.92
₿ BTC Value: 0.02953 BTC

📊 Market Performance

- 1H Change: +0.24%
- 24H Change: +0.07%
- 7D Change: -0.70%

🏦 Market Cap: $273.34B
📈 24H Volume: $3.89B

Supply Details

- Circulating Supply: 122.19M ETH
- Total Supply: 122.19M ETH

Ethereum is showing slight positive movement over the past 24 hours, but its weekly performance remains marginally negative.

Trading activity remains important to watch. $ETH needs stronger buying momentum to establish a clearer recovery trend.

For now, the market i
post-image
ETH-0.91%
Load More

Join 40 M users in our growing community

⚡️ Join 40 M users in the crypto craze discussion

💬 Engage with your favorite top creators

👍 See what interests you

Trending Topics

USCPIDataIncoming

1.88k Views1.49k Discussing

The U.S. October CPI report will be released on November 10 at 8:30 a.m. ET. September CPI came in at 3.7% year over year, and markets will be watching closely for signs that inflation is cooling, especially in core CPI. A softer-than-expected reading could strengthen rate-cut expectations, while hotter inflation may pressure risk assets through higher Treasury yields and a stronger dollar. How do you think this CPI print will move $BTC, U.S. stocks and gold?

USAIStocksHitHard

24.01k Views3.69k Discussing

USNonfarmPayrolls

41.49k Views4.38k Discussing

View More