Share your thoughts
placeholder
Article
A few days ago, I was still calculating whether I had enough money for instant noodles this month; this morning, I was already wondering whether to add sausage. 😂 When I opened the charts this morning, my eyes lit up immediately.

The logic behind this trade was not complicated: the pullback held, buying pressure clearly strengthened, and aggressive buy orders kept coming in. The order book gave me just two words—good to go. So I placed an order and entered around 92.57, before many people had even realized what was happening. The current price is now 95.77, +320.56%, so the brothers on boar
post-image
ETH+0.28%
BTC+0.39%
I originally wanted to cut my losses to appease the heavens, but the ritual failed and the meat roasted itself. Crude as it sounds, this $SOL trade is genuinely satisfying.

While SOL was bottoming out intraday, it kept bouncing around 84.84 without breaking the key level. I judged this to be a shakeout, not a real collapse. The funds hadn't fled and the volume was still there, so holding was all that was needed—just wait for it to put on its own show.

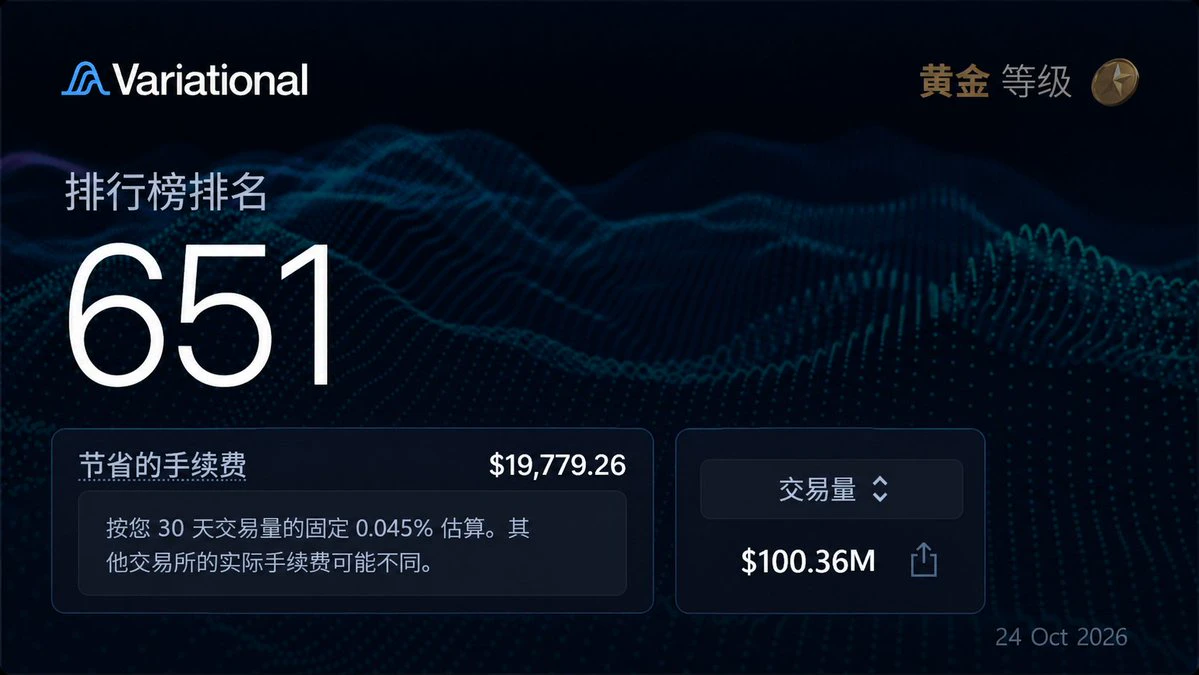
Sure enough, it pushed up from 84.84 all the way to where it's now at 102.35. The +1920.98% gain in my account is already enough to pay for
post-image
SOL+1.69%
ADA+0.98%
SNDK+11.60%
Pythagorean theorem
Everyone knows it, right?
Everyone has to learn it in China’s nine-year education
Top-tier angle
Launch Google’s pot
post-image
I came across a pretty wild setup: if you want to buy a dog coin called Artificial Inu, you first have to buy tokenized Nvidia stock, because NVDA is on the other side of the liquidity pool.
This memecoin had a market cap of $1.5 million on August 1, hit $135 million on August 30, and briefly topped $320 million in early September. It nearly went up 90x in less than a month.
After digging into it, I found that this wasn’t an isolated case. It’s part of the hottest playbook on Robinhood’s blockchain right now.
The chain only launched its mainnet on July 1. The official vision was fairly straigh
post-image
AINVDA-6.68%
NVDA+0.66%
HOOD-2.12%
CASHCAT-3.22%
MEME+6.49%
Happy Saturday legends
Don’t forget to make time for yourself today 💙
post-image
NVDA market predictions
live-cover
LIVE1,497
$POL Signal】Long bias + 1H Bollinger compression awaiting a breakout
$POL The 1H Bollinger upper and lower bands have compressed to 0.0918-0.0954, with the price tracking EMA20. The 4H EMA20/EMA50 form a 0.0939-0.0961 range, and the current price is right in the middle. MACD histograms on both timeframes are shortening in sync, indicating weakening downside momentum, but volume has not shown any follow-through. The order book bid-ask depth ratio is 1.03, with buying and selling basically balanced and lacking an incremental force to break the deadlock.
🎯Direction: Long
⚡Trigger condition: If
post-image
POL+2.58%
BTC+0.46%
ETH+0.34%
SOL+1.73%
evening update
live-cover
LIVE1,768
🚨 aster-2:native BREAKING OUT 🚨
Target: $1+.
Volume surging. Momentum building.
Don't sleep. #AsterDex #Aster
post-image
ASTER+15.27%
#GateEventContractTradeSharingChallenge
$AAPL ‌AAPLX/USDT: Bearish Pressure Remains — Can Buyers Defend $319?
My K-Line Analysis & Trade Plan
AAPLX/USDT is trading around $321.97, down approximately 2.04%, after a sharp rejection from the $331.93 area. The 4H chart shows that sellers have taken control of short-term momentum, while buyers are attempting to build a base above the recent low at $319.05.
AAPLX is a tokenized representation of Apple stock; its xStocks as being backed 1:1 by the corresponding underlying equities.
1. 4H K-Line Structure
The most important development is the larg
post-image
AAPL-2.51%
There is significant liquidity sitting between $60K and $50k in BTC.
It will be interesting to see what kind of news or catalyst awaits us ahead. 👀
post-image
BTC+0.46%
$UNI Signal】Long | 1H fund inflow recovery + hugging EMA20
$UNI The latest 1H candlestick has a buy ratio of 0.57, with aggressive buying prevailing; the current price of 6.249 is hugging EMA20 at 6.2415. Order book depth imbalance is -2.18%, with sell orders slightly outweighing buy orders. The 1H MACD histogram is converging, while the 4H MACD histogram continues to expand downward. The funding rate is 0.0088%, OI is stable, and there are no anomalies at the futures level. RSI is 51 on 1H and 61 on 4H, neither in an extreme zone.
🎯 Direction: Long
⚡ Entry/limit order: 6.23025 - 6.24900
post-image
UNI+0.08%
BTC+0.46%
ETH+0.34%
SOL+1.73%
$ETH [2W] has printed a higher high on the lower timeframe, breaking the 1-year downtrend. Holidays are over, waiting for ignition and full send.
ETH+0.34%
$SOL SOL/USDT — Professional Technical Analysis
SOL/USDT — Professional Technical Analysis
Timeframe: 2H
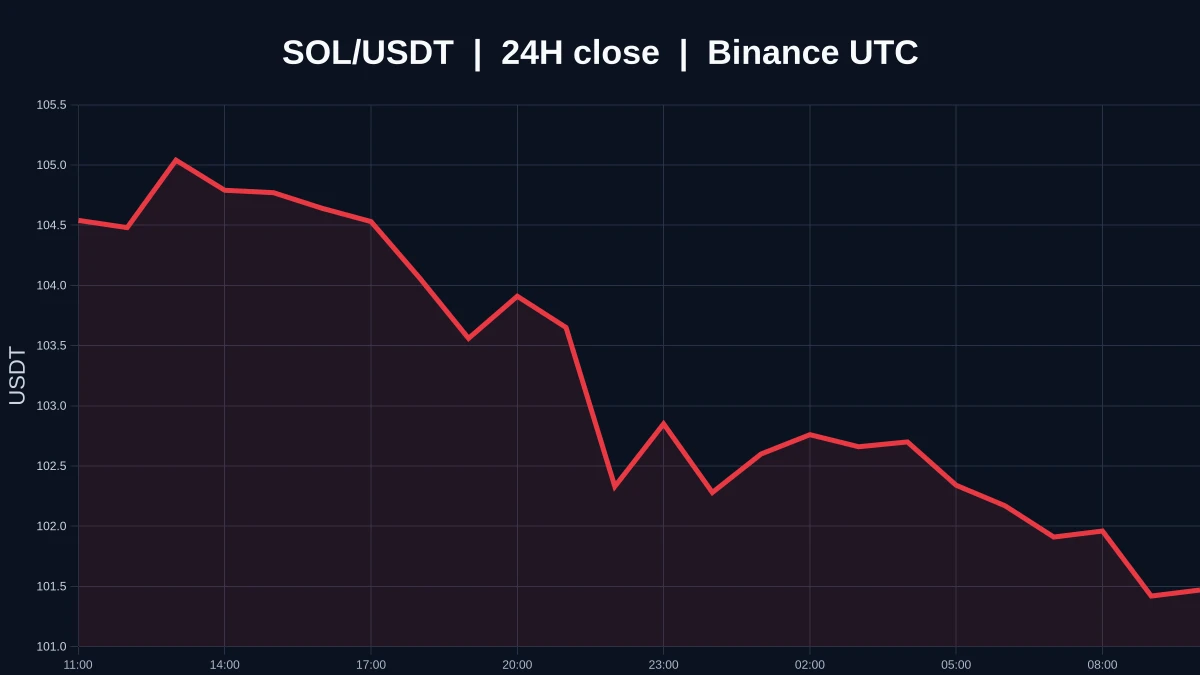
Current Price: ~102.36
Market Structure
SOL is currently trading inside a bearish descending channel, with price consolidating around the 102–104 area. The broader structure remains cautious until the channel resistance is broken.
Key Support Zones
100.00–98.20 → Important demand/support zone
96.20–97.20 → Strong Order Block
91.65 → Major structural support
Key Resistance
104–106 → Channel resistance / selling area
110.53 → Major resistance
Bullish Scenario
If SOL breaks and closes a
post-image
SOL+1.69%
#晒出我的持仓收益 Fucking hell, it's stuck sideways!!! The market's not cooperating.
post-image
Everyone’s glued to $BTC /USDT’s 79.6K—but the 4H chart is quietly screaming a trap. Are you on the wrong side?

$BTC /USDT - SHORT

Trade Plan:
Entry: 79567 – 79697
SL: 80253
TP1: 79166
TP2: 78855
TP3: 78389

Why this setup?
- 1D stays **range**, so the 79,632 reference isn’t a breakout—it’s a pivot.
- RSI (15m) at 58.03 shows weak upside fuel, while ATR (1h) of ~259 means moves are tight but decisive.
- Short bias at 55% confidence: entry 79,632, first target 79,166 (-0.6%), but TP3 at 78,389 is a real magnet if 4H momentum flips.
- **Why now?** Price is “Waiting” at the exact midpo
BTC+0.39%
#Gate60MillionUsers
I joined Gate in 2022, and honestly, I had no idea how much that first trade would become a part of my crypto journey.
My first trade was on DOGE. 🐕 At the time, I was still trying to understand how everything worked. Charts looked complicated, candles seemed to move for no reason, and I was constantly asking myself whether I was making the right decision.
I remember opening the chart again and again after entering the trade. 😂 A small price movement felt like a major event. If DOGE went up, I felt like I had made the perfect decision. If it went down, suddenly I became
post-image
DOGE+2.89%
Everyone’s staring at $SOL /USDT’s range—but the 4h tape is quietly screaming lower.

$SOL /USDT - SHORT

Trade Plan:
Entry: 102.38 – 102.66
SL: 103.86
TP1: 101.52
TP2: 100.85
TP3: 99.84

Why this setup?
Why now?
- RSI 15m at 51.94 = zero momentum to push upside.
- ATR 1h 0.5573 → low volatility, but entry sits at 102.52 with SL 103.86 (tight 1.3% risk).
- 1D trend is *range*—so we fade the top, not chase.
- TP1 101.52 (-1%), TP2 100.85 (-1.6%)—these are realistic within 2–3 candles if 102.30 breaks.
- Confidence 55 isn’t a slam dunk, but the invalidation at 102.30 makes this a cl
SOL+1.69%
$LIT 470% done… but is LIT just getting started?
LIT has quietly gained 470% over the past three months, and honestly, this is one of the cleanest and most technically sound trend reversals I’ve seen. Everything is lining up perfectly, and I’m expecting at least another 20% upside, with a target of $5.50.
post-image
LIT+0.87%
$WLD — has no one said anything?
post-image
WLD+6.04%
Load More

Join 40 M users in our growing community

⚡️ Join 40 M users in the crypto craze discussion

💬 Engage with your favorite top creators

👍 See what interests you

View More