Square
Following
Hot
News
Profile
Share your thoughts
placeholder
Article
#Gate广场万圣节
BTC Technical Outlook Heading into Halloween
As the calendar approaches Halloween, the BTC/USDT market is presenting a specific technical structure characterized by consolidation and downward pressure across multiple timeframes.
Macroeconomic Context
Current market sentiment is being influenced by broader economic indicators. Notably, elevated oil prices continue to drive inflation concerns. Persistent inflation typically leads to expectations of sustained higher interest rates, which generally exerts downward pressure on risk assets, including Bitcoin. This macroeconomic backdrop
BTC-1.05%
  • 2
  • 1
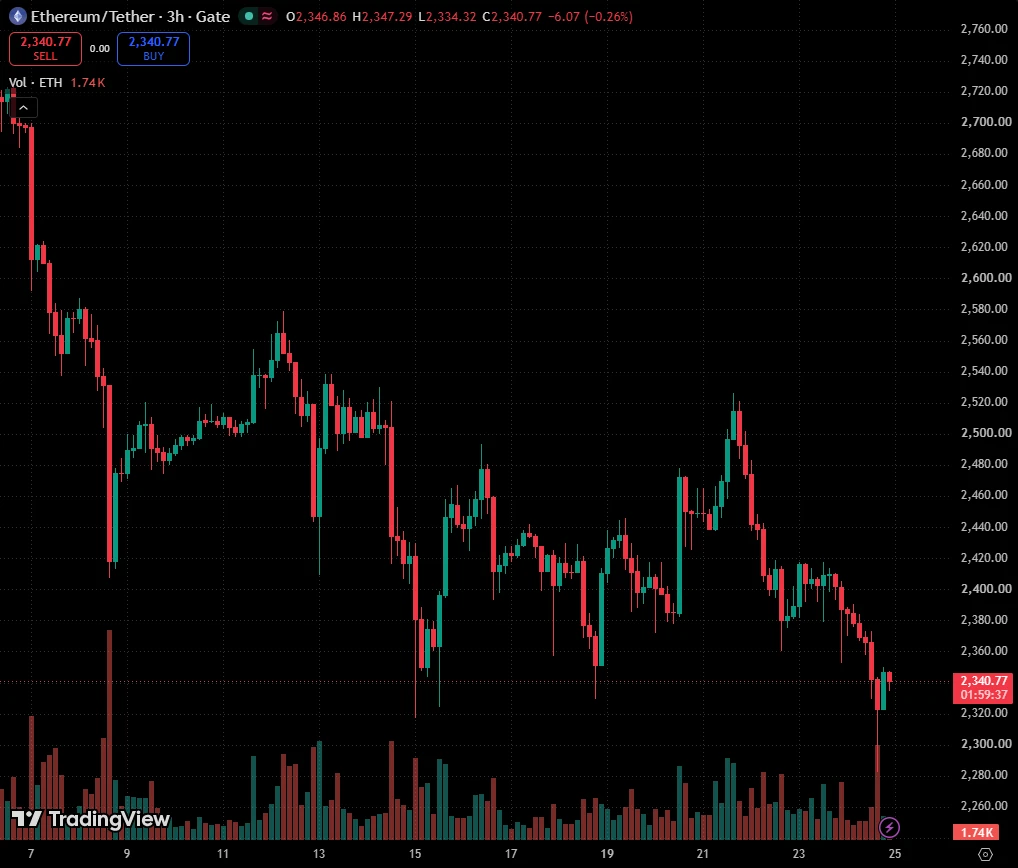
$ETH ETHUSDT 3H: sweep of the 4th wave lows, watching for a reclaim
ETH has swept the 4th wave lows on a spike in volume. I'm watching the 3H closes to see whether price can reclaim them.
The bigger picture
My read: ETH is in wave 4 of wave 1 up from the lows. Wave 5 comes next. This count is wrong if wave 4 trades back into the price range of wave 1.
What just happened
Price fell through the 4th wave lows at 2,356.41 and through the 2,318.00 line, which I drew from the 15 Oct lows. Volume spiked well above its average line on the way down. Price then moved back above 2,318.00. That is a sweep
post-image
ETH-2.32%
Trenches
ZIG
Z
bade
b
ZIG
0x8c...1145
Market Cap
$.
Change
.
24h Vol
$.
Holders
.
AGT
A
bade
b
AGT
0x5d...e274
Market Cap
$.
Change
.
24h Vol
$.
Holders
.
BIRB
B
bade
b
BIRB
G7vQ...KNwG
Market Cap
$.
Change
.
24h Vol
$.
Holders
.
CNPY
C
bade
b
CNPY
0xc6...ddd2
Market Cap
$.
Change
.
24h Vol
$.
Holders
.
AI
A
bade
b
AI
0x2e...1e18
Market Cap
$.
Change
.
24h Vol
$.
Holders
.
Stockmon Is Approaching $100k Hunt Volume Even Though Breeding Wont Be Back until 4 Days From Now (Unless Presale Ends Faster).
Around 20-30 Aetheryn Are Ready To Breed On Opening Day.
I Still Don't Have A FIG Or RBLX Dominant Btw 😅
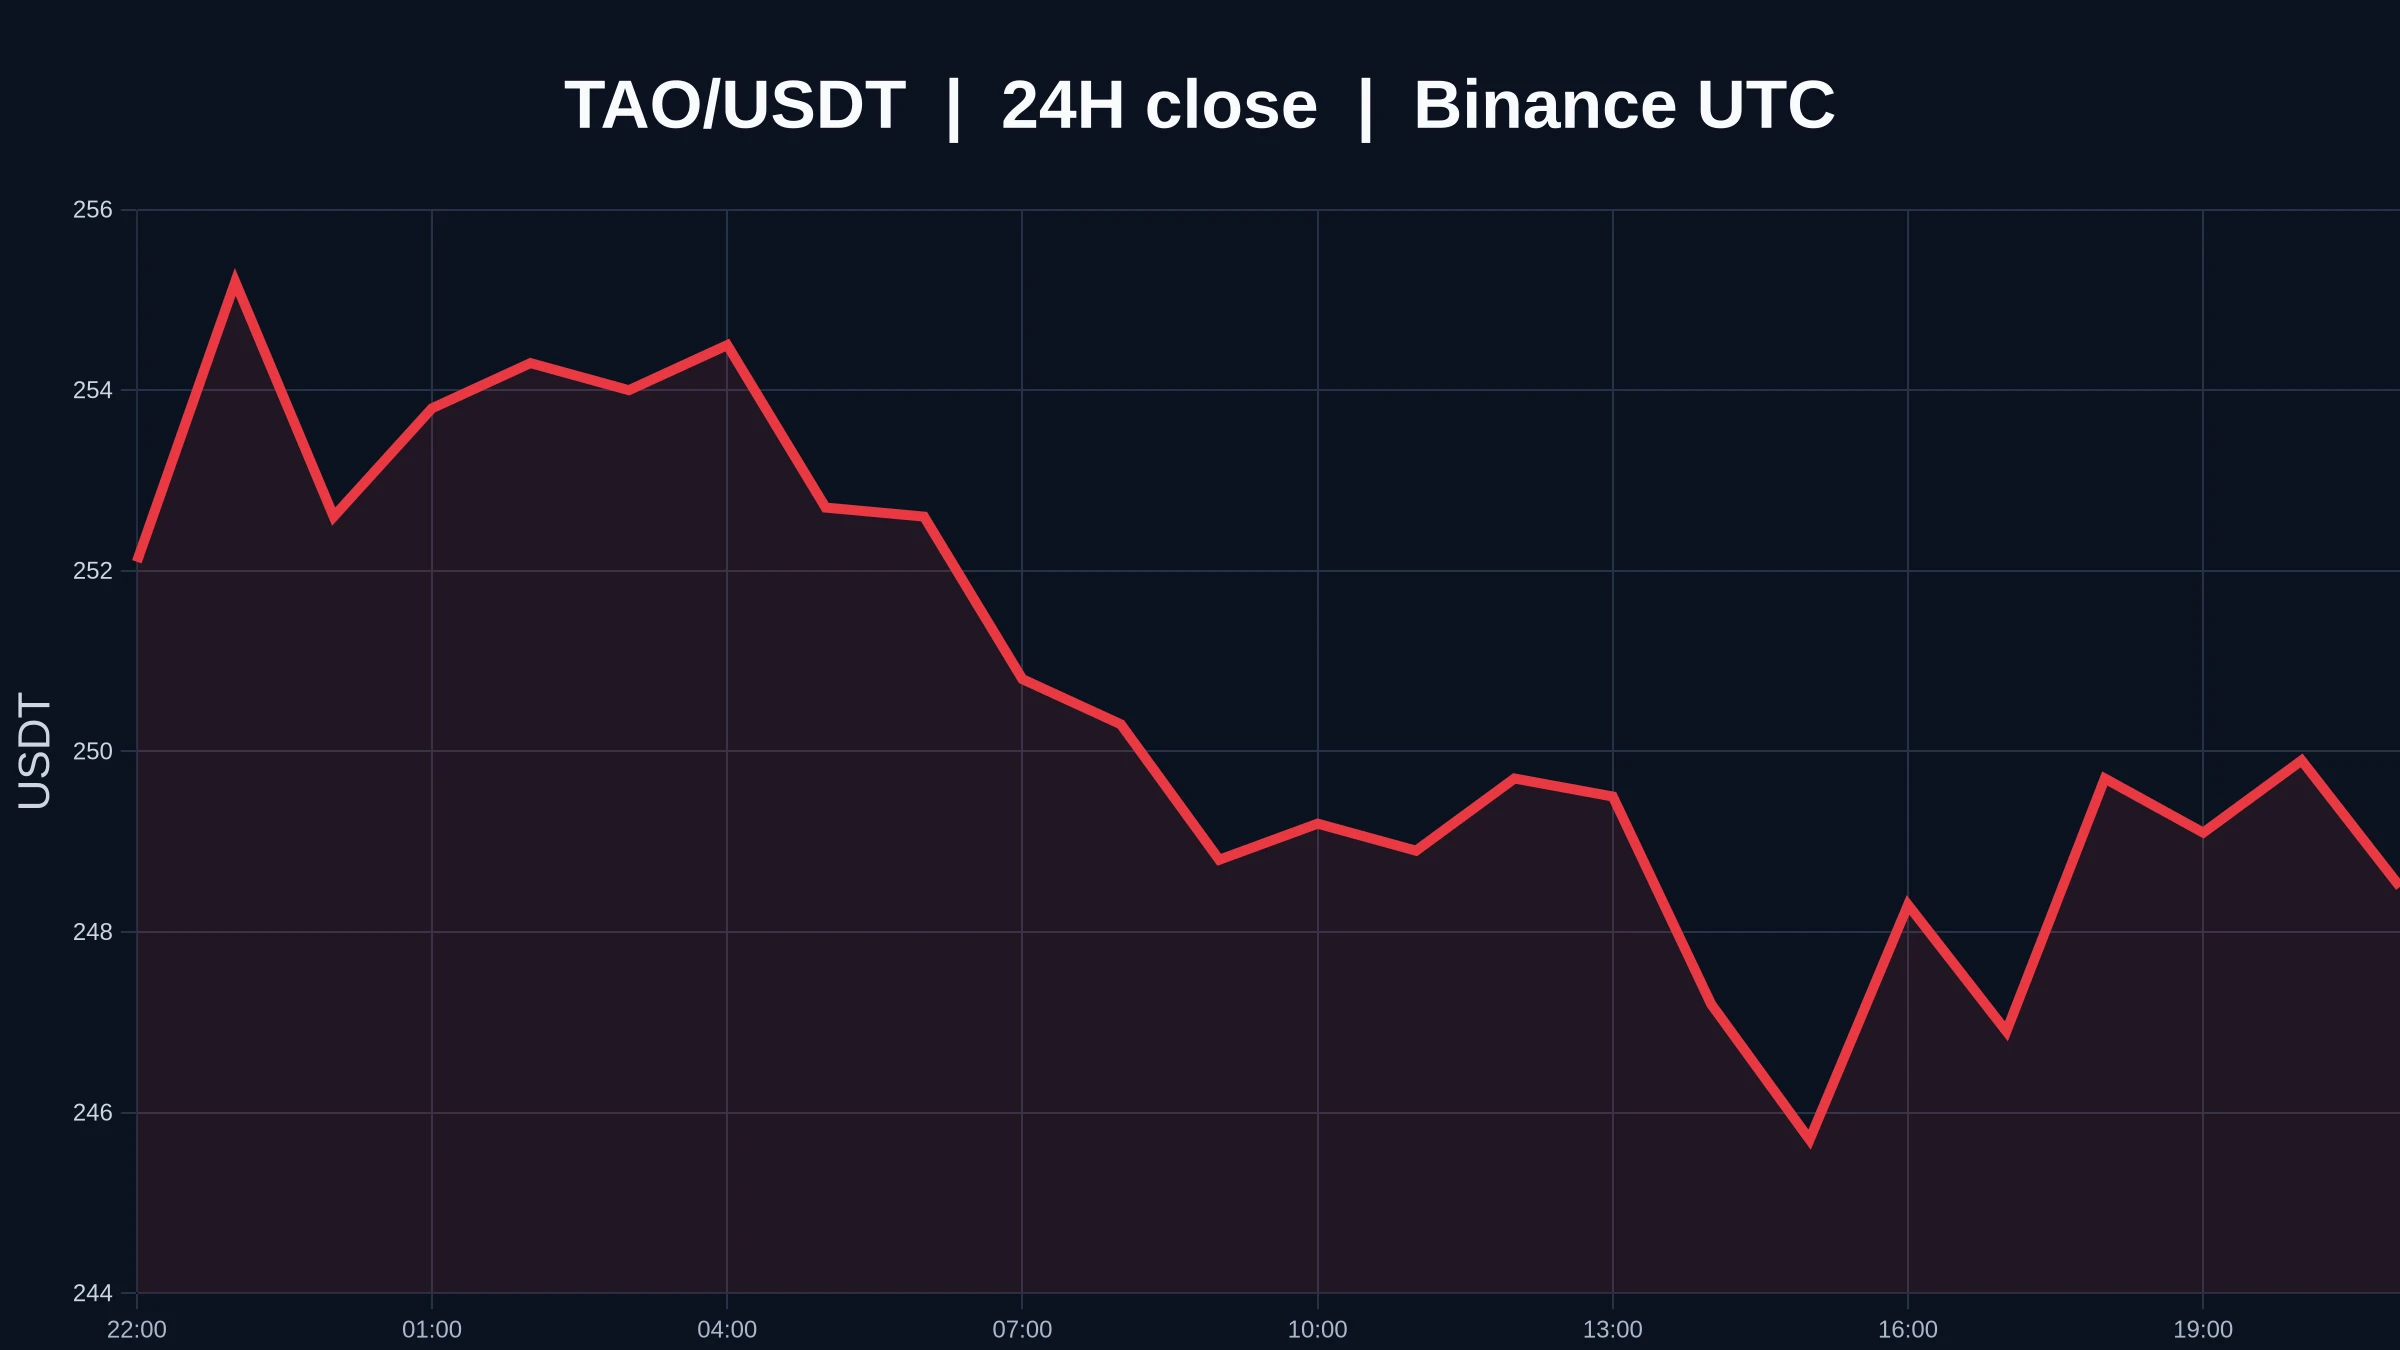
$TAO price-volume divergence: How long can the move around 248.6 last?
$TAO Now quoted at 248.6 USDT, down 4.01% over 24 hours, trading between 242.6 and 259.6. The 1-hour support is at 242.6 and resistance at 259.1. Both the 1-hour and 4-hour directions lean weak, while trading participation is only 0.18x. Price has moved, but volume has not followed.
The 24-hour high of 259.6 and low of 242.6 define the current trading range, with the current price of 248.6 closer to the lower end. The 24-hour decline of 4.01% is not enough on its own to determine the trend; price has been moving back and fo
post-image
TAO-3.83%
Togg introduced the Amber Series of the dual-motor, all-wheel-drive T10F 4More.
The new series has begun appearing at Togg Experience Centers.
post-image
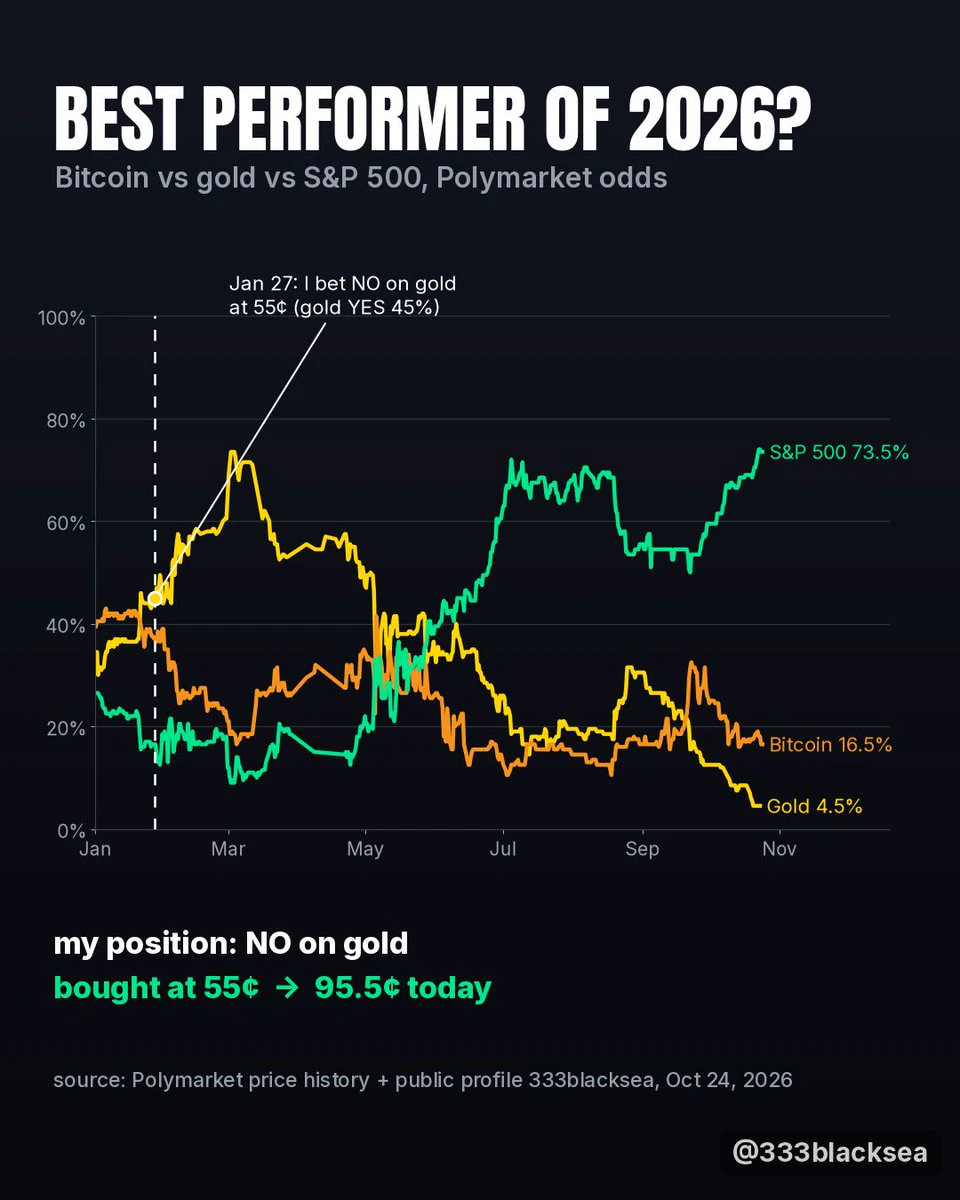
January 27, gold was over $5,000.
Polymarket had it as the favorite to beat Bitcoin and the S&P 500 in 2026.
I bet No at 55¢.
That No is 95.5¢ today.
S&P 500 73.5%
Bitcoin 16.5%
Gold 4.5%
Who are you taking with 10 weeks left?
post-image
XAU-0.22%
BTC-1.05%
SPX500-0.10%
“Ethereum has dropped below 2,300 USDT and is now trading at 2,291.090088 USDT, with a narrowed 4.50% decrease in 24 hours.” means that, as of October 24, 2026 at 15:17 UTC, the market price of one ETH had fallen under the 2,300 USDT level and was quoted at about 2,291.09 USDT market data.
 
The “4.50% decrease in 24 hours” indicates ETH was worth 4.50% less than it was 24 hours earlier. “Narrowed” suggests the decline had become smaller than it was earlier in that 24-hour period—potentially indicating that selling pressure had eased somewhat—but it does not by itself confirm a price recovery
post-image
ETH-2.32%
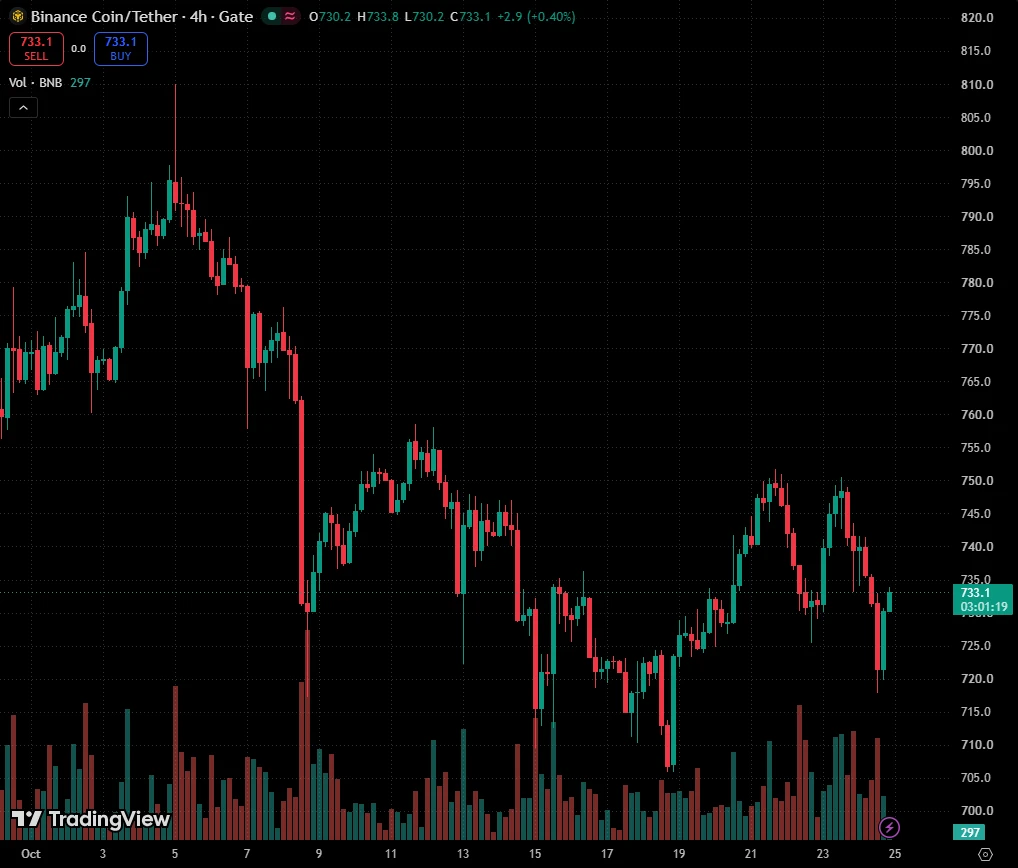
$BNB BNB Swept the Range Floor and Bounced. Top Next?
BNB just gave a textbook lesson in what a neutral range looks like on a weekly grid.
This week's grid comes from last week's high, low and close. The pivot sits at 729.08. The bottom of the neutral range is the S 0.184 zone, roughly 716.77 to 721.47, and the top is the R 0.184 zone, roughly 736.70 to 741.40.
On Wednesday, Oct 21, BNB pushed up to 751.86, above R 0.382 at 749.01. It couldn't hold. Price came all the way back down, and this afternoon a 4H candle dipped to 718, right into the S 0.184 zone. But that candle closed at 721.63, bac
post-image
BNB-0.99%
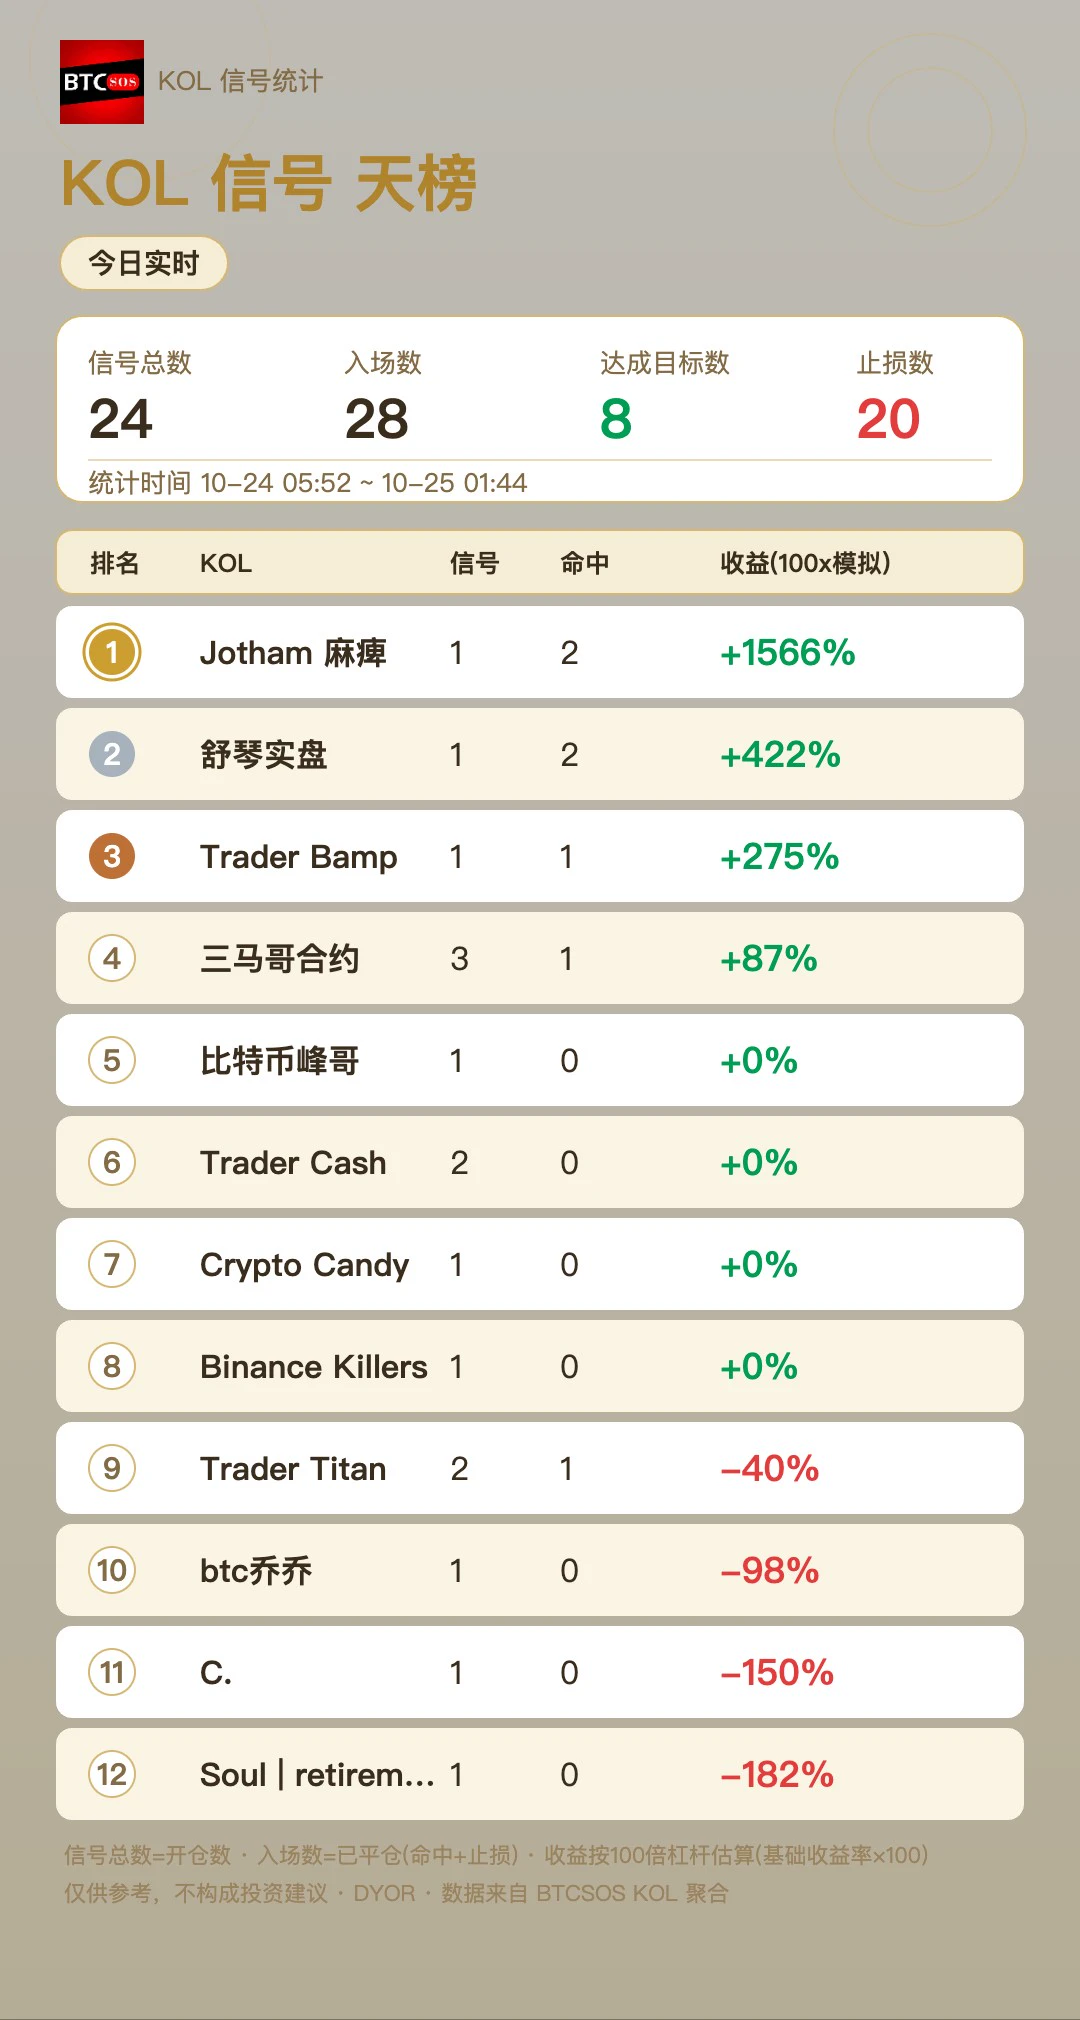
[Today's KOL Performance Leaderboard] The btcsos signal feed had 24 signals, with 28 trades settled (8 hits / 20 stop-losses). Topping the leaderboard was Jotham Numb: 2 trades settled, 2 hits, simulated return of +1566%. See the image for the full leaderboard; data is updated in real time from the KOL signal feed. By the way, Jotham Numb also topped the previous leaderboard (10-25) at +1566%, making it two wins in a row 👀#Robinhood交易业务增长能否延续? HOOD -0.22% xHOOD -0.21%
post-image
HOOD-1.64%
MARKET UPDATE
live-cover
LIVE1,900
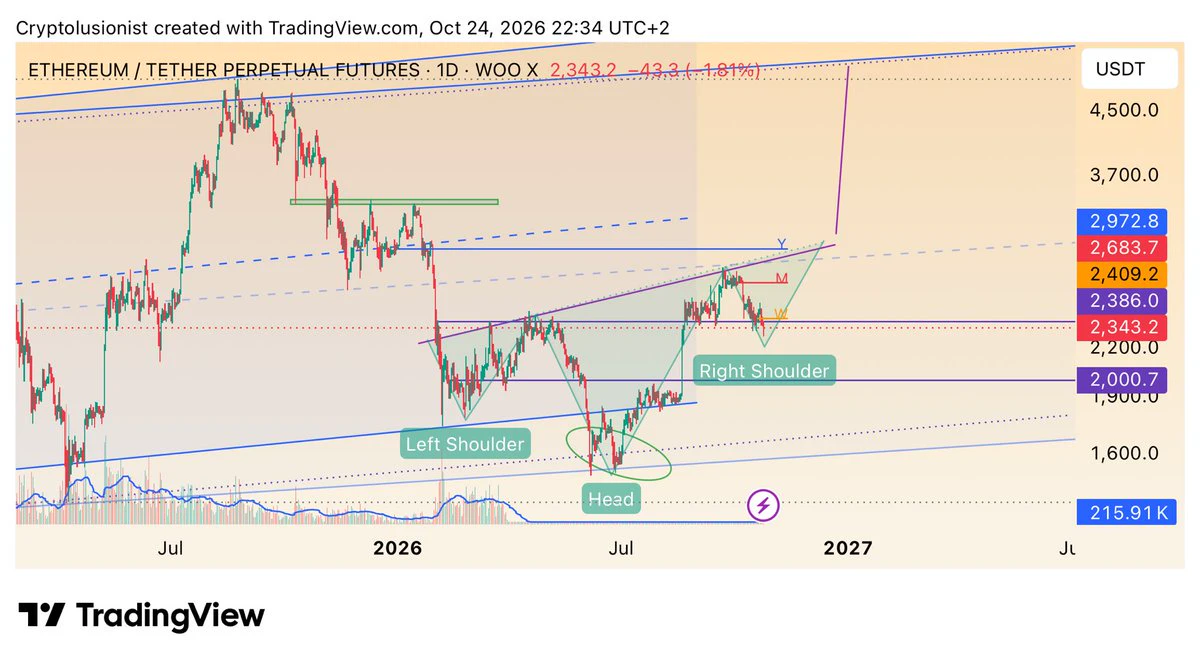
Here’s some $ETH hopium to counter all the bearish doomsday posters 🐂
Ethereum could potentially form an inverse head and shoulders pattern here with a breakout target making it reach the top of the multi-year channel 🤷🏽
post-image
ETH-2.32%
BTC MARKET TRENDS
live-cover
LIVE1,407
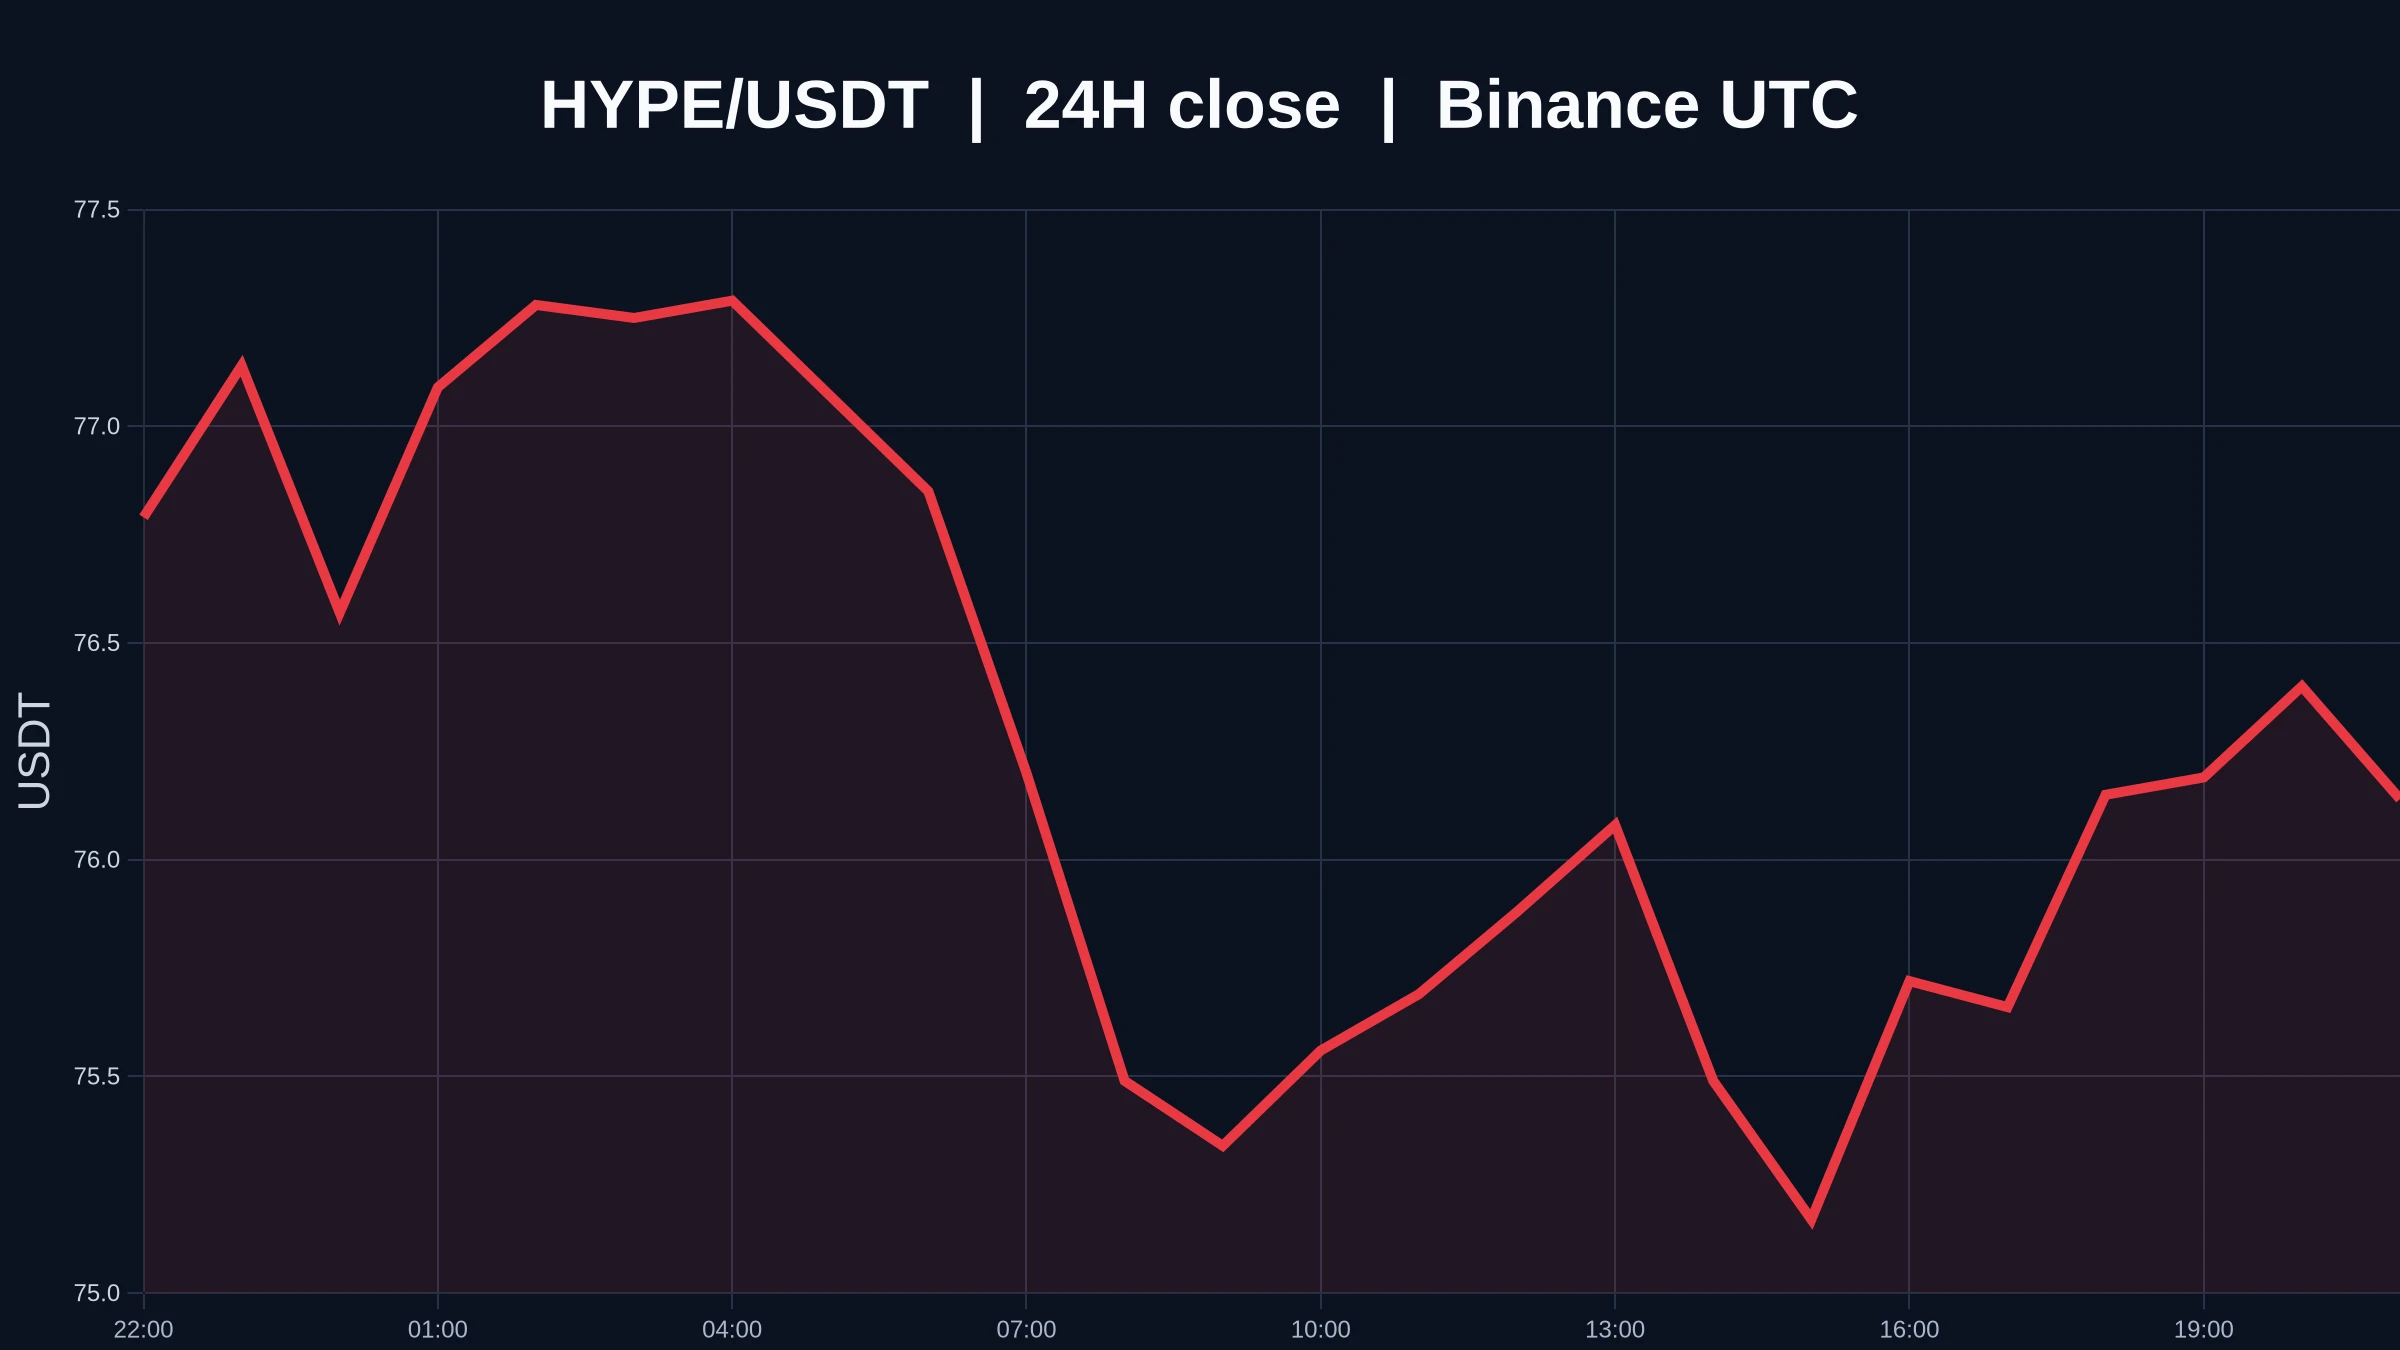
What’s worth watching with $HYPE this time isn’t whether it’s “going up” or “going down,” but which of the two nearby boundaries is actually tested first after the price reaches 76.07. Rather than choosing a side, first check whether price and volume are aligned. Price shows direction; trading volume shows participation. When price has moved but volume is significantly below average, the follow-through of either a breakout or a decline should be viewed with caution.
The price is currently looking for answers between 74.45 and 78.05. Only once it truly leaves this range will 74.45 or 82.54 beco
post-image
HYPE-2.40%
$CAP Now opening a large long position with 10x leverage. Take-profit 1: 0.0900 Take-profit 2: 0.0950 Final take-profit: 0.100 Stop-loss: 0.07400
post-image
CAP+14.14%
$Q Down 31% in a day, plunging from 0.1142 straight to 0.0683—this isn’t a shakeout; it’s a cascade of leveraged liquidations. The synchronization rate between on-chain liquidations and U.S. equity risk assets surged above 0.8 this week. When the Nasdaq drops 1%, it drops 5%. The night the Fed minutes struck a hawkish tone, funding rates turned negative—altcoins are now basically a 3x short on U.S. stocks. Don’t rush to buy the dip; wait for three signals: BTC holds firm without breaking its previous low, Q’s trading volume falls below 50M, and funding rates turn positive. Don’t chase at the c
NAS100+0.30%
BTC-1.05%
Earnings Season’s Nastiest Trap: If Results Are Great, Why Does Wall Street Still Sell Off?
Retail investors read earnings reports and see profits growing: Buy, buy, buy! Wall Street asks: How much did profits grow? How much can they grow next year? If growth slows, what justifies such a high valuation?
The same report, two different interpretations—and one investor may end up buying at the top while another is left holding the bag.
What really moves stock prices during earnings season is the gap between actual results and market expectations. If the market was expecting profit growth of 30%,
TSLA-0.62%
  • 13
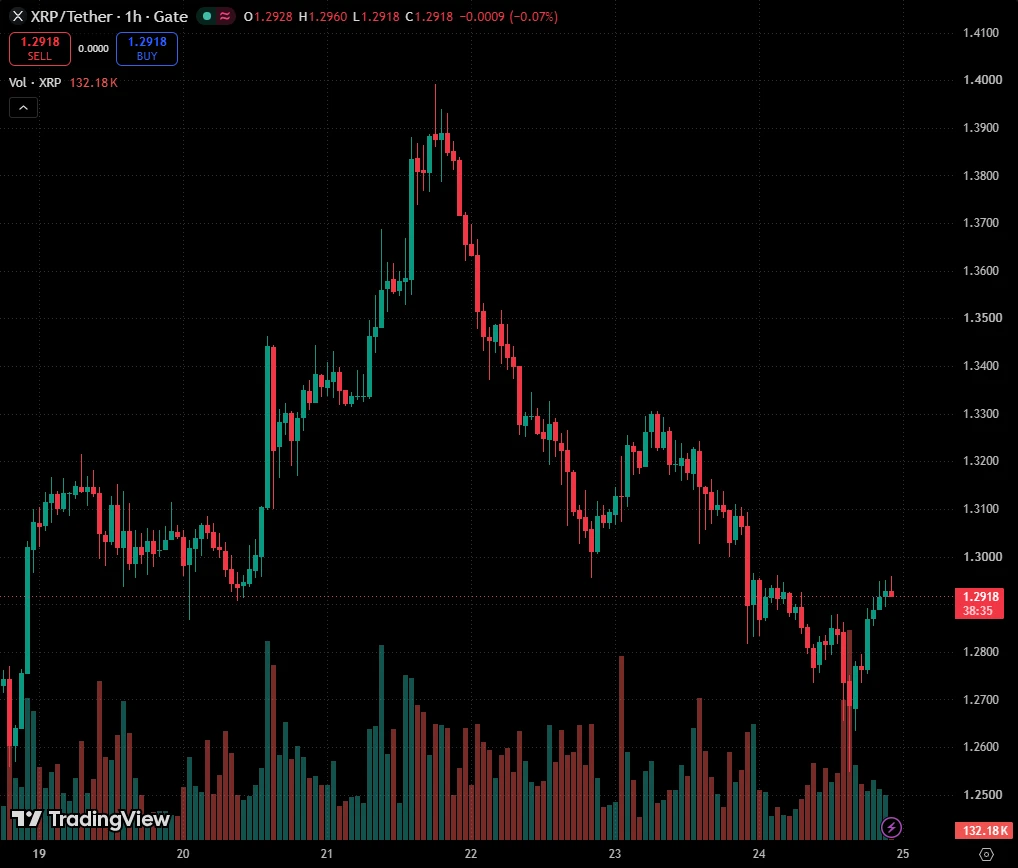
$XRP XRP LONG above 1.284: last week's low swept, 1.322 next
Bias: LONG XRP above 1.284. Expected: 1.304 (this week's POC), then 1.322 (this week's VWAP). Invalidation: a 1h close below 1.274.
3-month profile from 1h candles. Levels plotted with VWAP & Volume Profile Order Flow Map [AK FlowBook].
Why long:
1) A clean sweep of last week's low.
Last week (Oct 12-18) bottomed at 1.2562. Saturday flushed to 1.2546 at 15:30 UTC during the day's heaviest selling: delta about -833K XRP in the 13:00 hour, -730K at 14:00 and -1.33M at 15:00. Not one 1-minute candle closed below 1.2562. The stops under
post-image
XRP-1.06%
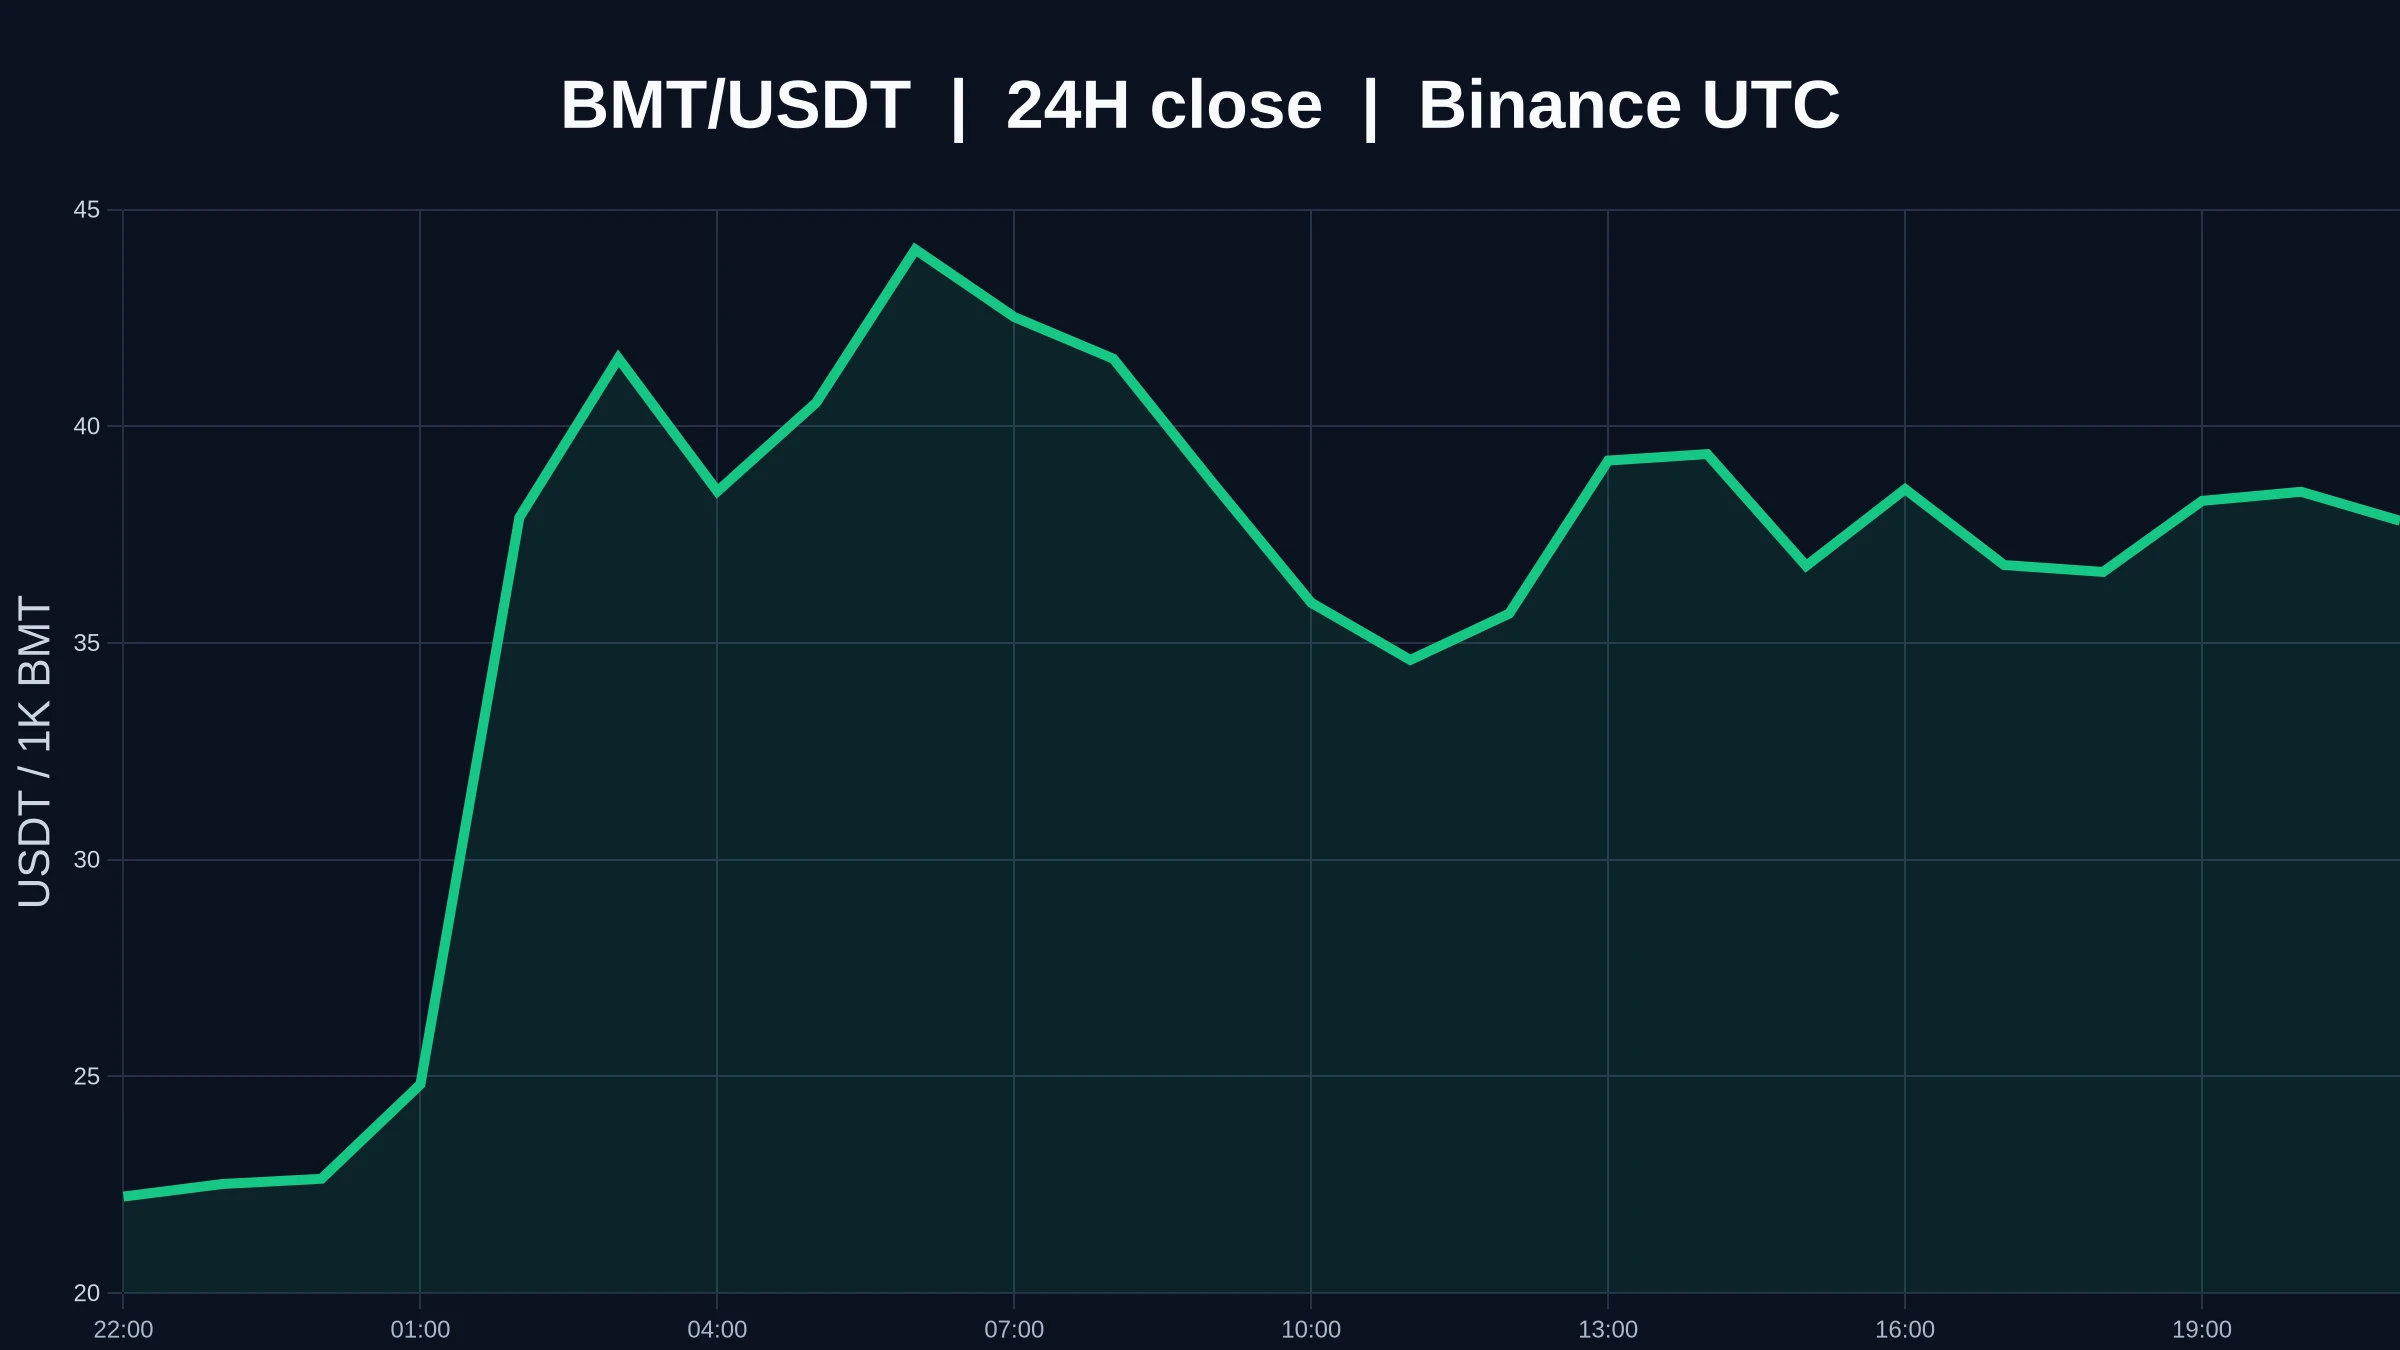
There’s no need to explain $BMT emotionally today. The current price is 0.03796, up 71.30% over 24 hours, with volume at 0.03x—three facts that can all be checked.
I’ll first separate “what has happened” from “what will continue.” I won’t extrapolate the large move that has already happened into the next leg; I’ll first see whether the price can hold in the new range. Extrapolating the past 24 hours’ direction directly into the next leg is the most common source of chasing and panic selling after a big move. The reference points for this round are 0.02196 below and 0.05144 above. If the move c
post-image
BMT+70.35%
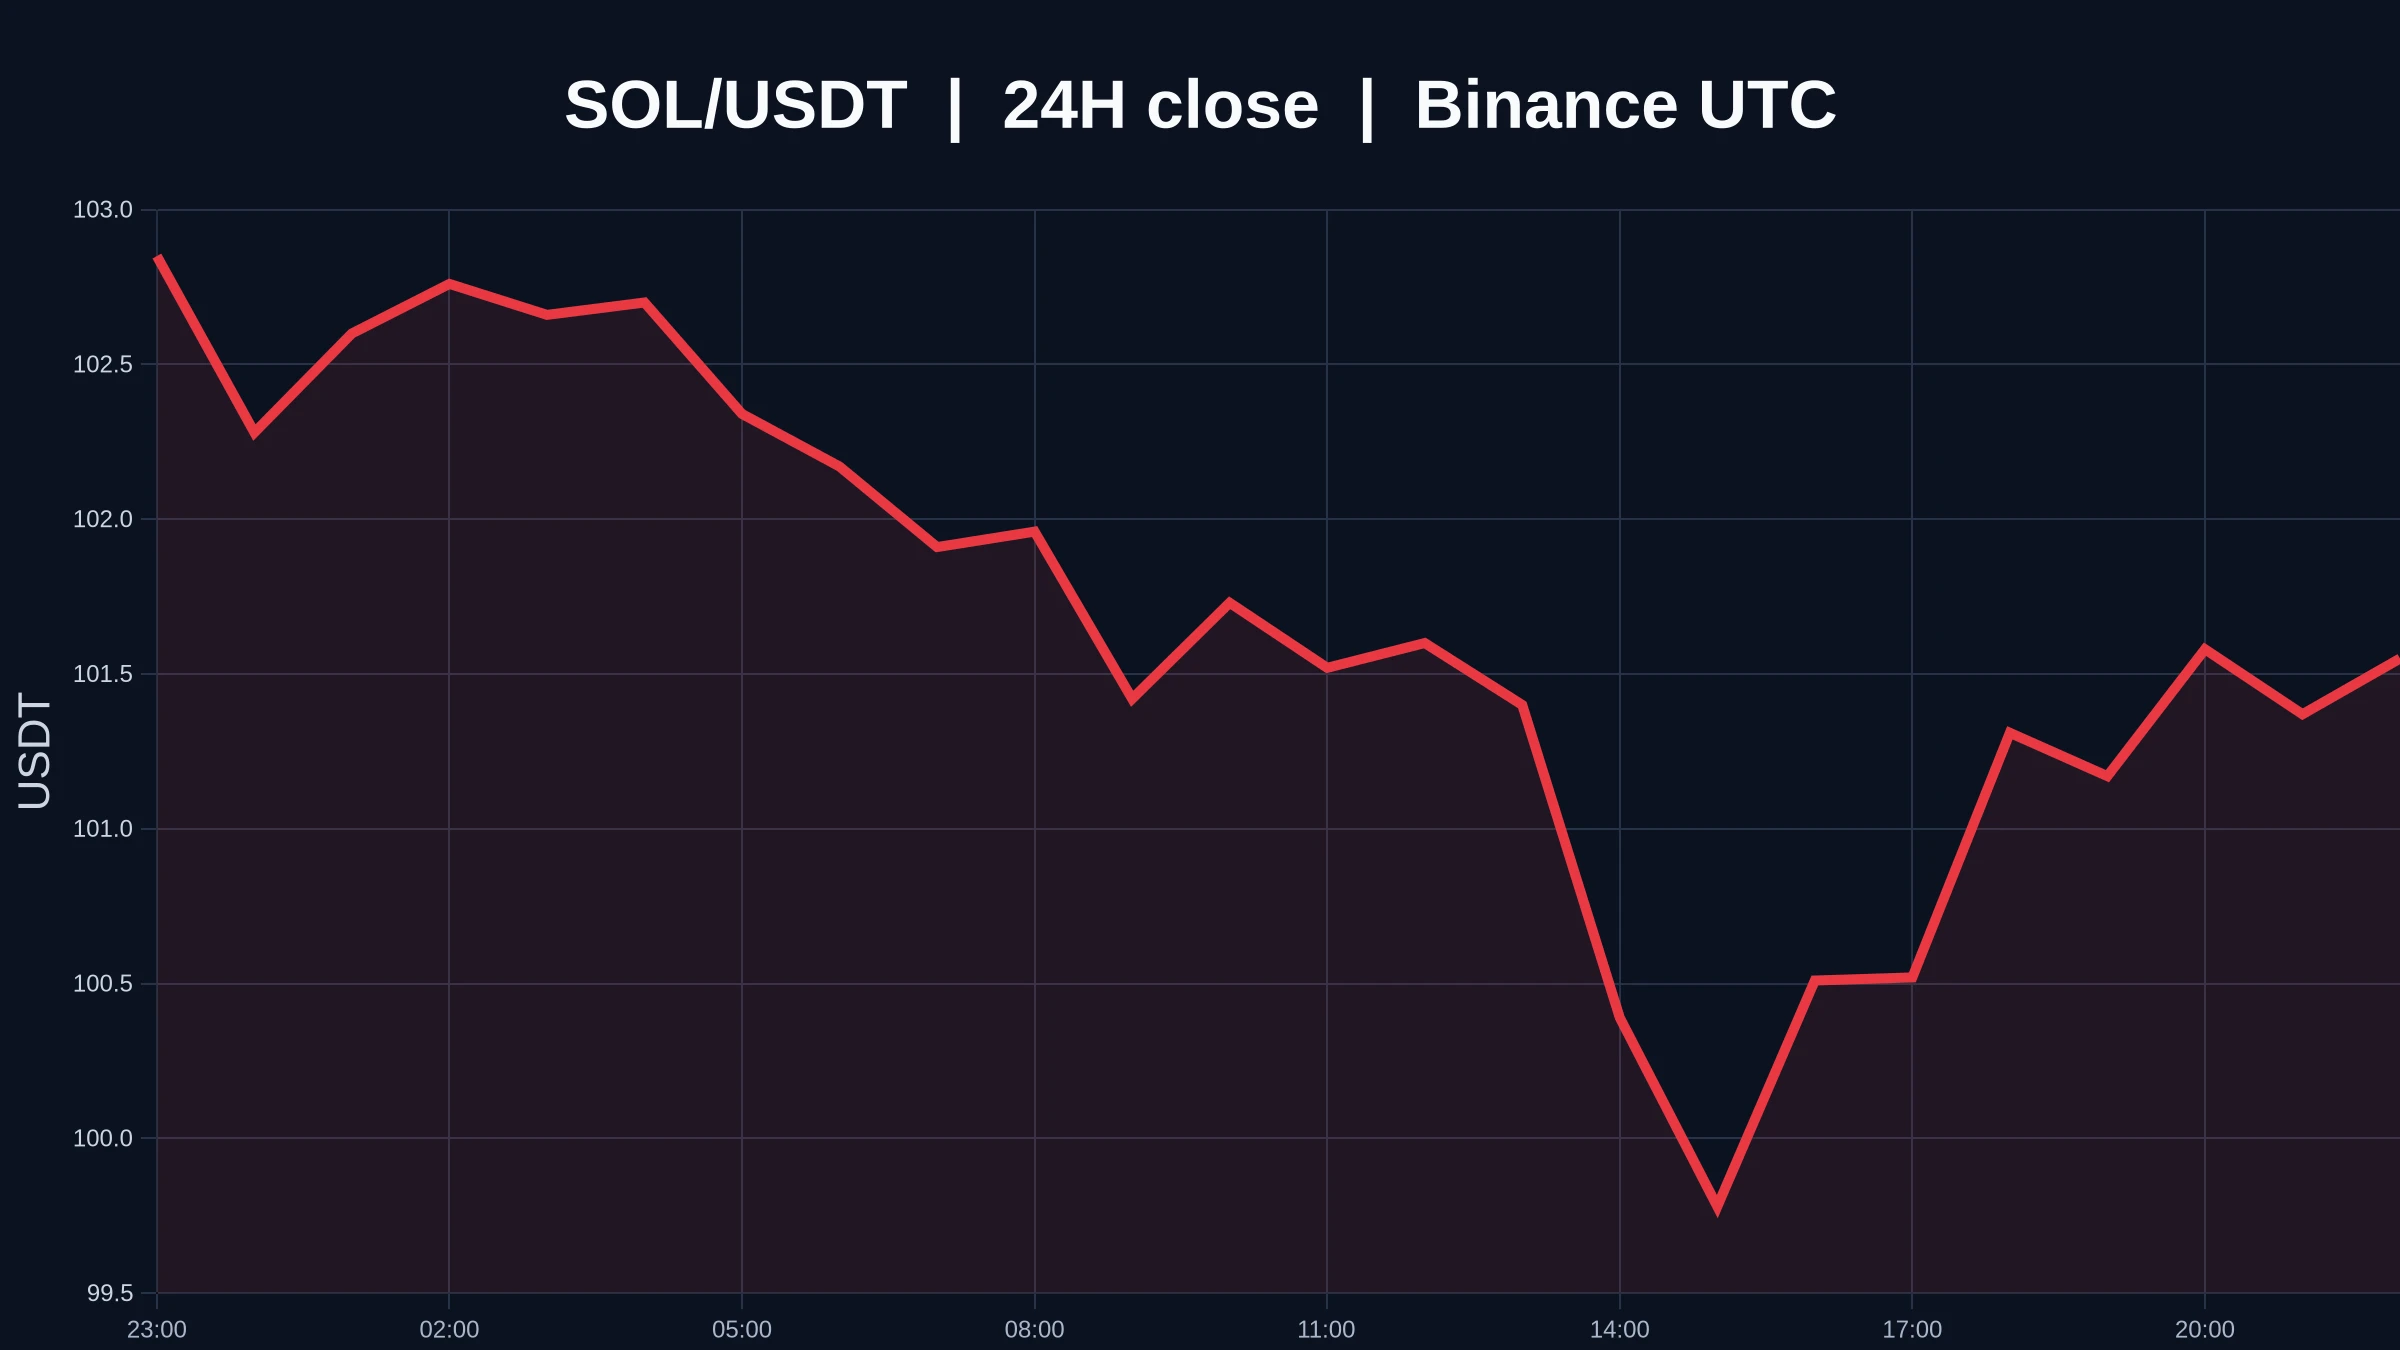
$SOL ’s 24-hour result is -2.27%, but that result is neither a cause nor a forecast. What we can confirm now is 101.4, 0.00x volume, and weakness on both the 1-hour and 4-hour timeframes.
The easiest mistake here is to look only at candle colors and ignore participation, mistaking a test move for a genuine breakout. You can tentatively trust the direction, but not its continuation; a move without follow-through can be reversed at any time.
Reading the chart can be simple: below 98.62 is one outcome, above 103.13 is another, with the broader boundaries at 98.62 and 109.2.
For the follow-up revie
post-image
SOL-2.23%
Load More

Join 40 M users in our growing community

⚡️ Join 40 M users in the crypto craze discussion

💬 Engage with your favorite top creators

👍 See what interests you

Trending Topics

USEarningsSeason

61.71k Views3.28k Discussing

The U.S. Q3 earnings season is in full swing, with major tech companies including Tesla and Meta reporting results. Market focus is shifting beyond revenue and profit toward AI spending, capital expenditure, margins and forward guidance. Which company’s earnings are you watching most closely?

GateWCTCS9GlobalTradingCompetition

597.98k Views7.89k Discussing

USConsumerSentimentNearRecordLow

5.31k Views214 Discussing

View More