Share your thoughts
placeholder
Article
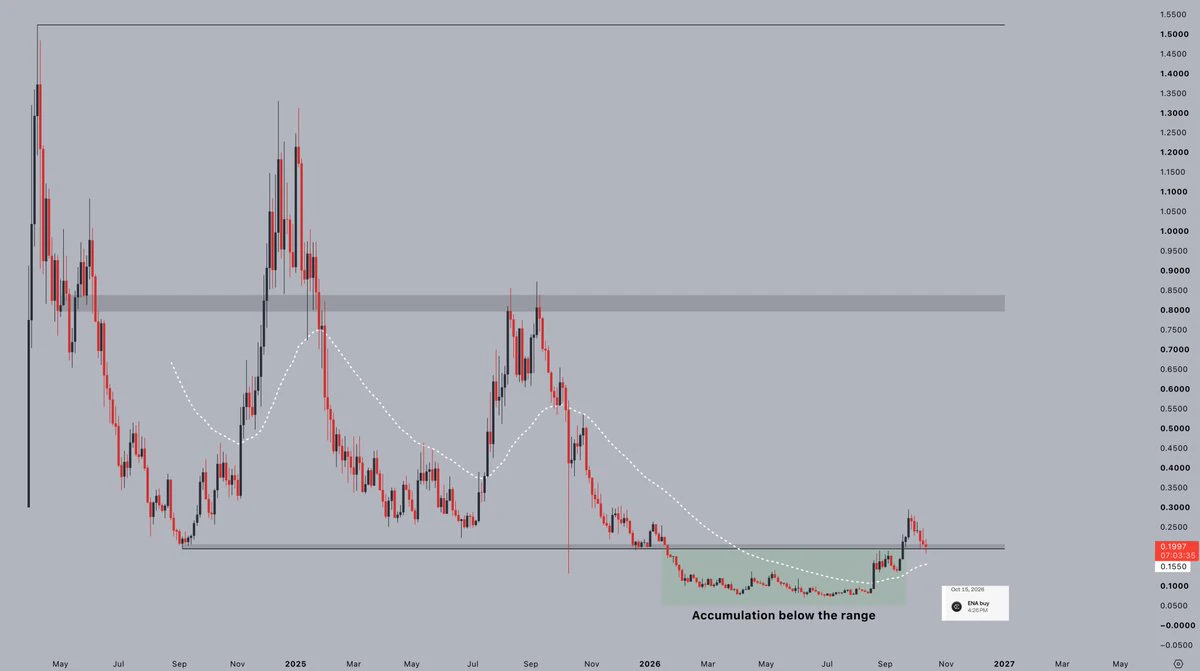
Altcoin dominance has started pushing some crucial levels.
Especially after months of staying below, we are seeing a major bounce in the ecosystem volume.
Is this the beginning of full fledged Altcoin super cycle ?
post-image
BTC & ETH Test Previous Resistance Again! Can Buyers Finally Turn It Into Support?
live-cover
LIVE1,301
  • 1
$ZEN Holdings
Kinda confused here… sell or hold? 😐
post-image
ZEN0.00%
Everyone’s staring at $BTC /USDT’s range—but the 4h clock just started ticking against the crowd.

$BTC /USDT - SHORT

Trade Plan:
Entry: 79574.75 – 79728.67
SL: 80390.54
TP1: 79097.59
TP2: 78728.17
TP3: 78174.05

Why this setup?
- Price is pinned at 79,651 with a SHORT bias (55% confidence) while the 1D trend says “range”—that’s a compression coil, not a pause.
- RSI on the 15m (54.95) is neutral, giving sellers room to push without being “oversold” too early.
- ATR (1h) at 307 means we have ~600 of daily noise—our targets (TP2 78,728) sit just beyond that, making the move surgical, no
BTC-1.65%
#PONS Why is Pons so deserving of its explosive popularity?
While the market was still reviewing the incremental benefits brought by the previous round of Bitcoin ETFs, Robinhood Chain had already developed a completely unfamiliar trading paradigm. Buying Meme coins no longer requires USDT or ETH—you must first hold tokenized Nvidia stock.
Two months after launch, on-chain TVL climbed from zero to $700-$800 million, daily DEX trading volume surpassed $1.686 billion, and the PONS platform token has continued gaining 20%-30% every day. The price speaks for itself!
Tokenized-stock Meme projects g
PONS+23.20%
  • 2
🔷️ K-Line & Structure Analysis of $CYS
​Current Trend: Short-term bearish impulse followed by horizontal range consolidation on the 15-minute timeframe.
​Candle Pattern: Sharp sell-off from 0.2492 down to 0.2368, followed by small-bodied candles (spinning tops/dojis) indicating lower selling pressure and base formation near local support.
​Moving Averages: Price is attempting to reclaim MA5 (0.2391) and MA10 (0.2390). MA30 (0.2422) acts as dynamic overhead resistance.
​Key Support Levels: 0.2368 (Local Support) | 0.2345 (24h Low)
​Key Resistance Levels: 0.2422 (MA30) | 0.2492 (Recent Swing
post-image
CYS-12.23%
#Web3SecurityGuide
Depositing and withdrawing funds is the point where most users meet real-world risk controls. The questions that keep coming up are practical: what can go wrong, how people accidentally trigger reviews, and what is the safer way to move capital when the system flags something.
The first layer of risk sits on the banking side. Cards and bank accounts can be frozen when the flow of funds looks unusual to the bank’s monitoring systems. Large or frequent transfers, sudden changes in pattern, or transactions linked to higher-risk categories can all prompt a temporary hold. When
  • 3
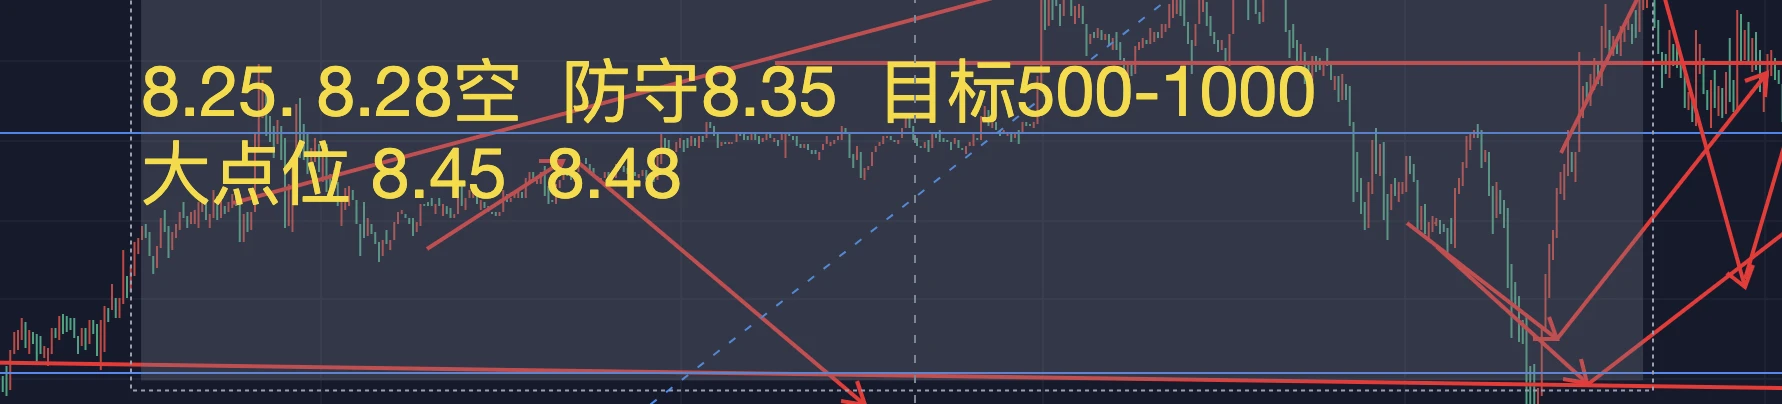
Plunging straight down, gold has nosedived 100 points in a single day—the second wave of the decline!
The fairest thing about the market is that every judgment will ultimately be validated, whether it was the first wave down to 4470 or the positioning ahead of the nonfarm payrolls report. The market has validated them all. (All posts were made public in advance and can be reviewed.)
Those who understand are already counting their money. I’m really not bragging here—there’s simply no need to. Every idea, trade, direction, and target was provided in advance and made public. I can’t bring myself
XAUT-0.74%
Triangle breakouts that made everyone happy yesterday.
post-image
  • 1
DASH at $67—are you chasing it?
Look at the surface first: a sharp pump followed by a pullback, leaving retail traders conflicted.
The 24-hour high hit 73-75, while the low was pulled up from 49, with volatility exceeding 40%. Trading volume surged to $550 million, meaning turnover exceeded 60% against an $850 million market cap. Daily RSI is at 75-86, severely overbought.
First: this rally is not DASH's own story.
After the Grayscale Zcash ETF launched and AUM surpassed $400 million, funds began rotating from ZEC into second-tier privacy coins. DASH was lifted, but it does not have a corresp
post-image
BTC-1.68%
ZEC+0.14%
DASH+24.02%
U.S job report market impact
live-cover
LIVE30
$BTC Signal: 1H momentum recovery, probing long
$BTC 1H MACD histogram 13.48, buy ratio 0.60, funding rate -0.0003%. 4H short momentum is weakening, while the 1H Bollinger Bands are only $700 apart, approaching a convergence threshold. Order book depth imbalance is 22.69%, with bids at the top level clearly dominant.
🎯Direction: Long
⚡Entry/limit order: 79445.546 - 79684.600
🛑Stop-loss: 78887.754
🚀Target 1: 80879.869
🚀Target 2: 81477.504
🛡️Trade management: Execution strategy: After reaching Target 1, reduce the position by 50% and move the stop-loss up to the breakeven level. If the pric
post-image
BTC-1.65%
Everyone’s staring at the 4H chart, but the daily trend just whispered a secret about HYPE that most will ignore.

$HYPE /USDT - LONG

Trade Plan:
Entry: 84.508 – 84.856
SL: 83.011
TP1: 85.935
TP2: 86.771
TP3: 88.024

Why this setup?
Why now? Price is coiling at 84.682 with a 95% long confidence.
• 1D trend is bullish, and the 1H ATR (0.696) shows volatility is compressing—ready to snap.
• RSI on 15m is at 60.85, not overheated, leaving room to run into TP1 at 85.935 and TP2 at 86.771.
• Invalidation sits deep at 81.871, giving you a 3.7R risk-reward before the bull thesis breaks.

D
HYPE-2.30%
Portal flips Centrifuge Protocol in total value locked, $1.67 billion versus $1.58 billion.
Portal now ranks number 36 of 58 DeFi protocols above $1.00 billion on that measure, having passed 2 of them since the last reading.
PORTAL+8.17%
CFG-3.87%
  • 1
Everyone’s chasing SUI at 0.7862—but the 15-minute RSI just screamed 84. That’s not momentum; that’s a fuse.

$SUI /USDT - SHORT

Trade Plan:
Entry: 0.7838 – 0.7886
SL: 0.8092
TP1: 0.7689
TP2: 0.7574
TP3: 0.7402

Why this setup?
Why now? The 1D trend is *range*, not breakout—so this spike is a liquidity grab.
- RSI 15m at 84.01 = overbought exhaustion, ripe for a snap-back.
- ATR 1h shows thin volatility (0.0095), meaning stops are tight; a push to TP1 (0.7689) could cascade into TP2 (0.7574).
- Entry zone 0.7838–0.7886 is the *rejection pocket*—price has visited it twice without clos
SUI+1.31%
When I initially opened a long position in $UAI , I didn't actually plan to hold it for long. At the time, I judged that the short-term structure was relatively strong, so I tested the waters around 0.38587. Unexpectedly, after entering, the market kept moving more smoothly, directly offering profit potential far beyond expectations. Having a position steadies your mindset—you can hold through pullbacks, and only when the price surges do you remember that it's time to manage the position.
So today I made the decision to take profit directly on the +908.72% position, locking in most of the gains
post-image
UAI+28.90%
BTC-1.65%
XRP-3.10%
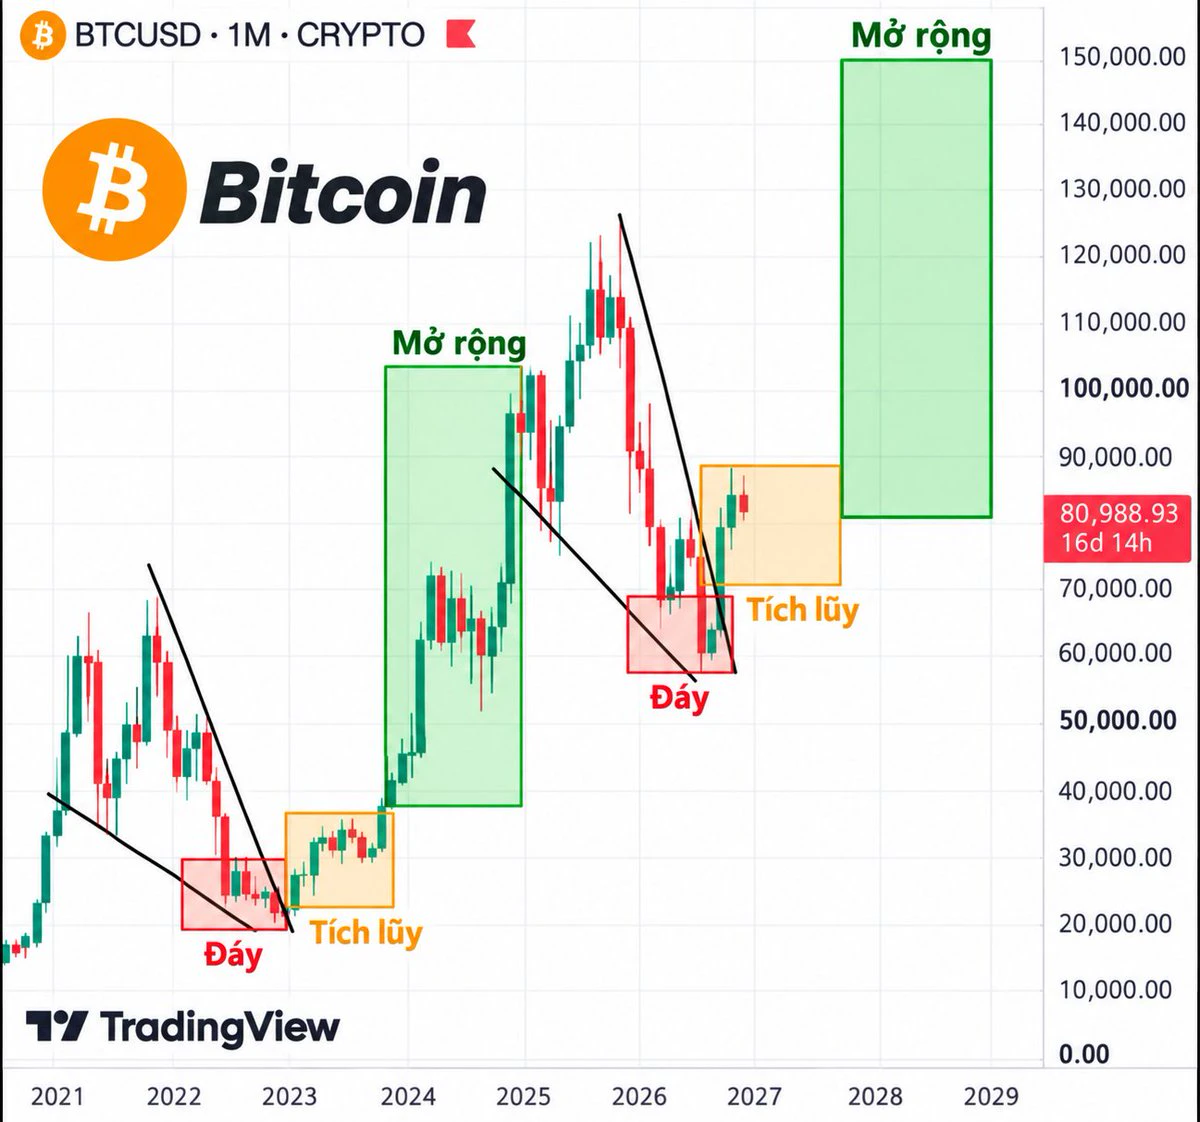
$BTC daily - rejection from resistance zone.
But market structure is still bullish.
Breakout looks close, just $84.6k sitting right above as next resistance.
$BTC #BTCReclaims80K #Gate60MillionUsers
post-image
BTC-1.68%
  • 2
  • 1
#GateEventContractTradeSharingChallenge
Gate Event Challenge: Why Execution Friction Matters More Than Rebate Value for Sustainable Edge
Gate’s Challenge offers 5 USDT rebates and lucky draws. But "valid trade" definitions often hide slippage costs. The real edge lies in calculating whether the friction of executing a qualifying trade erodes the rebate value before you even claim it. Here’s my validation framework. 👇
🔍 Why Friction Topology Determines True Net Gain (Not Just Gross Reward)
• Spread-to-Rebate Ratio Is The Real Metric: A 5 USDT rebate is meaningless if the bid-ask spread on yo
post-image
BTC-1.68%
ETH-2.77%
🔥Epic divergence! Nonfarm payrolls shook the market, yet capital collectively fled into storage!
Tonight's market action completely overturned everyone's expectations!
Nonfarm payrolls came in at 162,000, far above expectations, directly pushing the probability of a September rate hike from 49% to 58%, while Treasury yields surged to a one-year high!
By all logic, the entire market should have plunged and risk assets should have collapsed!
But!!!
The three major US stock indexes closed lower, while semiconductors and storage stocks were all in the green, celebrating against the trend🔥
The Ph
post-image
SNDK+11.88%
This overnight push finally got my trade back into profit. After entering $WLD around 0.3736, it first swept through a pullback. I didn’t exit then because the daily structure was still bullish, and the hourly chart had not truly broken down. Now that the price is around 0.3962, I took +429.53% off the table as planned, moved the protection level on the remaining position directly higher, and have already locked in part of the profit, which feels much better psychologically. I’m not being greedy with the +429.53% unrealized profit for now—the return and order-book spread have already become to
post-image
WLD+0.92%
SNDK+10.37%
SOL-1.56%
Load More

Join 40 M users in our growing community

⚡️ Join 40 M users in the crypto craze discussion

💬 Engage with your favorite top creators

👍 See what interests you

View More