Square
Following
Hot
News
Notifications
Profile
Share your thoughts
placeholder
Article
$UAI ‌
UAI is experiencing a massive parabolic breakout, surging over 74% in 24 hours to current levels around $0.1809. The market is in extreme price discovery mode following a massive volume spike that broke through previous consolidation.

· Resistance: $0.1947 (Current 24h high and local top).
· Immediate Support: $0.1766 (MA5) and $0.1493 (MA10).
· Major Support: $0.1165 (MA30) and the origin breakout zone near $0.0928.

The 1-hour chart reveals a massive bullish impulse, followed by a slight consolidation phase. The current candle shows rejection at the $0.1947 high, with the price pull
UAI-7.58%
  • 10
  • 2
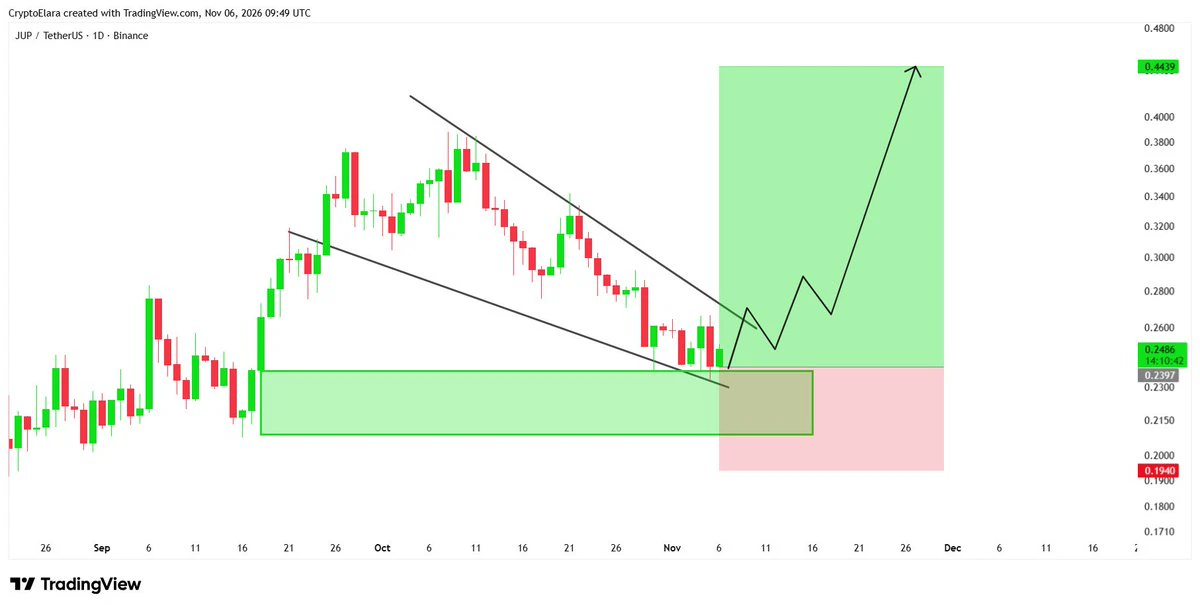
🚀 solana:JUPyiwrYJFskUPiHa7hkeR8VUtAeFoSYbKedZNsDvCN bouncing clean off key daily demand zone; structural breakout setup primed for massive upside expansion. 📈
post-image
SOL-0.77%
Trenches
BTC
B
bade
b
BTC
C5xp...pump
Market Cap
$.
Change
.
24h Vol
$.
Holders
.
ZIG
Z
bade
b
ZIG
0x8c...1145
Market Cap
$.
Change
.
24h Vol
$.
Holders
.
GM
G
bade
b
GM
0x13...7777
Market Cap
$.
Change
.
24h Vol
$.
Holders
.
STONK
S
bade
b
STONK
6GmA...UNgx
Market Cap
$.
Change
.
24h Vol
$.
Holders
.
DESSA
D
bade
b
DESSA
npz2...pump
Market Cap
$.
Change
.
24h Vol
$.
Holders
.
11.6BTC
URGENT NOTICE!!
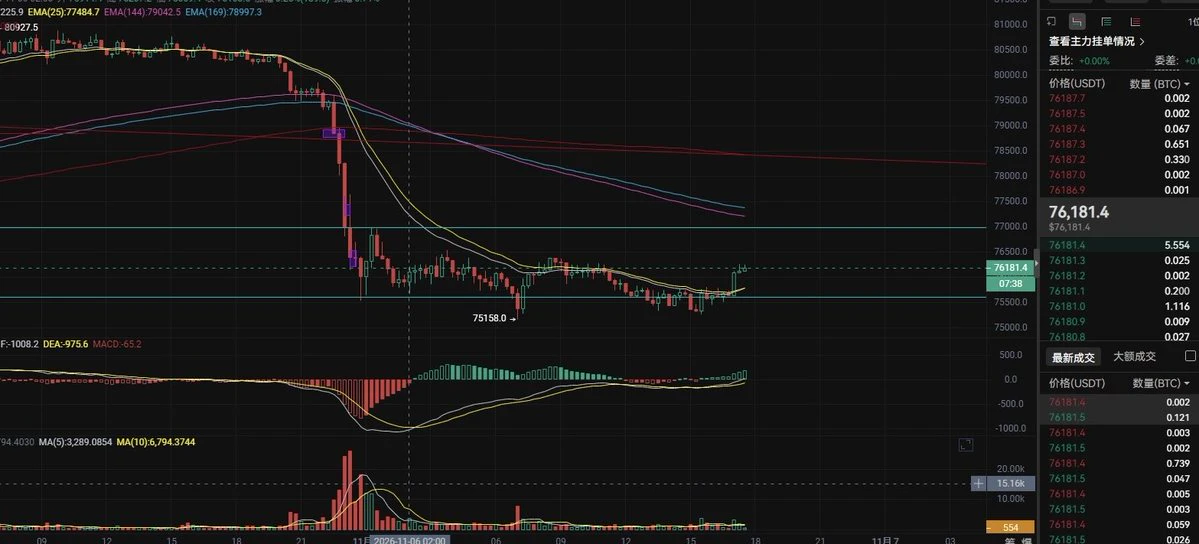
Guys, we’ve got a three-part bullish divergence on the 15-minute chart. This run to 770 should be no problem, okay?
Get in at market price and go long now!!
Exit before the NFP, then short again!! Let’s take out both the longs and the shorts!
No one will help me reach for the clouds—I’ll trudge through the snow to the summit on my own!!
post-image
#BTC
11.6 Bitcoin analysis
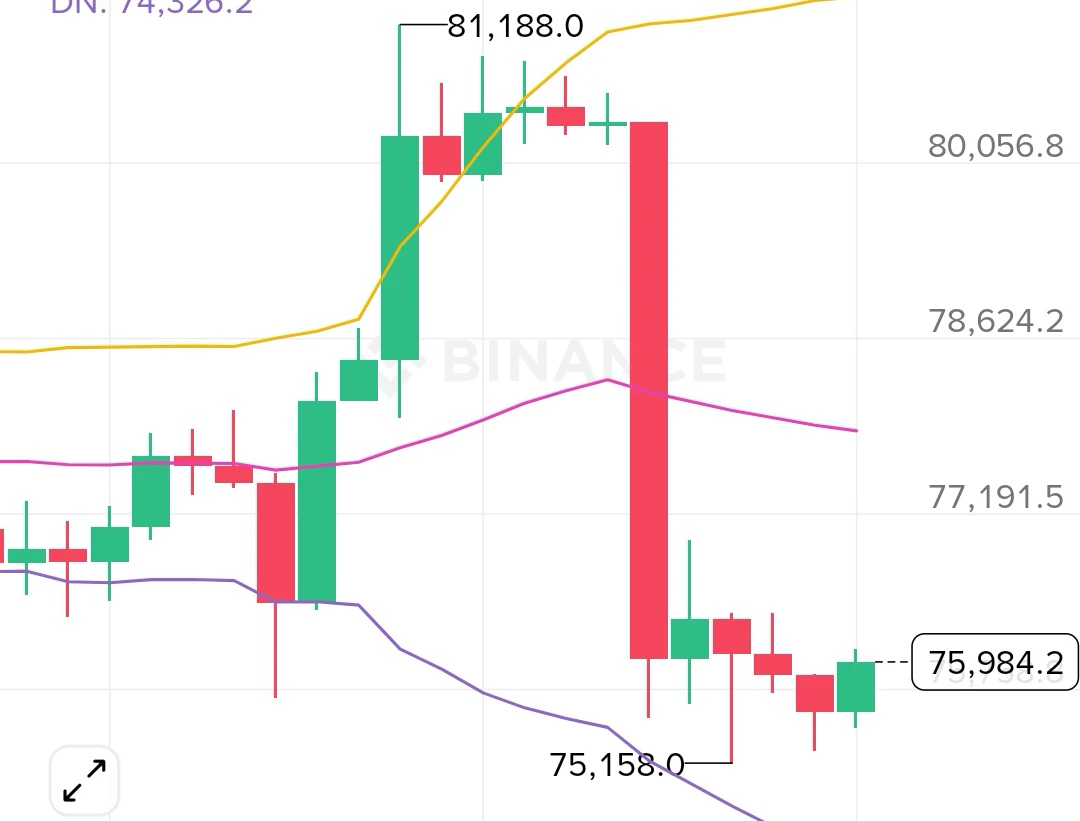
On the 4-hour chart, selling pressure has pushed price below the Bollinger middle band, with bears in control. KDJ indicates oversold conditions, so those looking to trade short-term can try to catch a small rebound. The first resistance above is 77800, with support below at 75158. If price fails to reclaim the middle band, the bias remains bearish, with further downside likely.
Trading suggestion:
Short in the 76500-7700 range, targeting further downside; stop-loss at 77800
post-image
BTC-0.67%
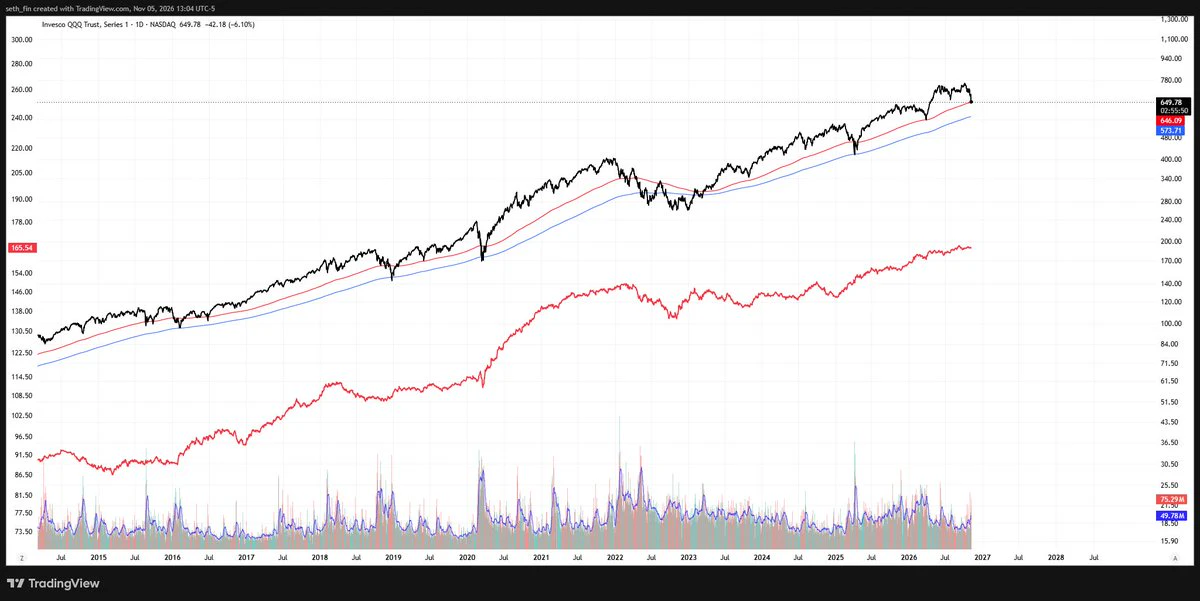
$NDX $Q Nasdaq Tech 100 Index retesting the red line support.
Will it bounce at the red or blue line? How many leverage institutions blew up?
Time will tell.
post-image
INDEX+0.00%
U.S. Stocks Plunge After the Midterm Elections, Led by AI Stocks, Dragging BTC Down Too! When Will T
live-cover
LIVE1,300
WORKED FOR 7S
SOXSG GAINS 6.0%: WHAT DOES THIS RALLY REALLY TELL US?

1. THE SURPRISING DETAIL: A GAIN LINKED TO FALLING SEMICONDUCTOR STOCKS

SOXSG/USDT gained 6.0% in 24 hours, reaching 67.86 USDT. Its reported 24-hour trading volume was approximately 2,724,371 USDT as of November 6, 2026, at 09:25 UTC.

But there is an important detail: SOXSG is associated with a leveraged inverse semiconductor ETF, not an ordinary cryptocurrency. That changes how we should understand its price movement.

2. WHY DOES SOXSG MOVE DIFFERENTLY?

SOXSG is associated with a semiconductor bear ETF designed to bene
post-image
SOXSG+1.97%
#USStocksFaceHistoricSelloff
Market Correction as an Entry Point: A Rational Approach to DCA

The recent declines in U.S. equities, including the Nasdaq's 5% drop and the significant decreases in $NVDA and $AMD, represent a structural market adjustment. Rather than framing this as a negative event, it is a logical phase for systematic accumulation. The market is undergoing a necessary repricing, and this environment presents a practical opportunity to execute a Dollar-Cost Averaging (DCA) strategy.

1. The Post-Midterm Macro Context
Following the midterm elections, the market is adjusting to
NVDA-9.33%
AMD-17.64%
NAS100+1.75%
MU-17.23%
  • 7
They said new lows were coming, but is the bottom in? Not necessarily. 2x December may provide a signal$BTC $ETH ‌
post-image
BTC-0.65%
ETH-1.23%
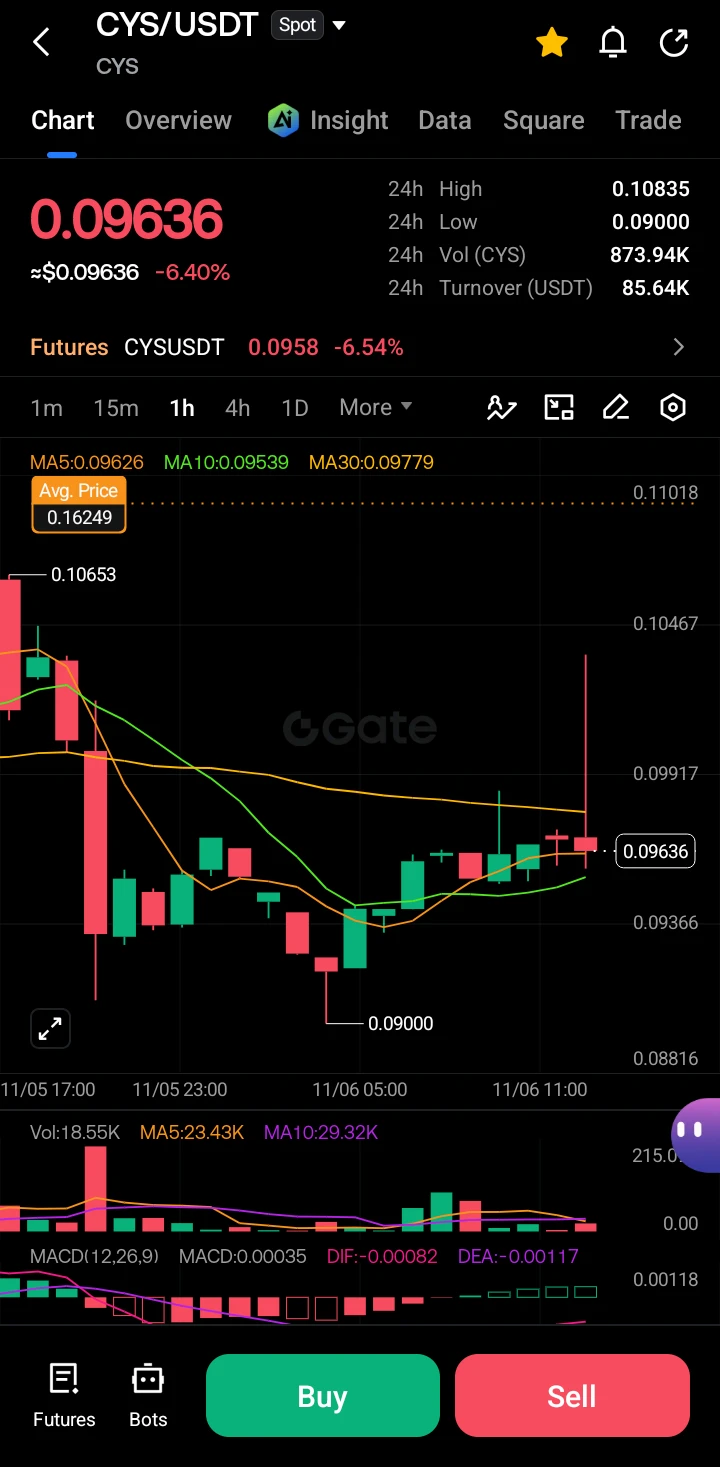
CYS/USDT – Intraday Technical Update & Setup
$CYS ‌
The CYS/USDT pair is currently exhibiting clear bearish momentum on the intraday timeframe. After a sharp rejection from the 0.10653 level, the price has established a local downtrend, printing consecutive lower highs and lower lows. The asset is currently trading around 0.09636, down 6.40% over the 24-hour period, with a session low of 0.09000. The broader market structure suggests persistent downward pressure, and buyers have yet to demonstrate the volume required to reverse the trend.

Technical Analysis.

Looking at the 1-hour chart, the
post-image
CYS-0.35%
  • 7
  • 1
A small-capital doubling story? Isn’t that happening over and over every moment when you open an alt account? It’s too easy to pump it up #美股史诗级抛售
Is this the kind of twisted humor the richest people share? 😂
Their billions really make them approachable.
post-image
  • 8
  • 2
U.S. Stocks Plunge After the Midterm Elections, Led by AI Stocks, Dragging BTC Down Too! When Will T
live-cover
LIVE2,844
Justin Sun and Mask Guy both sold their storage holdings at the same time.
At this point, the two gods have betrayed storage.
Mask’s holdings have fallen from 30 million to 3 million.
There are still some core holdings I can’t bring myself to sell.
post-image
$ZEC An imbalance between longs and shorts has created a longer-term range-bound market
Dense long zone below: 1180-1220
Dense short zone above: 1340-1360
Why focus primarily on range trading? zec is moving against the broader market
A breakout above 1360 would open the way for an uptrend, with a target of 1400-1440
A break below 1180 would open the way for a downtrend, with a target of 1040-1080
I’ve been repeatedly emphasizing these levels since last month
At this stage, it’s all about seeing which side prevails in the final battle
#加密市场承压
#10月非农数据聚焦
#美股史诗级抛售
ZEC+1.29%
$XRP has recorded a significant $151.6K short liquidation at $1.1993, indicating strong pressure on bearish positions. This could signal a shift in short-term momentum as buyers attempt to take control and push price toward overhead liquidity. A sustained hold above the reclaimed support zone would strengthen the bullish structure.
Support: $1.1900 – $1.1950
Resistance: $1.2100 – $1.2200
Next Target: $1.2350 – $1.2500
If buyers maintain control above support, another move toward higher liquidity becomes possible. A rejection near resistance could trigger a temporary pullback. Confirmation is
post-image
XRP-1.15%
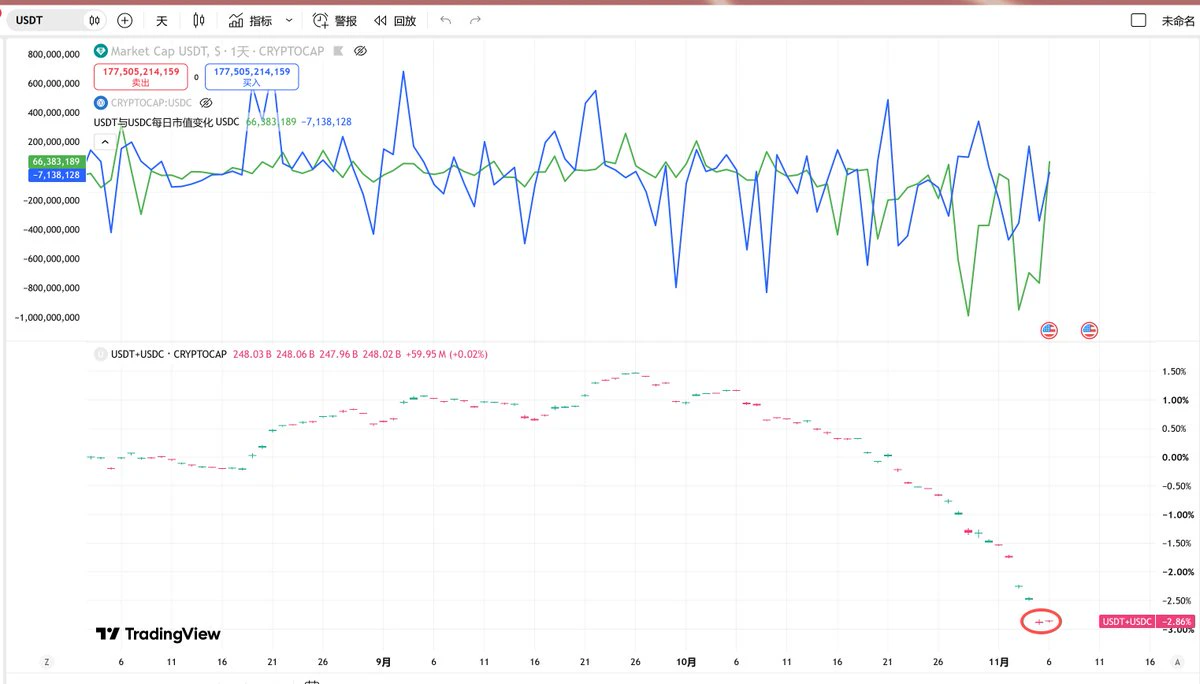
If you're buying the dip in batches, now might be worth considering.
USDT's OTC price has reached a high of 6.68, while the USDCNY exchange rate hasn't risen, so there may be a bit more downside today.
Both USDT and USDC saw inflows today, and the combined market cap of USDT and USDC also edged up.
Bee-bro picked up some ETH, SUI, and DBR.
post-image
USDC+0.01%
ETH-1.26%
SUI-1.05%
DBR-2.91%
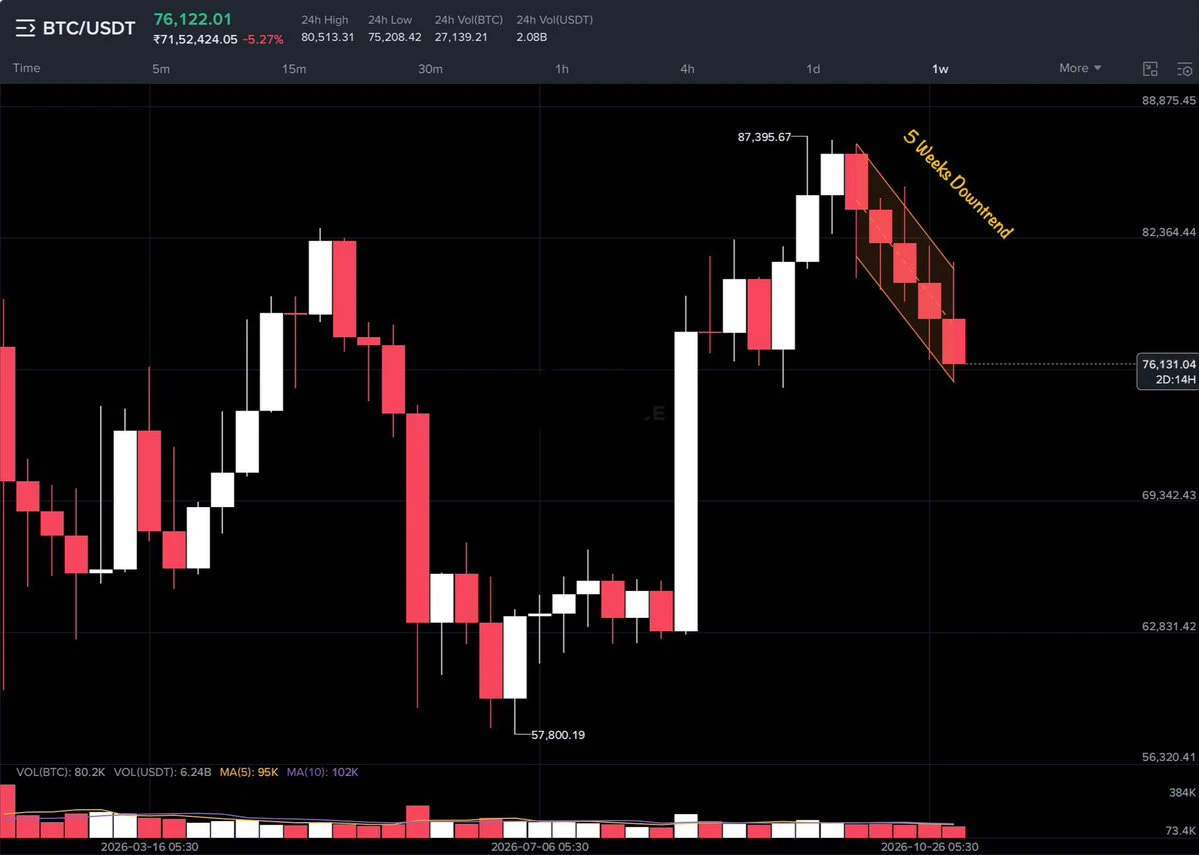
🚨 Bitcoin after hitting a recent swing high of $87,395 is facing heavy selling pressure — 5 weeks in a row of downside.
Currently $BTC trading near $76.1K (-5.27%). Losing the $74K zone could accelerate selling toward the next major support around $69K . If that fails, the $63K area comes into focus.
Higher lows from the summer low near $58K are still intact for now, but the structure is clearly under pressure. Watch $74K closely.
post-image
BTC-0.67%
  • 9
  • 1
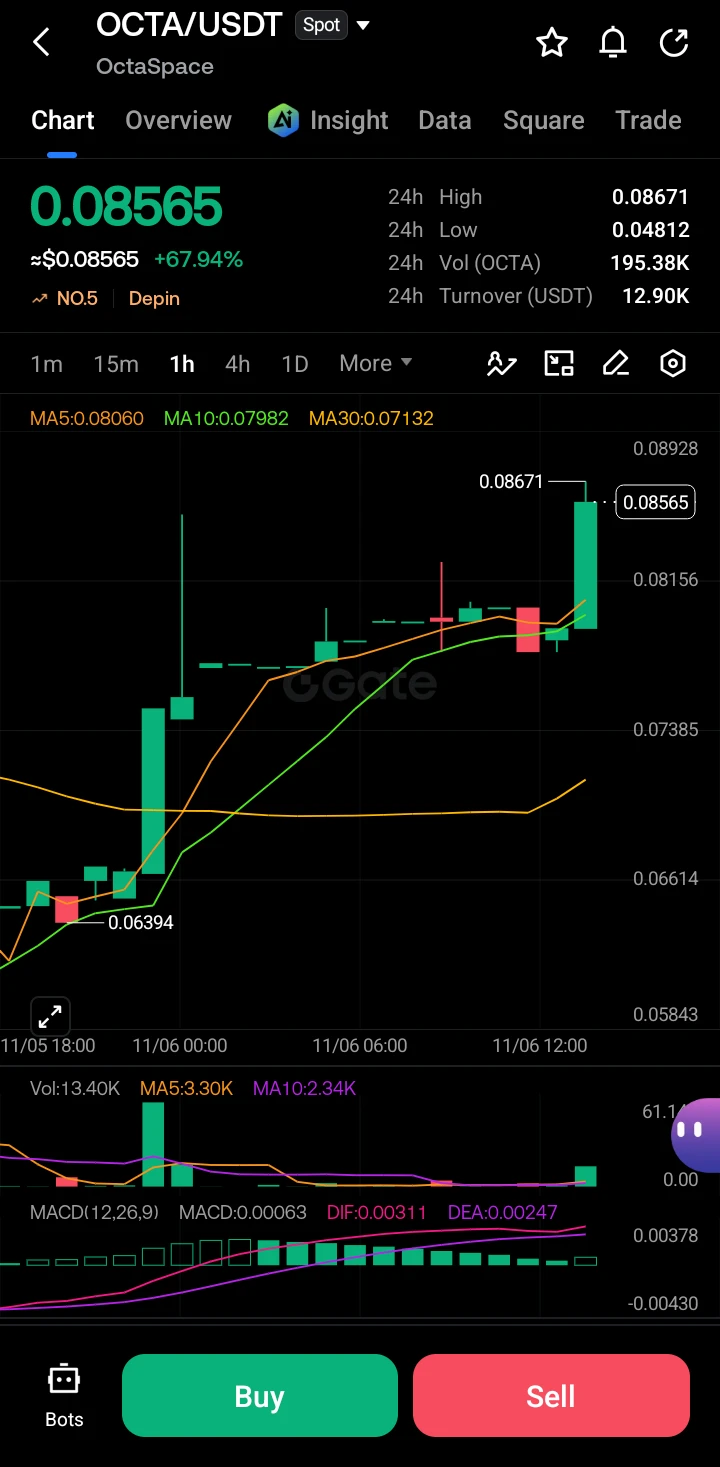
$OCTA ‌
OCTA is experiencing a massive bullish breakout, currently trading at 0.08565, up an impressive +67.94% in 24 hours. The price has surged past previous resistance levels with strong buying volume, indicated by the large green candle on the right side of the chart.

· Resistance: 0.08671 (24h High and immediate local top).
· Support 1: 0.08060 (MA5 - short-term dynamic support).
· Support 2: 0.07982 (MA10 - secondary pullback zone).
· Strong Support: 0.07132 (MA30 - trend invalidation level).

The 1H chart shows a strong impulsive wave. The Moving Averages (MA5, MA10, MA30) are in a cl
post-image
OCTA+7.21%
  • 6
Load More

Join 40 M users in our growing community

⚡️ Join 40 M users in the crypto craze discussion

💬 Engage with your favorite top creators

👍 See what interests you

Trending Topics

USStocksFaceHistoricSelloff

6k Views3.67k Discussing

U.S. stocks suffered a sharp selloff on Thursday, with the Nasdaq closing down more than 5% and the Philadelphia Semiconductor Index falling over 12%. AI and chip stocks including $NVDA and $AMD were hit especially hard. Markets are reassessing AI valuations, data-center spending and future returns. Is this just short-term deleveraging, or the start of a deeper correction in the AI trade? Which sectors are you watching next?

GateLaunchesPoSECProofOfSecurity

15.6k Views594 Discussing

USNonfarmPayrolls

13.73k Views4.06k Discussing

View More