Square
Following
Hot
News
Notifications
Profile
Share your thoughts
placeholder
Article
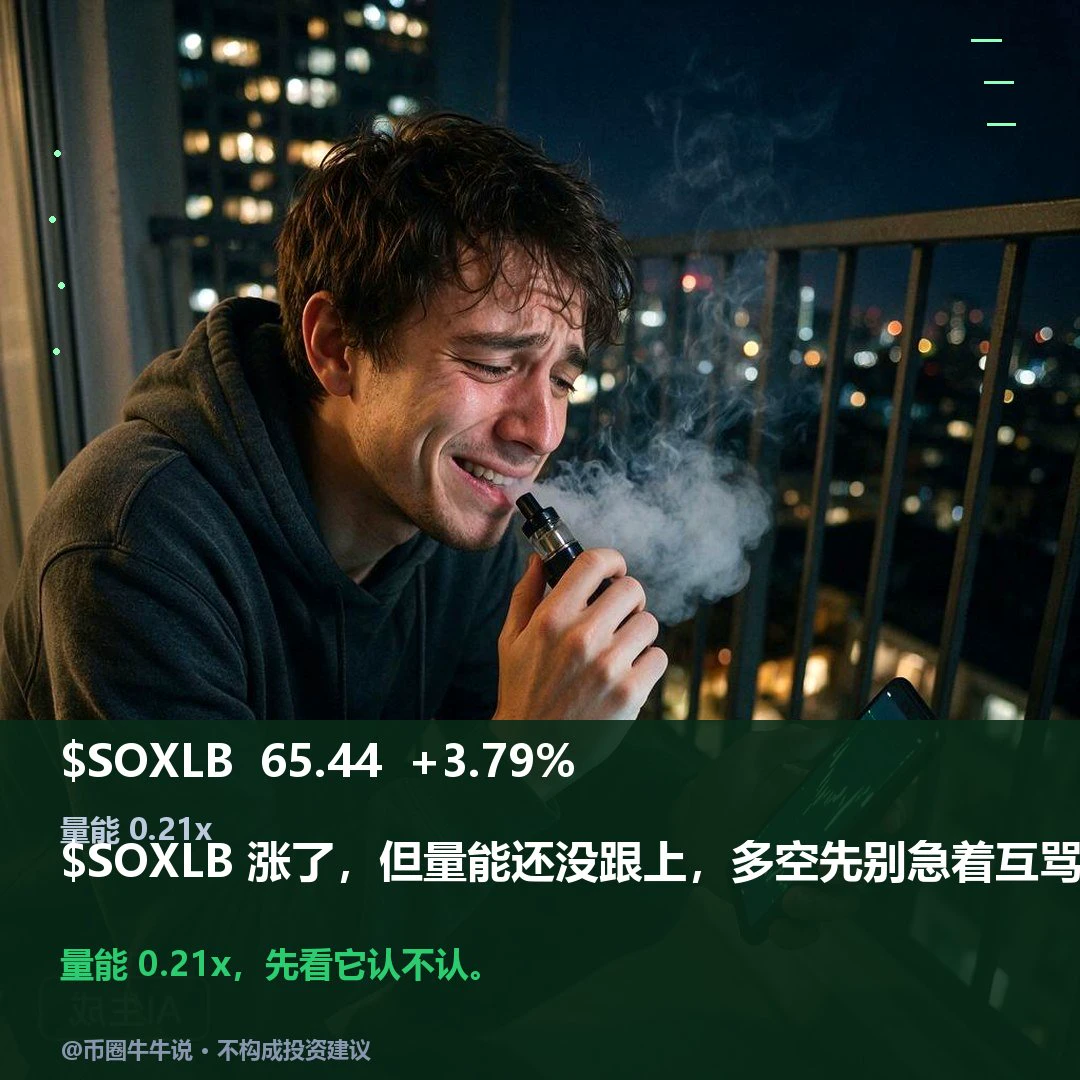
$SOXLB Currently at 65.44, up 3.79% over 24H. The 1H chart is leaning bullish: price is above the EMA20 at 64.80, and RSI is 47.8. The 4H chart is also leaning bullish, with an EMA20 of 61.96 and RSI of 56.4. Both time frames are leaning bullish, but the volume ratio is only 0.21, so a breakout needs confirmation. Watch: only a sustained hold above the 68.94 resistance level would suggest further strengthening; a break below 58.42 support without a recovery would damage the bullish structure. In the next review, focus on whether price can hold above 68.94 with rising volume; if it breaks below
post-image
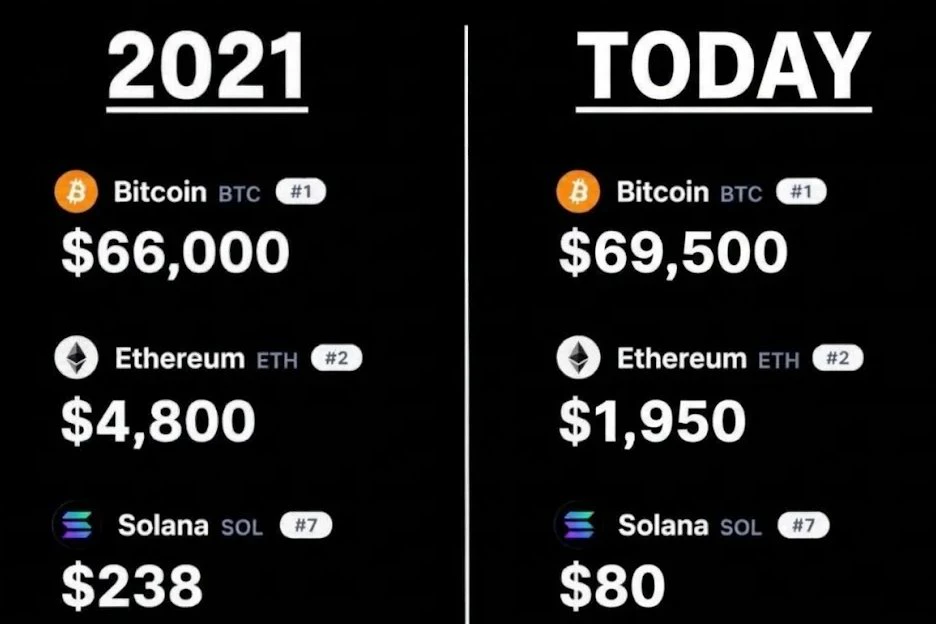
U.S. stocks fall, Bitcoin falls.
U.S. stocks rise, Bitcoin falls.
What cardinal sin did Bitcoin commit?
The market’s fallen so hard that no one even wants to talk on X anymore.🤣
post-image
BTC-0.67%
  • 2
  • 3
Trenches
mihao
m
bade
b
mihao
4Cxj...pump
Market Cap
$.
Change
.
24h Vol
$.
Holders
.
AGT
A
bade
b
AGT
0x5d...e274
Market Cap
$.
Change
.
24h Vol
$.
Holders
.
FOOD
F
bade
b
FOOD
FTu5...pump
Market Cap
$.
Change
.
24h Vol
$.
Holders
.
IDOL
I
bade
b
IDOL
0x3b...ab07
Market Cap
$.
Change
.
24h Vol
$.
Holders
.
AI
A
bade
b
AI
2T56...pump
Market Cap
$.
Change
.
24h Vol
$.
Holders
.
The modern hedge against inflation
post-image
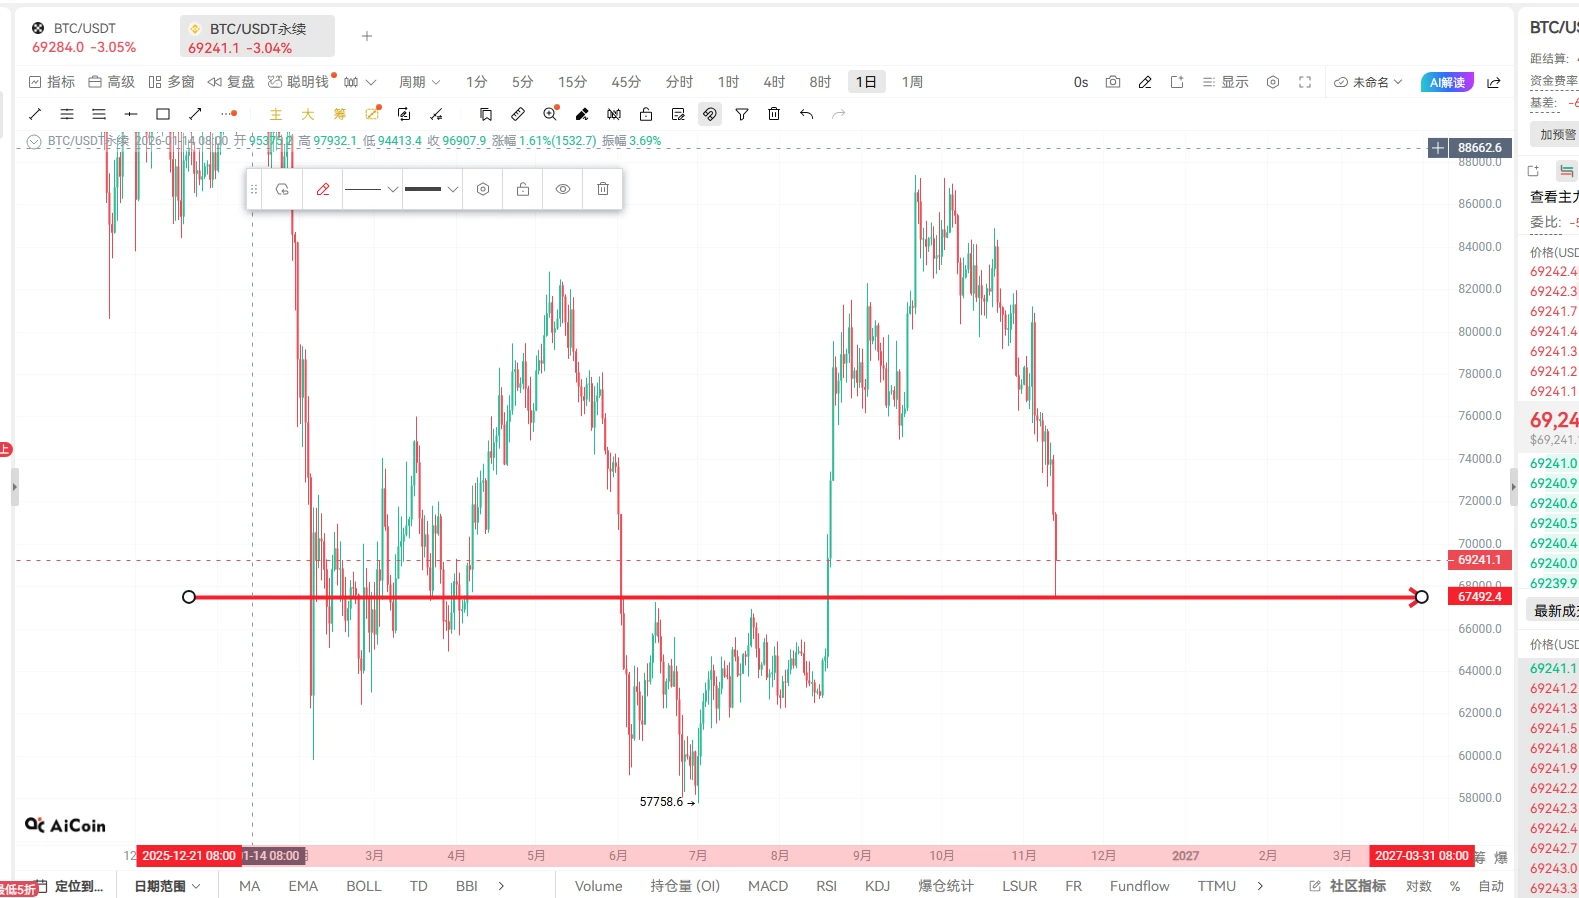
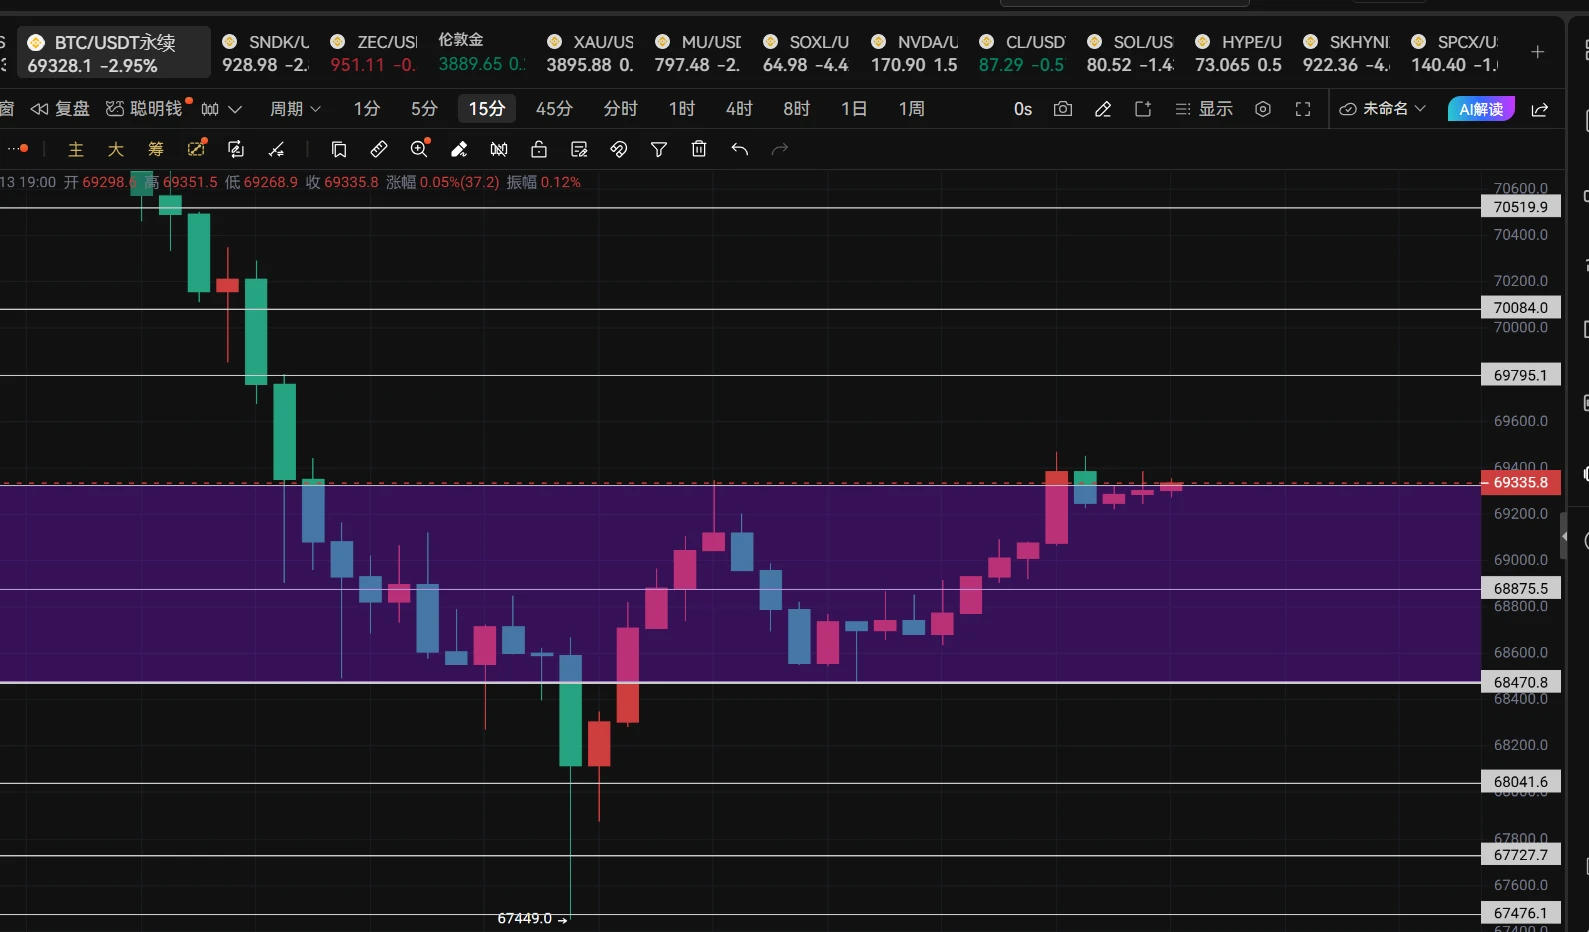
$BTC Evening outlook: 11.13.

You got completely thrown off by this drop in $BTC , right? Are you all afraid to go long now? Don’t be confused—just keep buying spot. As long as you believe it won’t go to zero, keep buying spot in batches.

Has BTC stopped falling for now? The first bottoming signal has appeared in the area marked by the white box below. This bullish engulfing pattern indicates a rebound is needed at the current timeframe.

Look at the red arrows above: price has rebounded twice but failed to break above the 69000 resistance level. This shows the rebound is weak and the major
BTC-0.65%
MU-1.61%
🟢 $AIN Long setup – buyers are entering again, the market is taking off... Go long now with 20x leverage: Entry: 0.11000–0.11500 Take-profit 1: 0.12000 Take-profit 2: 0.13000 Take-profit 3: 0.15000 Stop-loss: 0.09500 Risk warning: If take-profit 1 is reached, take partial profits and move the stop-loss to the entry price to protect your principal. Click below to trade now...👇$AIN
post-image
AIN+3.85%
$ERA $ERA Large Long: ERA is approaching a key support zone around $0.0760, where buyers may try to spark a bounce. A successful bounce could trigger a bullish reversal—if buyers drive the next leg up, there could be substantial profits ahead. Long $ERA Entry: 0.0762–0.0770 Stop-loss: 0.0735 Take-profit 1: 0.0790 Take-profit 2: 0.0820 Take-profit 3: 0.0838 Take-profit 4: 0.0890 Trade here $ERA : 👇
post-image
ERA+24.21%
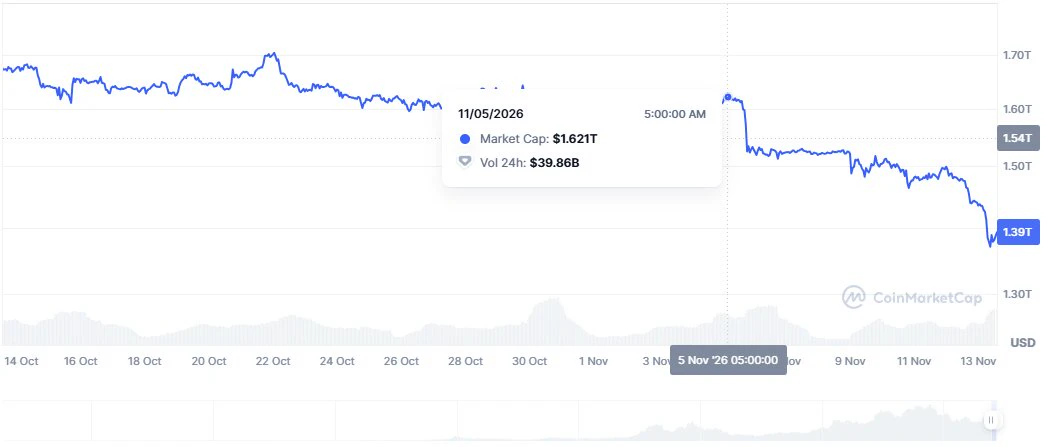
In just the past week, $230 billion has flowed out (been stolen) from #Bitcoin alone.
Just imagine what that means for altcoins.
post-image
BTC-0.67%
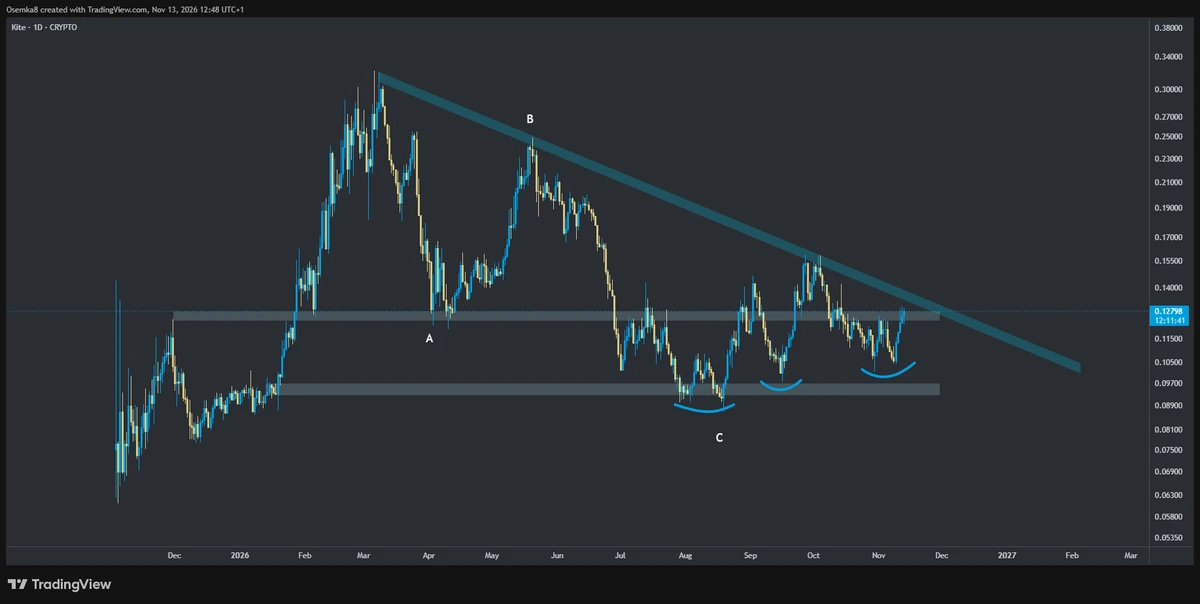
It's worth keeping $KITE on your watchlist. +20% the last few days will the crypto market sold off
Currently facing some resistance, but that diagonal looks clear and a strong move once it clears
Nothing but higher lows
post-image
KITE-0.15%
170 has been reached, and the $NVDA contract bullish call got this move right.
In that 03:22 post, I said I was bullish, with a take-profit at 170 and a stop-loss at 160; the price was 164.93 at the time. The 18:00 hourly candle hit a high of 171.62, reaching the 170 take-profit; after the post, the low was only 162.63, never touching the 160 stop-loss.
This rebound didn’t come out of nowhere: Jensen Huang suddenly resigned on the 12th, and the stock briefly plunged to 148.8. Retail investors bought $111 million in the first half hour after the open, with record dip-buying absorbing the panic
NVDA-0.35%
On November 12 local time, Nvidia announced that Jensen Huang had resigned as president, CEO, and board member, effective immediately. Succession plan: CFO Colette Kress will serve as interim CEO, and Harvey C. Jones will become Nvidia’s first board chair. The board has begun a CEO search and is considering both internal and external candidates. Huang led Nvidia for 33 years; the announcement did not state the reason for his departure. Market reaction: After the news broke, NVDA shares fell more than 13% at one point in premarket trading, hitting an intraday low of $148.8. The stock closed at
post-image
NVDA-4.49%
In BTC trading, many traders have had this experience: the price suddenly breaks through a key resistance level, and they think the uptrend has finally begun, so they immediately enter by chasing the rally. But before long, the price quickly falls back into its previous range, or even triggers their stop-loss. This phenomenon is commonly known as a false breakout.

So, how can you identify a false breakout?

First, watch trading volume. A genuine breakout usually needs to be accompanied by sufficient trading volume. If the price breaks through a key level but trading volume does not increase s
post-image
BTC-0.67%
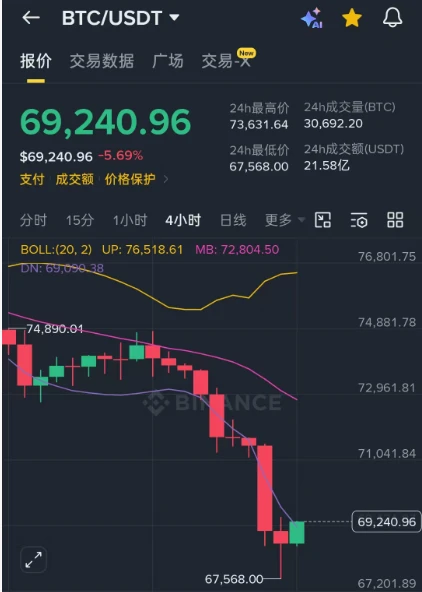
BTC is now around 69,300; go long, target around 72,000, with a stop-loss at the new low.
BTC fell nearly 7,000 points today, and the bears have nearly exhausted their strength. The bearish news has also been fully priced in.
There are also signs that the decline is stopping.
I said this morning that after such a big drop, a rebound could come at any time. Now the rebound is here, so let's just take this leg.
‍#黄仁勋因婚外情致歉,英伟达启动独立调查

$BTC
post-image
BTC-0.67%
NVDA-4.49%
BTC’s weekly chart has posted seven consecutive bearish candles. Has it bottomed yet?

BTC’s morning sell-off exceeded expectations, driven by multiple negative factors converging: inflation data boosted rate-hike expectations, and Treasury yields rose. Jensen Huang’s departure also weighed on AI and overall risk sentiment, while Democrats winning both chambers fueled expectations of tighter crypto regulation. Continued outflows from spot ETFs, coupled with thin liquidity in the early hours, triggered concentrated liquidations of leveraged longs, magnifying the decline.

BTC rebounded after di
post-image
BTC-0.65%
  • 1
$ETH Evening outlook: Nov 13.

$ETH 2000 was broken, and there wasn't even the slightest rebound after the drop below 2000. Just how weak is this market? The bulls seem to have been beaten into submission.

ETH can only stop falling and rebound toward 2000 if it breaks above resistance at 1955. It will only start rising on the hourly timeframe after breaking 2000. If it can't break 1955, it can only consolidate in the 1955–1910 range.

If 1955 remains unbroken, a second retest of the previous low will most likely lead to a break below it, with a new low at 1861. As shown in the white box, ET
ETH-1.23%
NVDA-4.49%
I'm wearing a leather jacket
I disagree
$NVDA 📈
post-image
NVDA-4.49%
In BTC trading, many traders have had this experience: the price suddenly breaks through a key resistance level, and they think the rally has finally begun, so they immediately chase the move. Before long, the price quickly falls back into its previous range, or even triggers their stop-loss. This is commonly known as a false breakout.

So, how can you identify a false breakout?

First, watch trading volume. A genuine breakout usually needs to be supported by sufficient volume. If the price breaks through a key level but volume does not increase noticeably, market participation may be insuffic
post-image
BTC-0.67%
#USJoblessClaimsBeatExpectations
Macroeconomic Deep Dive: US Initial Jobless Claims at 200K, Federal Reserve Policy, and the Outlook for Bitcoin and US Equities

Global financial markets are navigating an intricate crossroads defined by modest labor market softening, stubborn consumer price inflation, and shifting interest rate expectations from the Federal Reserve. Recent US economic releases—specifically weekly Initial Jobless Claims rising to 200,000 compared to market expectations of 194,000—have reignited intense debate across institutional desks and retail communities alike. While an up
In cryptocurrency trading, many people watch BTC candlestick charts every day but don't know how to tell whether the market is currently in an uptrend or a downtrend. In fact, there is a very common technical indicator that can help us see the market's direction more clearly: the Moving Average, or MA.

So, what do MA20, MA50, and MA200 represent?

First, the MA20 short-term moving average. It reflects recent price movements and is relatively sensitive to short-term market conditions. When BTC trades consistently above the MA20 and the average slopes upward, it usually indicates relative short
post-image
BTC-0.67%
$AGT Down 29.6% in a day, crashing from 0.0868 to 0.0461 and now at 0.0505—I've seen this kind of crash too many times. The opportunities that can really make money are often hidden in the second wave of panic.
First, my position: I bought a tiny 5% starter position around 0.052 this morning. I'm currently down about 3%, with a stop-loss at 0.0458 (below today's low). I'll hold as long as it stays above that level. This small loss barely registers against my overall position because I entered in stages instead of going all in.
Full trading plan:
Entry rationale: 24-hour trading volume is 324 m
  • 1
In BTC trading, there is a market phenomenon worth paying close attention to: after the price falls below an important support level, an area that previously supported price increases may instead become resistance during the next rebound.

Why does this change happen?

First, the confidence of existing buyers changes. When BTC finds support in a certain price range multiple times, many traders choose to buy there. But once the price decisively falls below that range, those who had been waiting to buy may start holding back, weakening buying pressure in the market.

Second, trapped traders star
post-image
BTC-0.67%
Load More

Join 40 M users in our growing community

⚡️ Join 40 M users in the crypto craze discussion

💬 Engage with your favorite top creators

👍 See what interests you

Trending Topics

JensenHuangResigns

518.2K Views8.2K Discussing

Jensen Huang has resigned as NVIDIA CEO and stepped down from the board. CFO Colette Kress will serve as interim CEO while NVIDIA considers internal and external successors. $NVDA fell more than 10% in premarket trading following the announcement. With one of AI’s most influential leaders stepping aside, markets are now reassessing NVIDIA’s leadership stability, AI strategy, and long-term valuation.

GateIPOAccessAnthropic

281.9K Views2.6K Discussing

Dr.HanOxfordUnionSpeech

144.8K Views475 Discussing

View More