Square
Following
Hot
News
Notifications
Profile
Share your thoughts
placeholder
Article
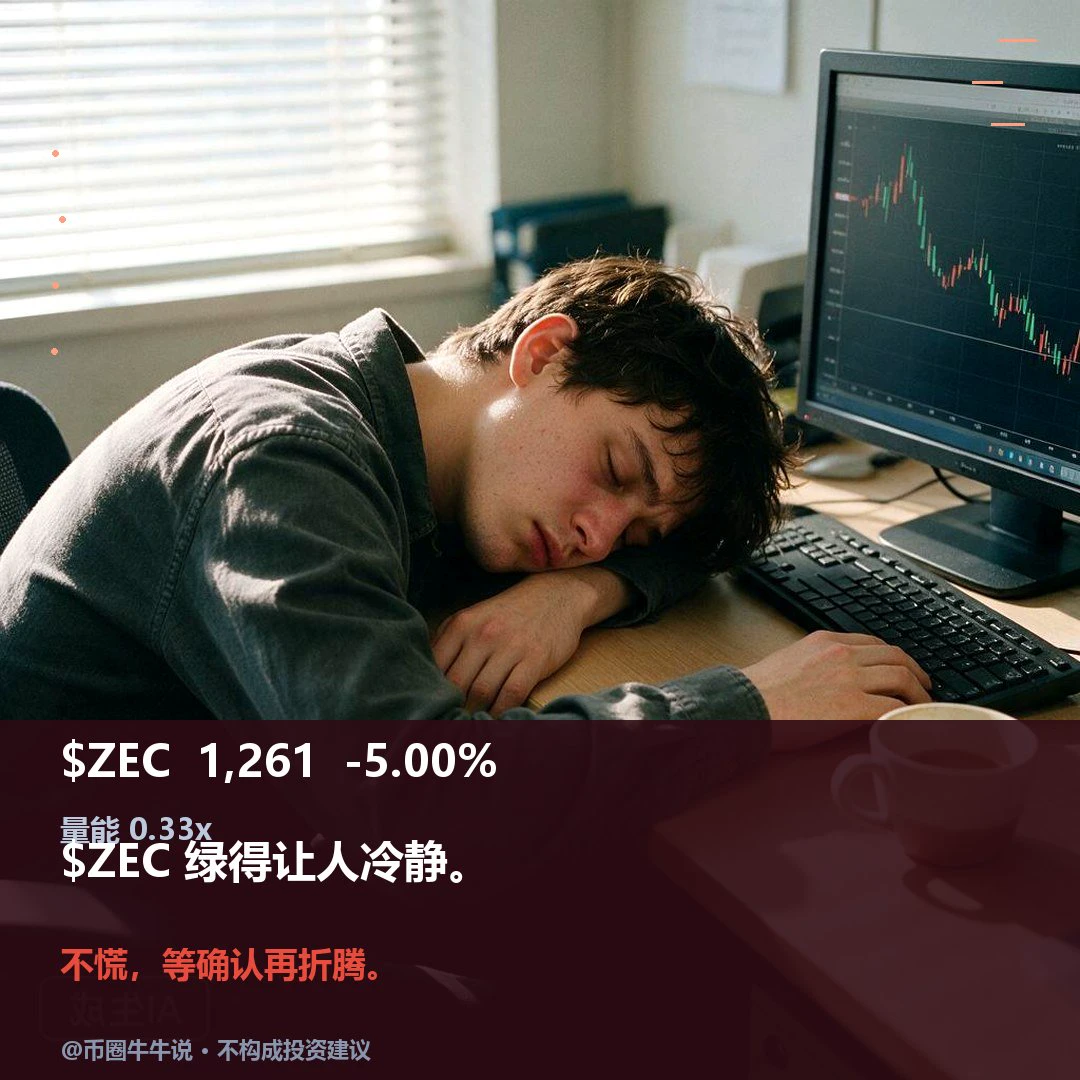
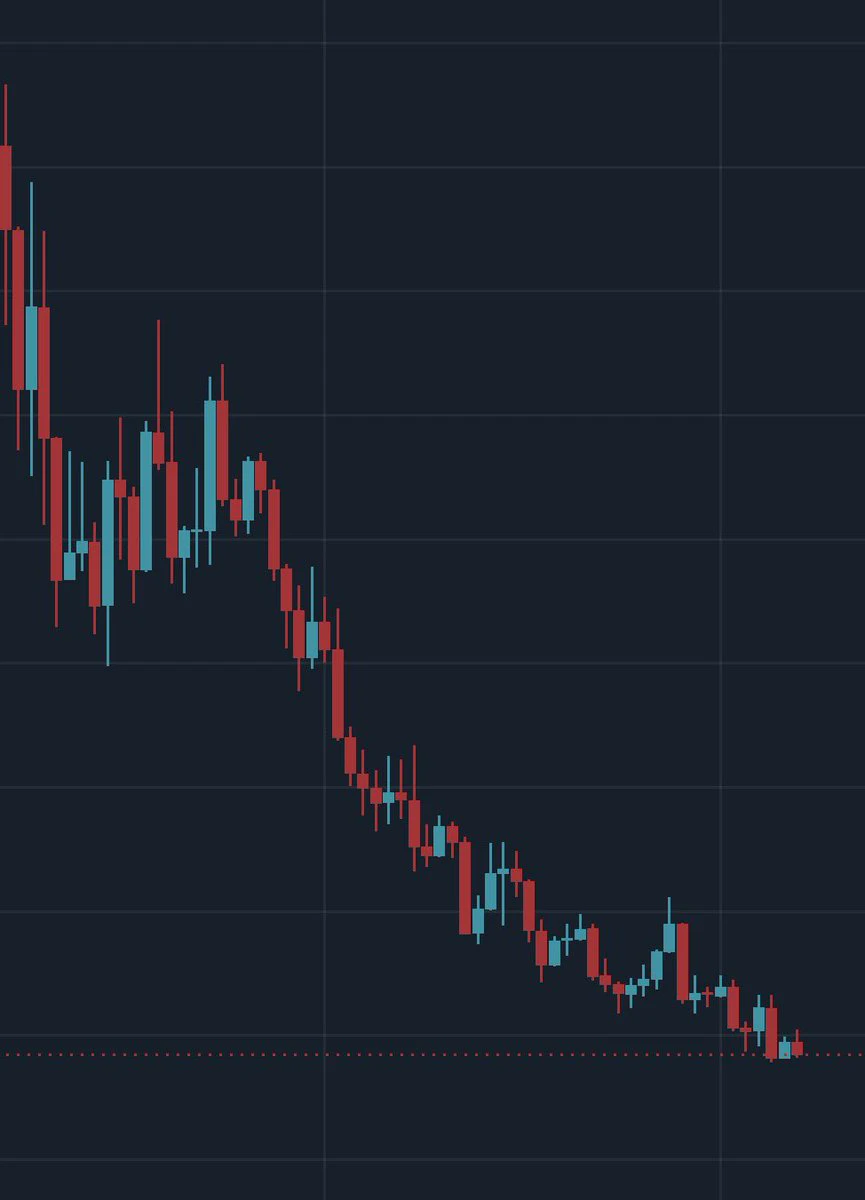
$ZEC Currently at 1260.59, 24H -5.00% (range: 1250.67–1364.08). 1H is weak, with an RSI of 23.48; price is below the EMA20 at 1288.01, and the volume ratio is 0.33. 4H is weak, with an RSI of 54.41; price is below the EMA20 at 1284.31, with support at 1159.00 and resistance at 1387.89. A sustained move above the 1364.08 resistance could indicate continuation; a break below the 1250.67 support would weaken the structure. On review, confirm whether price holds above 1364.08 and reclaims 1250.67; volume is only 0.33x. A hold without volume or failure to reclaim after a breakdown invalidates the s
post-image
ZEC+1.16%
Notice how Protestants have no issue calling each other brothers in Christ but condemn the apostolic Churches for referring to their priests as “Father” without understanding what Jesus meant
St-Paul told the Christians in Corinth the he was “their father in Christ” - 1 Cor 4:15
post-image
Trenches
ZIG
Z
bade
b
ZIG
0x8c...1145
Market Cap
$.
Change
.
24h Vol
$.
Holders
.
BTC
B
bade
b
BTC
C5xp...pump
Market Cap
$.
Change
.
24h Vol
$.
Holders
.
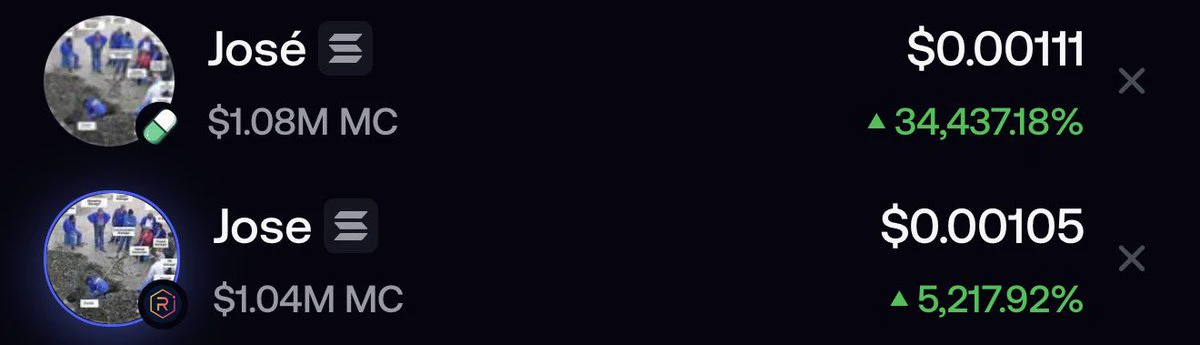
José
J
bade
b
José
87CQ...1UJT
Market Cap
$.
Change
.
24h Vol
$.
Holders
.
STONK
S
bade
b
STONK
6GmA...UNgx
Market Cap
$.
Change
.
24h Vol
$.
Holders
.
IDOL
I
bade
b
IDOL
0x3b...ab07
Market Cap
$.
Change
.
24h Vol
$.
Holders
.
XRP Technical Outlook: Ripple Breaks Lower as Selling Pressure Pushes Price Toward $1.00 Support

XRP is showing renewed bearish momentum on the daily chart after losing its recent consolidation structure. Price has dropped below all four major EMAs, while RSI is approaching oversold territory. The key question now is whether buyers can defend the current area or whether XRP will continue toward its previous major low near $0.99.

1. EMA Structure: Bearish Alignment

Current XRP price: $1.1623

- EMA 20: $1.2714
- EMA 50: $1.3188
- EMA 100: $1.3161
- EMA 200: $1.3580

XRP is trading below all
XRP-1.12%
  • 2
  • 1
$IDOL I went from being down 40% to recovering my losses this time, all because I didn’t cut my losses at 0.023. Let’s get straight to the point.
Up 36.55% in 24h, currently at 0.0348. It briefly hit 0.0456 before getting dumped back down. Trading volume came in at $400 million—that’s explosive for a small-cap coin. But note that the turnover rate is already absurdly high, which means tokens are changing hands on a massive scale, not that there’s one-way accumulation.
On fundamentals, I’ve looked through IDOL’s contracts. The token’s utility is focused on ecosystem governance and node staking,
IDOL-6.71%
Gm everyone ☀️
post-image
This trade on $ACT was profitable. Take the money and run. Another victory. Profit: $ 656 Today's highlights:
‍$XRP and $AKE .
post-image
ACT-1.19%
XRP-1.15%
AKE+6.07%
$STONK Watching the order book this time made it pretty obvious to me: three wallets sold off almost back-to-back within the same time window, dumping nearly $300,000 worth of tokens in a few minutes. The market cap fell from around $70 million to $60 million, a short-term drop of about 14%. A quick look at the on-chain records shows three sell orders of roughly $110,000, $100,000, and a little over $80,000, placed less than five minutes apart. The selling pace looks a lot like the same group of funds reducing their positions all at once. As someone who just got in, I’m baffled: are several wh
post-image
STONK+11.55%
BTC-0.67%
ETH-1.26%
Crypto Market update
live-cover
LIVE13
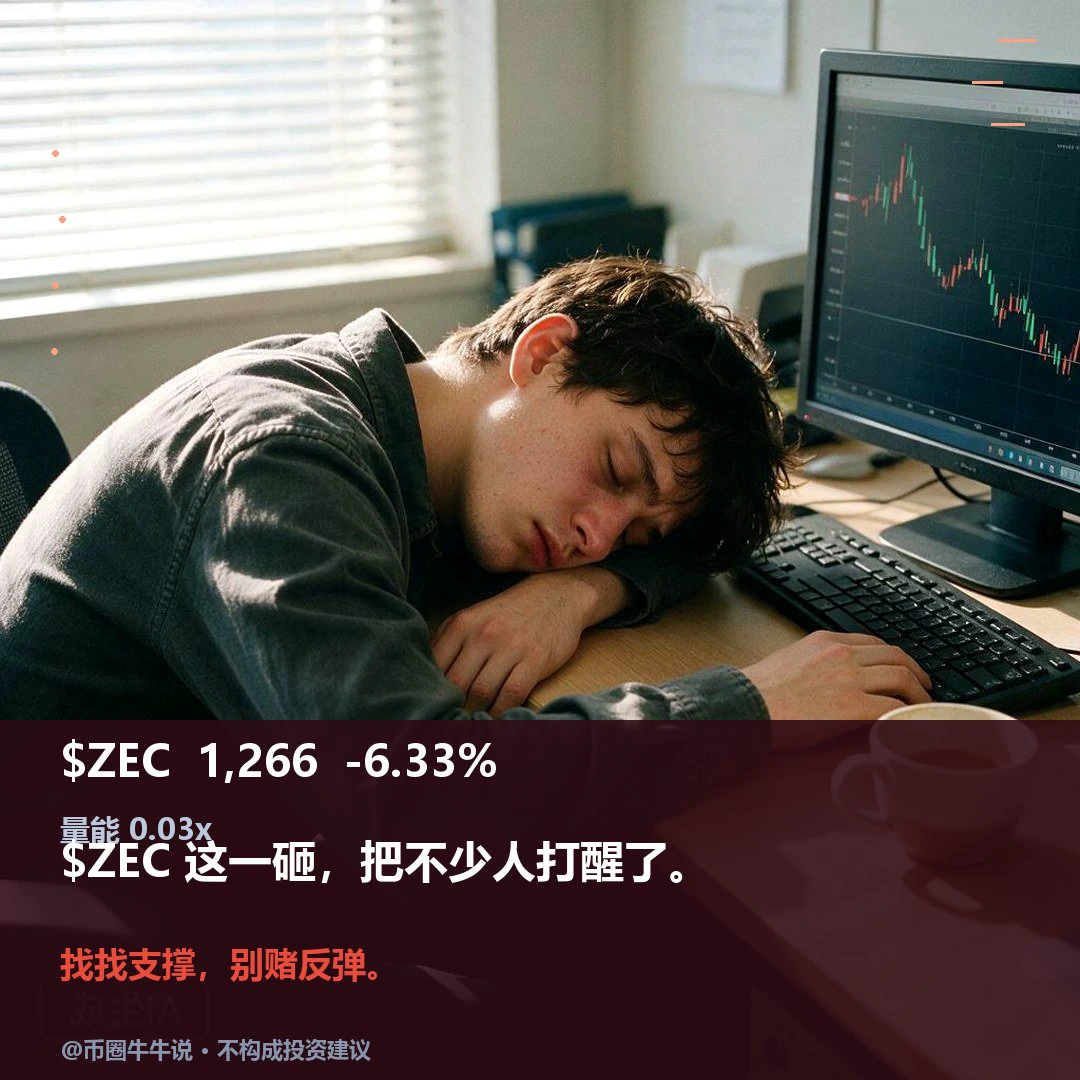
$ZEC Currently trading at 1265.91, down 6.33% over 24H (range: 1250.67–1364.08). The 1H trend is weak, with RSI at 24.79, price below the EMA20 at 1288.50, and a volume ratio of 0.03. The 4H trend is weak, with RSI at 55.38, price below the EMA20 at 1284.75, support at 1159.00, and resistance at 1387.89. A sustained move above resistance at 1364.08 could signal continuation; a break below support at 1250.67 would weaken the structure. Review whether 1364.08 holds and 1250.67 is reclaimed; volume is only 0.03x. A low-volume hold or a breakdown without a subsequent reclaim invalidates the setup.
post-image
ZEC+1.16%
seems like there’s a new contender
post-image
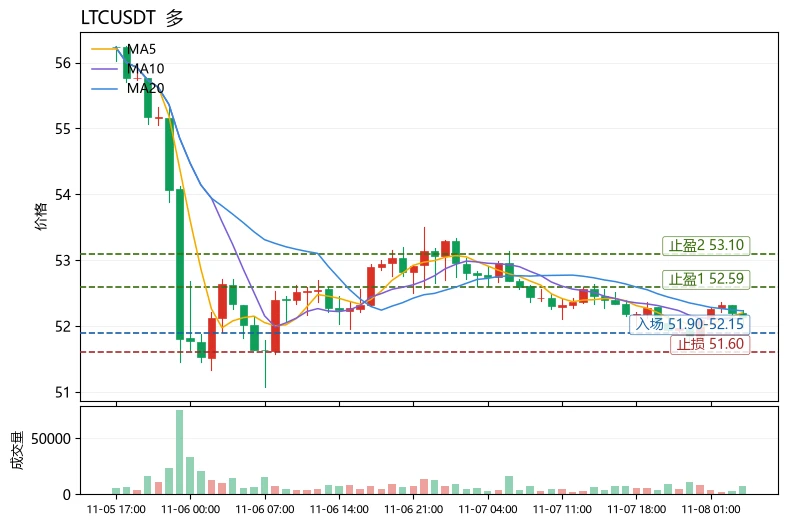
$LTC Current price: 52.14. The first resistance above is the Bollinger upper band at 52.59, and support below is the Bollinger lower band at 51.87. These two levels are where bulls and bears are currently locked in a short-term battle. Why give the price levels before explaining the logic? Because the first step in reading a chart is always to establish your bearings, not to predict.

Using LTC as an example, here's a reusable way to assess trend health: moving averages show direction, MACD shows momentum, and RSI shows positioning. A healthy trend requires all three to align. Currently, MA5=5
post-image
LTC-0.09%
PEPE+0.97%
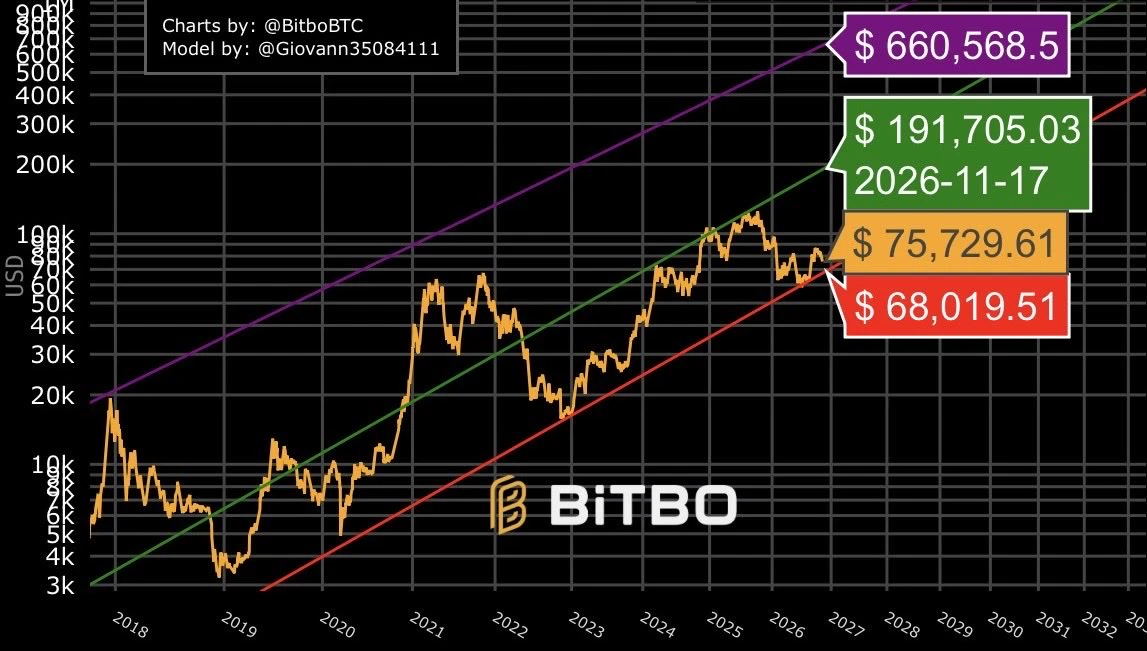
During the 2020-21 bull run bitcoin was trading significantly higher than fair value (green line) during a large portion of the cycle.
During the 2024-2025 bull run bitcoin barely even touched fair value and has been stuck between the support (red line) and fair value channel since 2022.
Today we’re sitting only 11% above support and a trip to resistance (purple line) would require a 771% price surge.
Bitcoin historically spends very little time near this red line and in the last 4 years has barely broken fair value.
No model is perfect but sentiment right now feels exactly the same as this
post-image
BTC-0.67%
$BTC 1st Short-Term Target Hit! 💥🎯
post-image
BTC-0.67%
$YB SHORTYB hasn't managed to defend its earlier price levels. Sellers still have an opportunity to push this market lower.entry: 0.05113tp1: 0.05021tp2: 0.04928stop: 0.05266
post-image
YB+2.91%
Guys, $ONE is moving exactly as I expected and successfully hit my take-profit level……‼️…… Now, I'm going to close my long position, wait for the next rejection, and then short……‼️
post-image
ONE-1.19%
Finally showing some real life, back above those moving averages. $SOXL is starting to look formidable again, making me wonder if we're really targeting recent highs or just teasing us. Take profit: 48.45 Stop loss: 44.72 Still active: $XRP : Current price 1.1621 - 24-hour change: -1.87%$IDOL : Current price 0.035111 - 24-hour change: +31.95%
post-image
SOXL-1.16%
XRP-1.15%
IDOL-6.71%
crypto market update 🥰
live-cover
LIVE45
Robinhood chain visualized
post-image
HOOD+4.25%
‍#每周来晒 #广场交易达人 #WCTCS9 #美股财报季
Can I nail the Nasdaq next week? — My U.S. stock trading plan

The Nasdaq bounced on Friday, likely a short-term rebound after Thursday’s oversold conditions. I’m still bearish on the market at the start of next week. First, from a technical perspective, it broke through the key support levels of 25,000 and 24,425, the late-July low, one after another this week. It had already broken below support on the weekly chart, so there’s little support to hold in the short term. Second, on the policy front, the panic caused by the Democrats sweeping both the House and Sen
post-image
AMD+11.55%
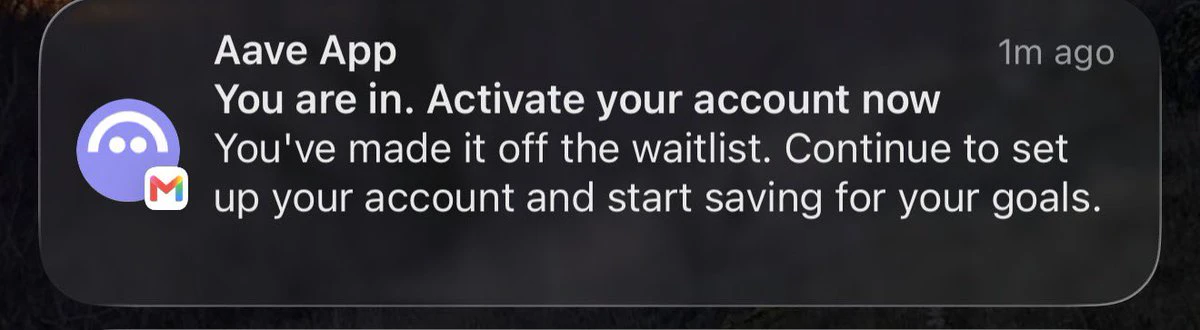
almost forgot I signed up for this, they put me on waitlist for 8 months
already found better alternatives too
how can they expect people to wait 8 months to use their app?
post-image
Load More

Join 40 M users in our growing community

⚡️ Join 40 M users in the crypto craze discussion

💬 Engage with your favorite top creators

👍 See what interests you

Trending Topics

USAIStocksHitHard

21.1k Views3.67k Discussing

U.S. stocks sold off sharply on Thursday, November 5 (UTC). The Nasdaq closed down around 5.5%, entering correction territory, while the Philadelphia Semiconductor Index plunged roughly 12%, with chip stocks including $NVDA and $AMD posting steep losses. Beyond profit-taking, investors are growing concerned about the pace of AI data center construction, capital spending, and future returns on investment. The key question now is whether the AI sector’s lofty growth expectations need to be repriced. Where do you think the next opportunities will emerge: chip stocks, tech giants, or other sectors?

USNonfarmPayrolls

34.41k Views4.34k Discussing

StakeOnLaunchpoolToShare450KVLX

9.9k Views828 Discussing

View More