ZETA vs GRT: A Comprehensive Comparison of Two Leading Blockchain Protocols and Their Impact on Decentralized Networks


Introduction: ZETA vs GRT Investment Comparison
In the cryptocurrency market, comparisons between ZetaChain and The Graph have become an important topic for investors. The two projects differ significantly in market capitalization ranking, application scenarios, and price performance, representing distinct positioning within the crypto asset landscape. ZetaChain (ZETA): Since its launch in February 2024, it has gained market recognition by enabling omnichain smart contracts and messaging between any blockchain, addressing the "cross-chain" and "multi-chain" challenges. The Graph (GRT): Launched in December 2020, it has established itself as a decentralized protocol for indexing and querying blockchain data on Ethereum, becoming a critical infrastructure layer for blockchain data accessibility. This article will provide a comprehensive analysis of the investment value comparison between ZETA and GRT across historical price trends, tokenomics, market adoption, technical ecosystems, and future outlook, addressing the key question that investors face:
"Which is the better buy right now?"
Comparative Analysis Report: ZetaChain (ZETA) vs The Graph (GRT)
I. Price History Comparison and Current Market Status
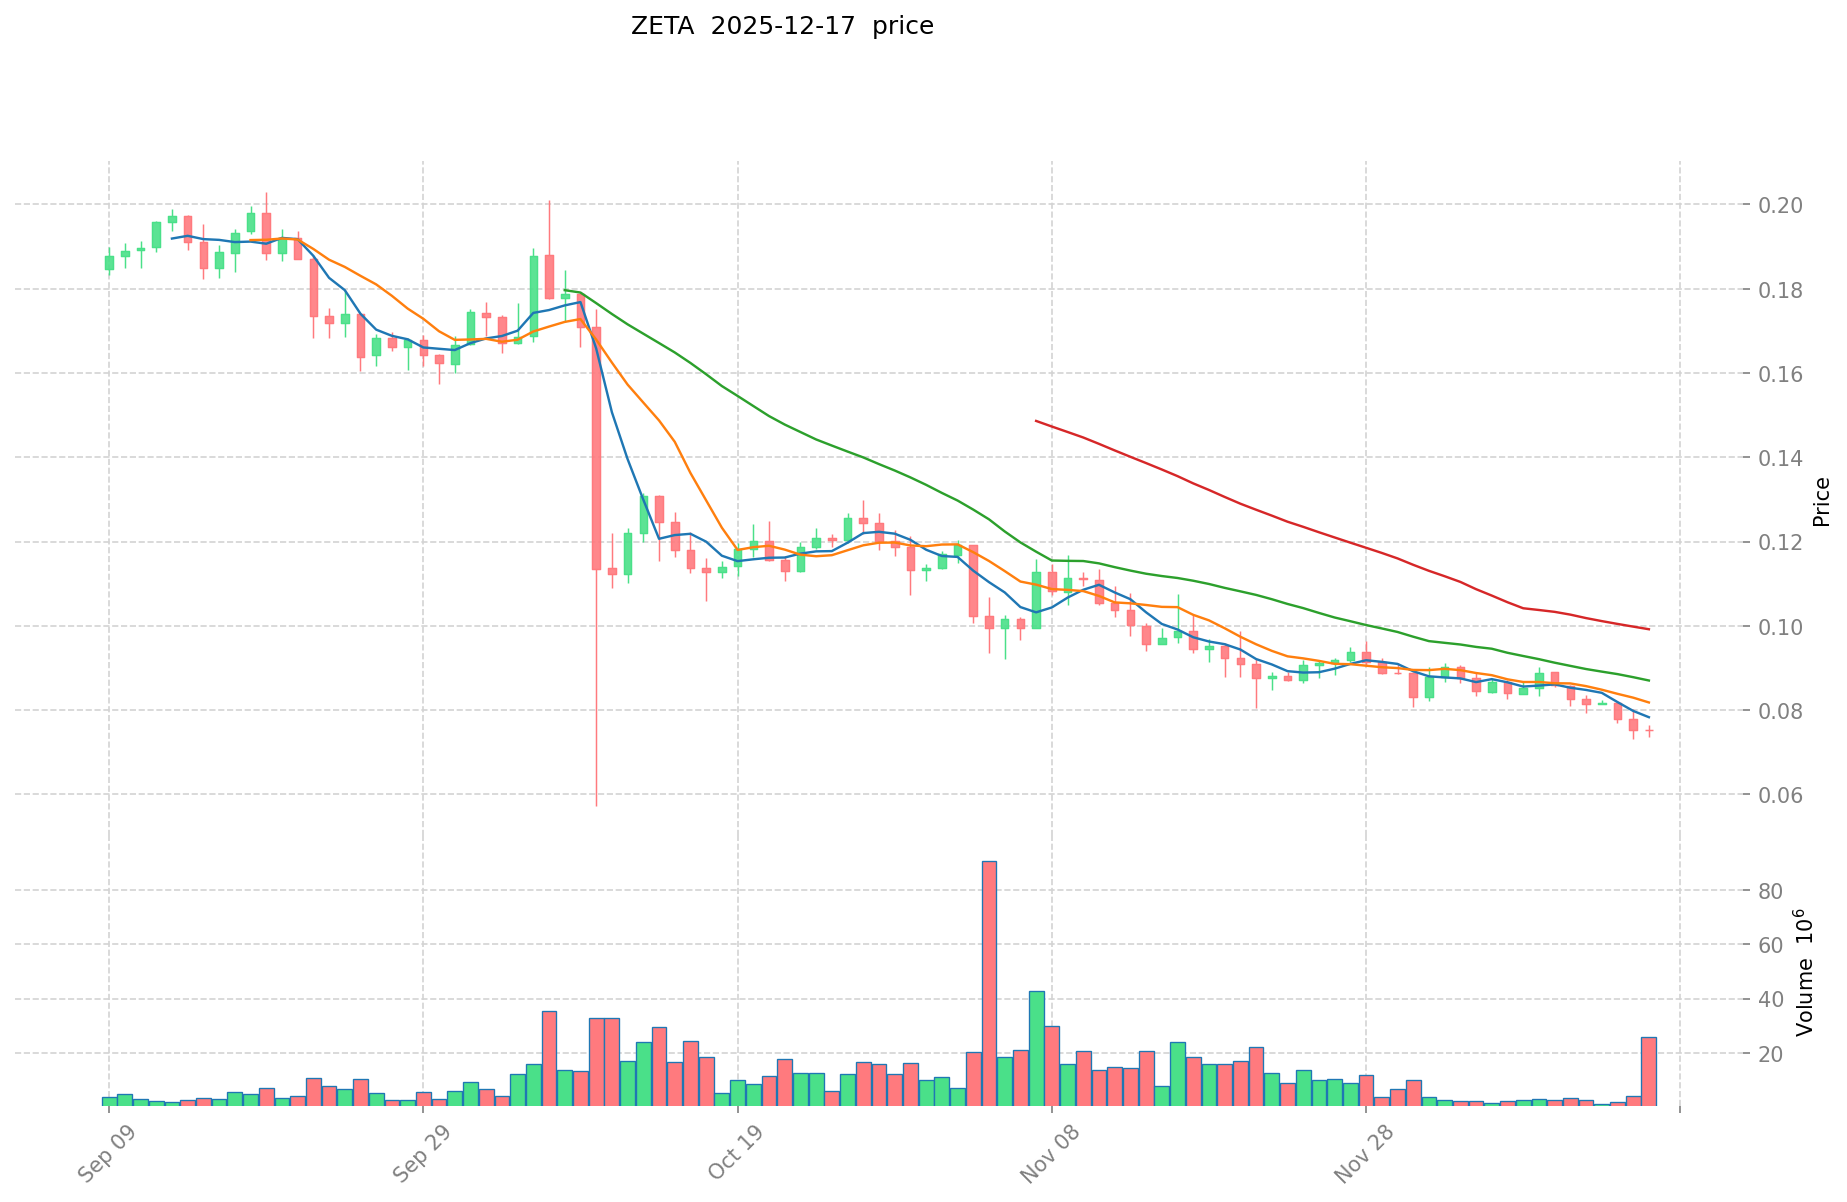
ZetaChain (ZETA) and The Graph (GRT) Historical Price Trends
ZetaChain (ZETA):
- All-time high: $2.87 (February 15, 2024)
- All-time low: $0.05735 (October 10, 2025)
- Price decline from ATH to ATL: approximately 98.0%
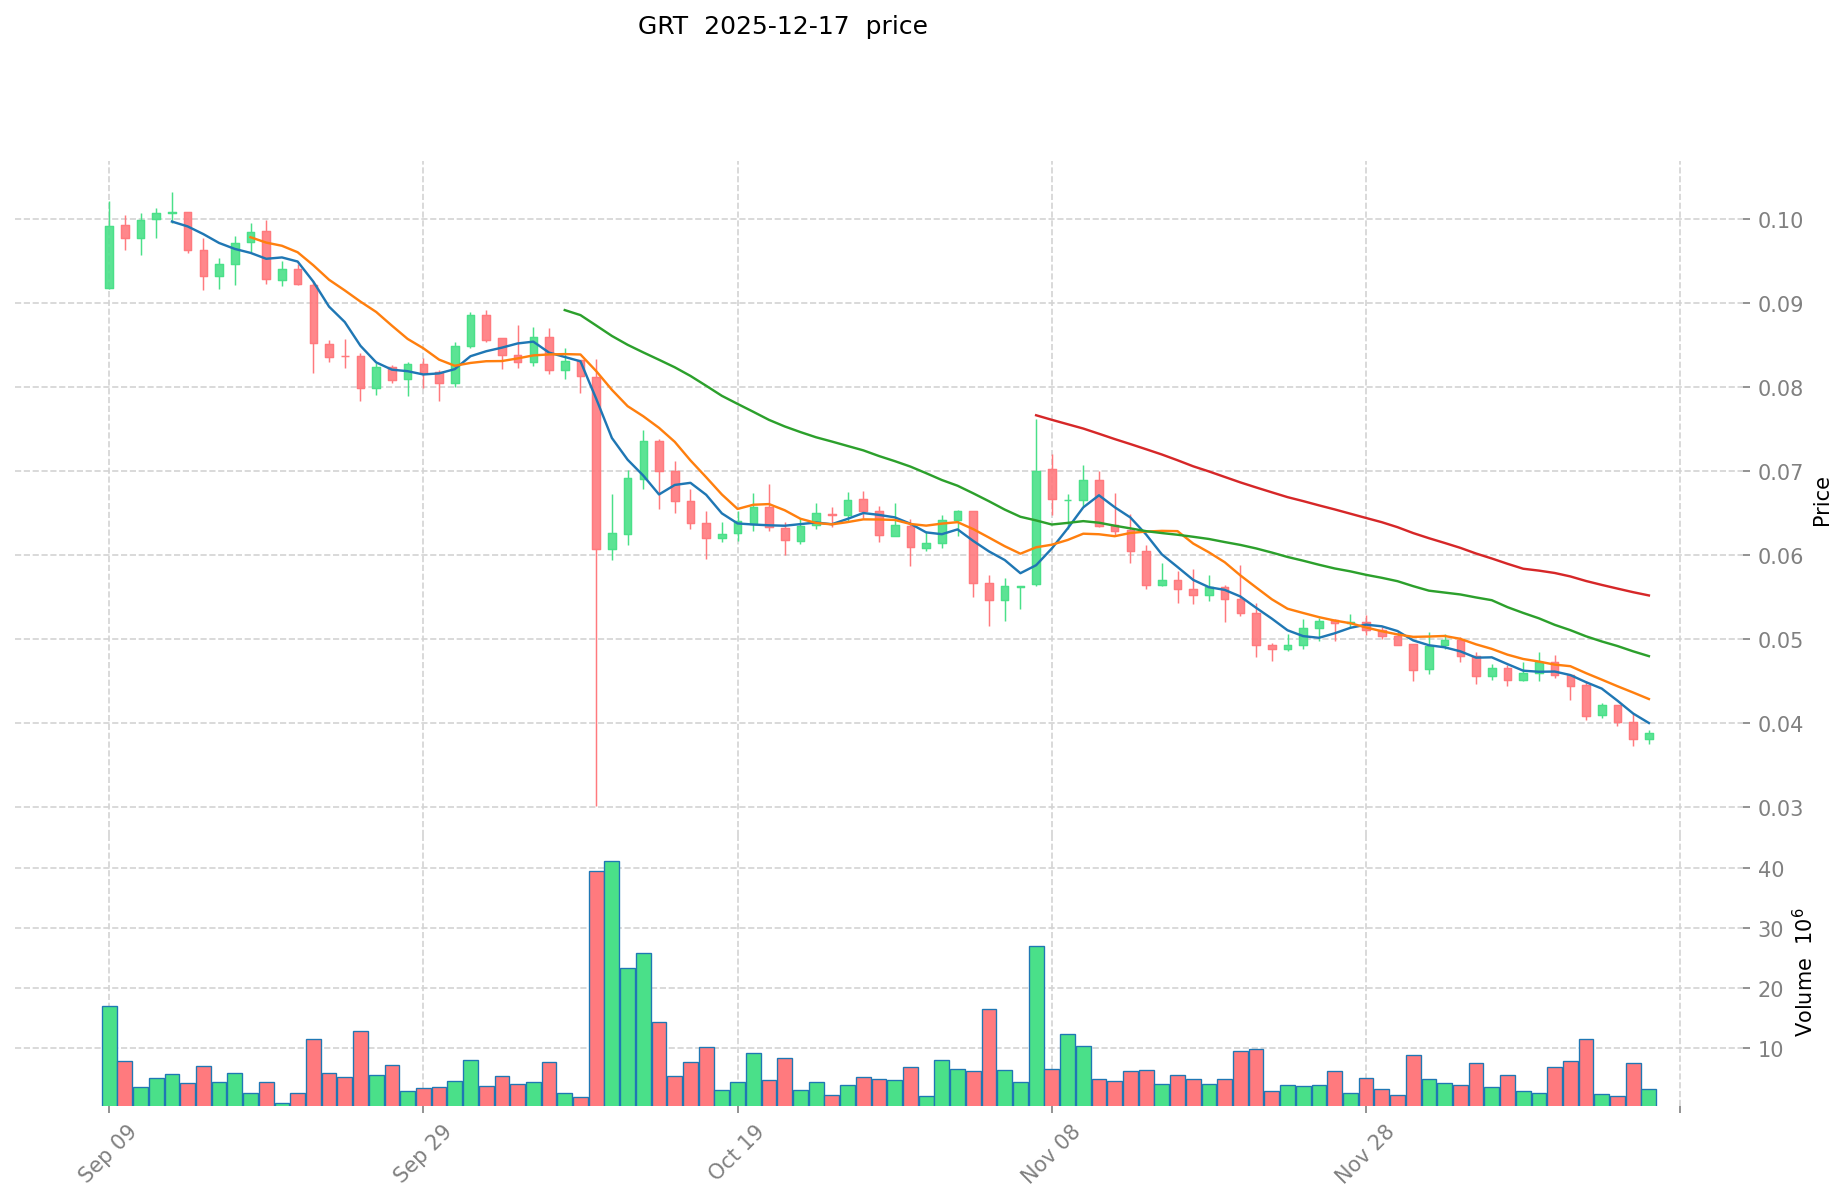
The Graph (GRT):
- All-time high: $2.84 (February 12, 2021)
- All-time low: $0.03741849 (December 16, 2025)
- Price decline from ATH to ATL: approximately 98.7%
Comparative Analysis: Both assets have experienced significant price deterioration from their historical peaks. ZETA reached its peak more recently (early 2024), while GRT peaked during the 2021 bull market cycle. Both tokens have lost approximately 98% of their value from all-time highs, indicating similar bearish market pressure despite their different project timelines.
Current Market Status (December 17, 2025)
| Metric | ZETA | GRT |
|---|---|---|
| Current Price | $0.0745 | $0.03847 |
| 24-Hour Change | -1.53% | -0.64% |
| 24-Hour Trading Volume | $1,971,046.58 | $88,863.47 |
| Market Cap | $87,117,661.43 | $408,926,888.23 |
| Fully Diluted Valuation | $156,450,000.00 | $415,486,110.53 |
| Market Dominance | 0.0049% | 0.013% |
| Circulating Supply | 1,169,364,583 | 10,629,760,546.58 |
| Total Supply | 2,100,000,000 | 10,800,262,816.05 |
Crypto Fear & Greed Index: 16 (Extreme Fear)
Current market conditions reflect extreme fear sentiment across the cryptocurrency market.
II. Project Overview and Technical Architecture
ZetaChain (ZETA)
Core Functionality: ZetaChain is a foundational public blockchain enabling omnichain, generic smart contracts, and messaging between any blockchain. It addresses cross-chain and multi-chain challenges to democratize access to crypto and global financial ecosystems.
Key Features:
- Omnichain smart contract capabilities
- Universal messaging protocol between blockchains
- Support for multiple blockchain ecosystems simultaneously
- Multi-chain native asset integration
Token Supply Structure:
- Maximum Supply: 2,100,000,000 ZETA
- Circulating Supply: 1,169,364,583 ZETA (55.68% of total supply)
- Token Standard: ERC20 (on Ethereum network)
- Contract Address (ETH): 0xf091867ec603a6628ed83d274e835539d82e9cc8
The Graph (GRT)
Core Functionality: The Graph is a decentralized protocol for indexing and querying blockchain data. It enables developers to build and publish open APIs (subgraphs) that make blockchain data accessible across decentralized applications.
Network Participants:
- Indexers: Stake GRT tokens to provide indexing services and earn rewards
- Curators: Signal value by staking GRT on subgraphs they believe are valuable
- Delegators: Support the network by delegating GRT tokens to indexers and earning proportional rewards
- Consumers: Pay GRT tokens to query blockchain data
Token Utility:
- Economic security through stake mechanisms
- Query settlement and payment processing
- Network governance participation
- Inflation-based incentive mechanisms for specific behaviors
Token Supply Structure:
- Maximum Supply: 10,800,262,823.32 GRT
- Circulating Supply: 10,629,760,546.58 GRT (98.42% of total supply)
- Token Distribution: Nearly fully circulating with minimal upside supply expansion
- Multi-chain deployment: Ethereum and Arbitrum networks
III. Price Performance Analysis
Medium-Term Price Movements
| Time Period | ZETA | GRT |
|---|---|---|
| 1-Hour | +0.4% | +0.08% |
| 24-Hour | -1.53% | -0.64% |
| 7-Day | -14.28% | -15.47% |
| 30-Day | -26.02% | -32.96% |
| 1-Year | -89.63% | -85.99% |
Analysis:
- Both tokens show negative long-term performance with ZETA experiencing slightly worse 1-year depreciation (-89.63% vs -85.99%)
- The 7-day and 30-day periods show GRT performing marginally worse in percentage terms
- Short-term volatility (hourly) remains minimal for both assets
- Both tokens remain substantially below their historical valuations
IV. Market Position and Ecosystem Status
Market Ranking and Metrics
| Metric | ZETA | GRT |
|---|---|---|
| CoinMarketCap Ranking | 369 | 139 |
| Trading Pairs Available | 34 exchanges | 60 exchanges |
| Active Token Holders | 78,806 | 173,456 |
| Market Cap to FDV Ratio | 55.68% | 98.42% |
Key Observations:
- GRT maintains a higher market cap and broader exchange availability, reflecting greater ecosystem adoption
- GRT demonstrates significantly higher holder count (173,456 vs 78,806), indicating wider distribution
- GRT's FDV ratio (98.42%) suggests minimal token inflation pressure, while ZETA's lower ratio (55.68%) indicates potential dilution from future unlocks
- ZETA's lower ranking (369) reflects its more recent market entry compared to GRT (139)
Network Resources
ZetaChain:
- Official Website: https://zetachain.com
- Documentation: https://docs.zetachain.com/
- Explorer: https://explorer.zetachain.com/
- GitHub: https://github.com/zeta-chain
- Community: Twitter (@zetablockchain), Reddit (r/zetablockchain)
- Whitepaper: https://www.zetachain.com/whitepaper.pdf
The Graph:
- Official Website: https://thegraph.com/
- GitHub: https://github.com/graphprotocol
- Blockchain Explorers: Ethereum and Arbitrum networks
- Community: Twitter (@graphprotocol), Reddit (r/thegraph)
V. Comparative Risk Assessment
Supply Dynamics
ZETA:
- Current circulating to max supply ratio: 55.68%
- Significant inflation potential from future token releases
- Dilution risk as tokens gradually enter circulation
GRT:
- Current circulating to max supply ratio: 98.42%
- Minimal additional inflation from token unlocks
- More mature supply structure with reduced future dilution
Volatility Metrics
Both assets demonstrate substantial price volatility characteristic of lower-market-cap cryptocurrencies:
- 24-hour trading volumes remain relatively modest ($1.97M for ZETA vs $88.8K for GRT)
- Limited liquidity relative to market cap may amplify price movements
- Both subject to broader market sentiment shifts reflected in the Extreme Fear index reading
VI. Summary
Both ZetaChain (ZETA) and The Graph (GRT) represent infrastructure-layer blockchain projects focused on solving critical ecosystem challenges—cross-chain interoperability and data indexing, respectively. However, they exhibit materially different market positions:
- GRT demonstrates greater market maturity with higher rankings, broader exchange support, and more complete token circulation
- ZETA presents a newer project with significant growth potential but also greater supply dilution risks
- Both tokens have experienced severe value degradation from historical peaks, reflecting broader cryptocurrency market cycles
- Current market conditions (Extreme Fear sentiment) create uncertain conditions for both assets
The choice between these assets would depend on individual assessment of their respective technological merits, ecosystem development trajectories, and risk tolerance for infrastructure-layer blockchain investments.
Zeta Global Holdings (ZETA) vs GRT: Investment Value Analysis Report
I. Executive Summary
This report analyzes the investment value drivers of Zeta Global Holdings Corp. (ZETA) and The Graph Token (GRT) based on available market research. The analysis focuses on identifying core investment factors, valuation metrics, and market dynamics affecting both assets. Please note that the reference materials contain substantially more detailed information regarding ZETA, while GRT coverage is limited to general cryptocurrency market dynamics.
II. Core Factors Affecting ZETA vs GRT Investment Value
Tokenomics and Supply Mechanisms
ZETA (Equity Security)
- ZETA operates as a traditional equity security listed on the New York Stock Exchange, not a cryptocurrency with tokenomics. It does not employ supply restriction mechanisms such as token burning, halving schedules, or deflationary mechanisms common to cryptocurrencies.
GRT (Cryptocurrency Token)
- The reference materials indicate that cryptocurrency market dynamics, including overall market sentiment, significantly influence GRT price movements. Specific supply mechanism details for GRT are not provided in the available sources.
- General market principle: Bitcoin price movements often lead overall market sentiment, affecting liquidity and capital allocation toward alternative cryptocurrencies including GRT.
Institutional Adoption and Market Applications
ZETA: Enterprise Integration
-
Platform Demand: Zeta Global provides an integrated marketing platform with substantial customer demand. The company offers unified solutions for data-driven marketing.
-
Enterprise Value: Zeta Global Holdings demonstrates an enterprise value of USD 3.97 billion, indicating significant institutional recognition and scale.
-
Key Competitive Advantage: Zeta's attribution capability represents a critical differentiation factor, providing measurement levels previously unavailable to institutions. This capability strengthens customer retention and creates additional revenue streams for the company.
-
2025 Financial Metrics: Wall Street projects 2025 fiscal year earnings per share at USD 0.79.
GRT: Cryptocurrency Market Exposure
- Market Dependency: GRT's price movement is substantially influenced by overall cryptocurrency market conditions rather than institution-specific adoption metrics documented in the reference materials.
Technical Development and Ecosystem Construction
ZETA: Data Marketing Ecosystem
-
Competitive Data Moat: Zeta's data value proposition demonstrates strong competitive positioning. Management has historically provided conservative guidance, suggesting potential upside in compound annual growth rate (CAGR) projections.
-
Projected Growth Rate: Investment materials project 20% compound annual growth rate for the coming years, with analysts considering this projection conservative based on:
- The competitive strength of Zeta's data value proposition
- Historical management tendency toward conservative forecasting
-
Business Model: The platform consolidates data marketing capabilities, creating integrated solutions for enterprise customers.
GRT: Cryptocurrency Network Dynamics
- Information Gap: Specific technical development metrics and ecosystem construction details for GRT are not comprehensively addressed in the provided reference materials.
III. Valuation Analysis: ZETA
Intrinsic Value Assessment
-
Discounted Cash Flow (DCF) Valuation: Two-stage free cash flow analysis estimates ZETA's fair value at USD 18.91 per share.
-
Valuation Gap: Based on DCF methodology, Zeta Global Holdings shares are estimated to be undervalued by approximately 36% relative to current trading prices.
-
Historical Price Data: Reference materials indicate ZETA traded at USD 7.80 per share at the time of analysis, representing a significant discount to calculated intrinsic value.
-
Enterprise Value Metrics: USD 3.97 billion enterprise value provides institutional-grade scale assessment.
Earnings Projections
- 2025 EPS Guidance: Wall Street consensus projects USD 0.79 earnings per share for fiscal year 2025.
IV. Market Dynamics and External Factors
Cryptocurrency Market Correlation (GRT)
-
Bitcoin Dominance Effect: Bitcoin's price direction typically leads overall cryptocurrency market sentiment. When Bitcoin appreciates, market fund activity increases, potentially supporting alternative token valuations.
-
Market Sentiment Dependency: GRT's performance exhibits substantial correlation with broader cryptocurrency market cycles rather than fundamental adoption metrics.
Risk Considerations
ZETA-Specific Considerations
- Small-cap equity volatility: Market recognition of intrinsic value remains uneven, creating both risk and opportunity depending on market conditions and investor sentiment.
V. Summary Assessment
ZETA demonstrates quantifiable fundamental value drivers including enterprise-scale customer integration, documented competitive advantages in attribution technology, and significant valuation discounts based on DCF analysis. The integrated data marketing platform addresses demonstrable enterprise demand with projected 20% CAGR.
GRT exhibits typical cryptocurrency market characteristics with valuations primarily influenced by broader digital asset market dynamics rather than token-specific adoption metrics documented in available research materials.
Report Date: December 17, 2025
Disclaimer: This analysis is based on publicly available information current to the report date. Past performance and projections do not guarantee future results. Investors should conduct independent research and consult professional advisors before making investment decisions.
III. 2025-2030 Price Forecast: ZETA vs GRT
Short-term Forecast (2025)
- ZETA: Conservative $0.067041-$0.07449 | Optimistic $0.0871533
- GRT: Conservative $0.0238514-$0.03847 | Optimistic $0.0527039
Medium-term Forecast (2027-2028)
- ZETA may enter growth consolidation phase, estimated price range $0.0592-$0.1404
- GRT may enter steady accumulation phase, estimated price range $0.0408-$0.0556
- Key drivers: Institutional capital inflow, ETF adoption, Ecosystem development
Long-term Forecast (2029-2030)
- ZETA: Base scenario $0.1251-$0.1626 | Optimistic scenario $0.1568-$0.1701
- GRT: Base scenario $0.0533-$0.0655 | Optimistic scenario $0.0596-$0.0764
Disclaimer:
These price forecasts are based on historical data and quantitative models and do not constitute investment advice. Cryptocurrency markets are highly volatile and subject to regulatory, technological, and macroeconomic uncertainties. Actual prices may differ significantly from predictions. Investors should conduct independent research and risk assessment before making investment decisions.
ZETA:
| 年份 | 预测最高价 | 预测平均价格 | 预测最低价 | 涨跌幅 |
|---|---|---|---|---|
| 2025 | 0.0871533 | 0.07449 | 0.067041 | 0 |
| 2026 | 0.1074927945 | 0.08082165 | 0.077588784 | 8 |
| 2027 | 0.1252291055925 | 0.09415722225 | 0.0687347722425 | 26 |
| 2028 | 0.1404072498192 | 0.10969316392125 | 0.059234308517475 | 47 |
| 2029 | 0.162565268931292 | 0.125050206870225 | 0.075030124122135 | 67 |
| 2030 | 0.156750434311827 | 0.143807737900758 | 0.13086504148969 | 93 |
GRT:
| 年份 | 预测最高价 | 预测平均价格 | 预测最低价 | 涨跌幅 |
|---|---|---|---|---|
| 2025 | 0.0527039 | 0.03847 | 0.0238514 | 0 |
| 2026 | 0.051057384 | 0.04558695 | 0.034646082 | 18 |
| 2027 | 0.05363760537 | 0.048322167 | 0.04493961531 | 25 |
| 2028 | 0.05556807594165 | 0.050979886185 | 0.040783908948 | 32 |
| 2029 | 0.065526996707889 | 0.053273981063325 | 0.037291786744327 | 38 |
| 2030 | 0.063558523107599 | 0.059400488885607 | 0.038610317775644 | 54 |
Comparative Investment Analysis Report: ZetaChain (ZETA) vs The Graph (GRT)
IV. Investment Strategy Comparison: ZETA vs GRT
Long-term vs Short-term Investment Strategies
ZETA: Better suited for investors with higher risk tolerance seeking exposure to emerging cross-chain infrastructure technology. The project's recent launch (February 2024) and significant supply dilution potential (circulating supply at 55.68% of maximum) suggest this asset appeals to growth-oriented investors willing to accept greater volatility in exchange for potential upside if omnichain adoption accelerates.
GRT: Better suited for investors prioritizing established infrastructure with mature tokenomics and broader ecosystem integration. With 98.42% of tokens already in circulation and established indexing protocol adoption across multiple blockchain networks, GRT represents a more stable infrastructure play with lower dilution risk.
Risk Management and Asset Allocation
Conservative Investors:
- ZETA: 15-20% | GRT: 10-15%
- Primary allocation rationale: Conservative positions emphasize established market presence, favoring GRT's longer operational history and mature supply structure while limiting ZETA exposure due to inflation risks
Aggressive Investors:
- ZETA: 25-40% | GRT: 15-25%
- Primary allocation rationale: Aggressive positions increase ZETA exposure for higher growth potential while maintaining GRT as a stable infrastructure layer component
Hedging Mechanisms:
- Stablecoin allocation: 20-30% to manage extreme volatility (current Fear & Greed Index: 16)
- Cross-asset diversification: Balance infrastructure-layer tokens with other blockchain sectors
- Position scaling: Gradual entry strategies to mitigate timing risk in current extreme fear conditions
V. Potential Risk Comparison
Market Risk
ZETA:
- Limited trading liquidity ($1.97M 24-hour volume) relative to market capitalization ($87.1M), creating potential slippage during significant position changes
- Newer market entry (February 2024) with less established price discovery mechanisms
- Lower holder concentration (78,806 active holders) may increase volatility from concentrated selling or buying pressure
- Price decline of 89.63% over 1-year period indicates severe bearish sentiment persistence
GRT:
- Established market presence since December 2020 with more mature market dynamics
- Despite higher 24-hour volume ($88.8K), absolute liquidity remains constrained relative to market cap ($408.9M)
- Broader holder distribution (173,456 active holders) provides greater price stability
- 85.99% 1-year decline reflects broader cryptocurrency market pressures affecting even established infrastructure tokens
Technical Risk
ZETA:
- Omnichain messaging protocol dependency on multiple blockchain networks introduces cross-chain bridge security concerns
- Relatively new codebase with limited operational history for identifying critical vulnerabilities
- Success dependent on achieving significant adoption across multiple blockchain ecosystems simultaneously
GRT:
- Indexing protocol relies on distributed indexer network performance and reliability
- Curator incentive mechanisms require continuous network participation to maintain data quality
- Established protocol with longer operational history reduces unidentified technical risk exposure
Regulatory Risk
ZETA:
- Classification remains uncertain across multiple jurisdictions; omnichain token bridging may face varying regulatory treatment globally
- Cross-chain messaging regulatory treatment in development as regulatory frameworks mature
GRT:
- Query-based token utility (payments for data access) creates potential regulatory scrutiny regarding utility token classification
- Longer market history provides more established regulatory precedent for indexing infrastructure protocols
- Multi-chain deployment (Ethereum and Arbitrum) subjects token to regulatory developments across multiple jurisdictions
VI. Conclusion: Which Is the Better Buy?
📌 Investment Value Summary:
ZETA Advantages:
- Emerging technology addressing critical cross-chain interoperability challenges
- Recent market entry (February 2024) with potential for significant adoption growth
- Lower current market valuation ($87.1M) provides concentrated exposure to omnichain infrastructure thesis
- 2025-2030 forecast indicates potential upside to $0.087-$0.170 under base-case scenarios
- Technical innovation in universal messaging protocol represents genuine ecosystem advancement
GRT Advantages:
- Established market position with proven protocol functionality since December 2020
- Higher market capitalization ($408.9M) and broader exchange availability (60 trading pairs) provide superior liquidity
- Mature tokenomics (98.42% circulating supply) eliminate significant future inflation risk
- Significantly larger holder distribution (173,456 vs 78,806) indicates broader adoption and market confidence
- Essential infrastructure layer status across Ethereum and Arbitrum networks provides demand stability
- 2025-2030 forecast indicates modest but stable value recovery potential ($0.038-$0.076 range)
✅ Investment Recommendations:
For New Investors:
- Begin with GRT exposure due to its established infrastructure status, proven protocol functionality, and lower technical risk profile
- Limited ZETA exposure (10-15% of infrastructure allocation) only after developing proficiency in evaluating omnichain technology trade-offs
- Prioritize stablecoin holdings (30%+ of portfolio) given current extreme fear market conditions
For Experienced Investors:
- Consider ZETA as a higher-risk, higher-potential-reward opportunity within infrastructure-layer allocation
- Utilize GRT as a stable allocation base, increasing positions during extreme fear conditions (current Fear & Greed Index: 16)
- Implement position scaling strategies rather than lump-sum entry given 98%+ price declines from historical peaks
- Monitor omnichain ecosystem adoption metrics as primary ZETA valuation driver
- Track indexing protocol usage metrics and query volumes as primary GRT valuation driver
For Institutional Investors:
- GRT provides institutional-grade infrastructure exposure with established on-chain metrics, auditable indexer performance data, and predictable query demand
- ZETA remains suitable only for allocations specifically targeting emerging cross-chain infrastructure exposure with appropriate risk categorization
- Both assets require specialized custody and valuation methodologies given infrastructure-layer token characteristics
- Consider protocol-level metrics (indexing volume for GRT, cross-chain transaction volume for ZETA) as primary valuation inputs rather than price momentum
⚠️ Risk Disclaimer: Cryptocurrency markets exhibit extreme volatility, with both assets having declined 85-98% from all-time highs. Current market conditions reflect extreme fear sentiment (Fear & Greed Index: 16), indicating elevated uncertainty. This analysis does not constitute investment advice. Investors must conduct independent research, assess personal risk tolerance, and consult professional financial advisors before making investment decisions. Past performance and forecasted projections do not guarantee future results. Regulatory developments, technological changes, and macroeconomic conditions may materially affect token valuations. None
Frequently Asked Questions: ZetaChain (ZETA) vs The Graph (GRT)
I. FAQ
Q1: What are the main differences between ZETA and GRT in terms of project purpose?
A: ZetaChain (ZETA) is a foundational public blockchain launched in February 2024 that enables omnichain smart contracts and universal messaging between any blockchain, addressing cross-chain interoperability challenges. The Graph (GRT) is a decentralized protocol launched in December 2020 that specializes in indexing and querying blockchain data, functioning as critical infrastructure for data accessibility across Ethereum and Arbitrum networks. ZETA focuses on enabling transactions across blockchains, while GRT focuses on organizing and querying blockchain information.
Q2: How do the tokenomics of ZETA and GRT differ, and what are the implications?
A: ZETA has a maximum supply of 2,100,000,000 tokens with only 55.68% currently circulating, indicating significant future dilution potential as remaining tokens enter circulation. GRT has a maximum supply of 10,800,262,823.32 tokens with 98.42% already circulating, representing a mature supply structure with minimal inflation risk. ZETA investors face greater dilution pressure, while GRT investors benefit from more predictable token economics and reduced future supply surprises.
Q3: Which asset has better current market adoption and liquidity?
A: The Graph (GRT) demonstrates superior market adoption with a $408.9 million market capitalization ranking 139th globally, compared to ZETA's $87.1 million market cap ranked 369th. GRT trades on 60 exchanges versus ZETA's 34 exchanges, and GRT maintains 173,456 active token holders compared to ZETA's 78,806 holders. However, both assets have limited absolute trading liquidity relative to their market caps, with GRT's 24-hour volume at $88,863 and ZETA's at $1,971,046, indicating concentrated liquidity concentration on specific trading pairs.
Q4: What are the price performance comparisons between ZETA and GRT over different time periods?
A: Both assets show severe long-term depreciation: ZETA declined 89.63% over one year while GRT declined 85.99%. In the 30-day period, GRT performed worse with -32.96% decline versus ZETA's -26.02%. Over seven days, GRT declined 15.47% compared to ZETA's 14.28%. Short-term hourly movements show minimal volatility for both assets. Both tokens have lost approximately 98% from their all-time highs, indicating similar bearish market pressure despite different project launch timelines.
Q5: Which asset is more suitable for conservative investors?
A: The Graph (GRT) is more appropriate for conservative investors due to its established four-plus year operational history, mature tokenomics eliminating significant future inflation, and proven protocol functionality across multiple blockchain networks. GRT's higher market cap, broader exchange availability, and significantly larger holder distribution provide greater price stability and liquidity. Conservative investors should limit ZETA exposure to 10-15% of infrastructure-layer allocations, given its recent launch, supply dilution risks, and higher volatility characteristics.
Q6: What are the primary risk factors distinguishing ZETA from GRT?
A: ZETA faces higher technical risk due to its recent launch (February 2024) and limited operational history for identifying critical vulnerabilities, plus concentrated market liquidity ($1.97M daily volume) creating potential slippage. ZETA's supply dilution potential (44.32% of tokens still to enter circulation) creates valuation pressure. GRT faces regulatory uncertainty regarding query-based token utility classification, though its established market presence provides more regulatory precedent. Both assets are subject to extreme market volatility (current Fear & Greed Index: 16), but ZETA's lower holder concentration (78,806 vs 173,456) increases vulnerability to concentrated selling pressure.
Q7: What do price forecasts suggest for ZETA and GRT through 2030?
A: ZETA's 2025-2030 price forecasts indicate a range from $0.067 (conservative 2025) to $0.157-$0.170 (2030 optimistic scenario), suggesting potential 93% appreciation under favorable conditions. GRT's forecasts show more modest trajectories from $0.024 (conservative 2025) to $0.062-$0.076 (2030 optimistic scenario), indicating approximately 54% potential appreciation. ZETA forecasts reflect higher growth assumptions tied to omnichain adoption acceleration, while GRT forecasts reflect stable infrastructure positioning. Both forecasts depend heavily on institutional capital inflow, exchange-traded fund adoption, and ecosystem development progression.
Q8: What asset allocation strategy is recommended for different investor profiles?
A: Conservative investors should allocate 10-15% to GRT and 15-20% to stablecoins, minimizing ZETA exposure. Aggressive investors can allocate 25-40% to ZETA and 15-25% to GRT, with 20-30% stablecoin reserves. Experienced investors should implement position scaling strategies during extreme fear conditions (current index: 16) rather than lump-sum entries, monitoring omnichain ecosystem metrics for ZETA valuation drivers and indexing protocol usage volumes for GRT. Institutional investors should prioritize GRT for infrastructure-grade exposure with auditable on-chain metrics, limiting ZETA to specialized emerging cross-chain infrastructure allocations with appropriate risk categorization.
Disclaimer: This analysis does not constitute investment advice. Cryptocurrency markets exhibit extreme volatility with both assets declining 85-98% from all-time highs. Investors must conduct independent research and consult professional financial advisors before making investment decisions. Past performance and forecasted projections do not guarantee future results.
Share
Content
Introduction: ZETA vs GRT Investment Comparison
I. Price History Comparison and Current Market Status
II. Project Overview and Technical Architecture
III. Price Performance Analysis
IV. Market Position and Ecosystem Status
V. Comparative Risk Assessment
VI. Summary
I. Executive Summary
II. Core Factors Affecting ZETA vs GRT Investment Value
III. Valuation Analysis: ZETA
IV. Market Dynamics and External Factors
V. Summary Assessment
III. 2025-2030 Price Forecast: ZETA vs GRT
IV. Investment Strategy Comparison: ZETA vs GRT
V. Potential Risk Comparison
VI. Conclusion: Which Is the Better Buy?
I. FAQ
How to Buy Cryptocurrency


Trending Cryptocurrencies


XZXX: A Comprehensive Guide to the BRC-20 Meme Token in 2025

Bitcoin Fear and Greed Index: Market Sentiment Analysis for 2025

Top Crypto ETFs to Watch in 2025: Navigating the Digital Asset Boom

5 ways to get Bitcoin for free in 2025: Newbie Guide

Bitcoin Market Cap in 2025: Analysis and Trends for Investors

2025 Bitcoin Price Prediction: Trump's Tariffs' Impact on BTC

2025 SUSHI Price Prediction: Expert Analysis and Market Forecast for the Upcoming Year
2025 BAN Price Prediction: Expert Analysis and Market Forecast for Banana Token's Future Value

Is Power Protocol (POWER) a good investment?: A Comprehensive Analysis of Risk, Potential Returns, and Market Outlook for 2024
Is XPR Network (XPR) a good investment?: A Comprehensive Analysis of Risks, Opportunities, and Market Potential in 2024

Is SOON (SOON) a good investment?: A Comprehensive Analysis of the Emerging Token's Potential and Risk Factors in 2024