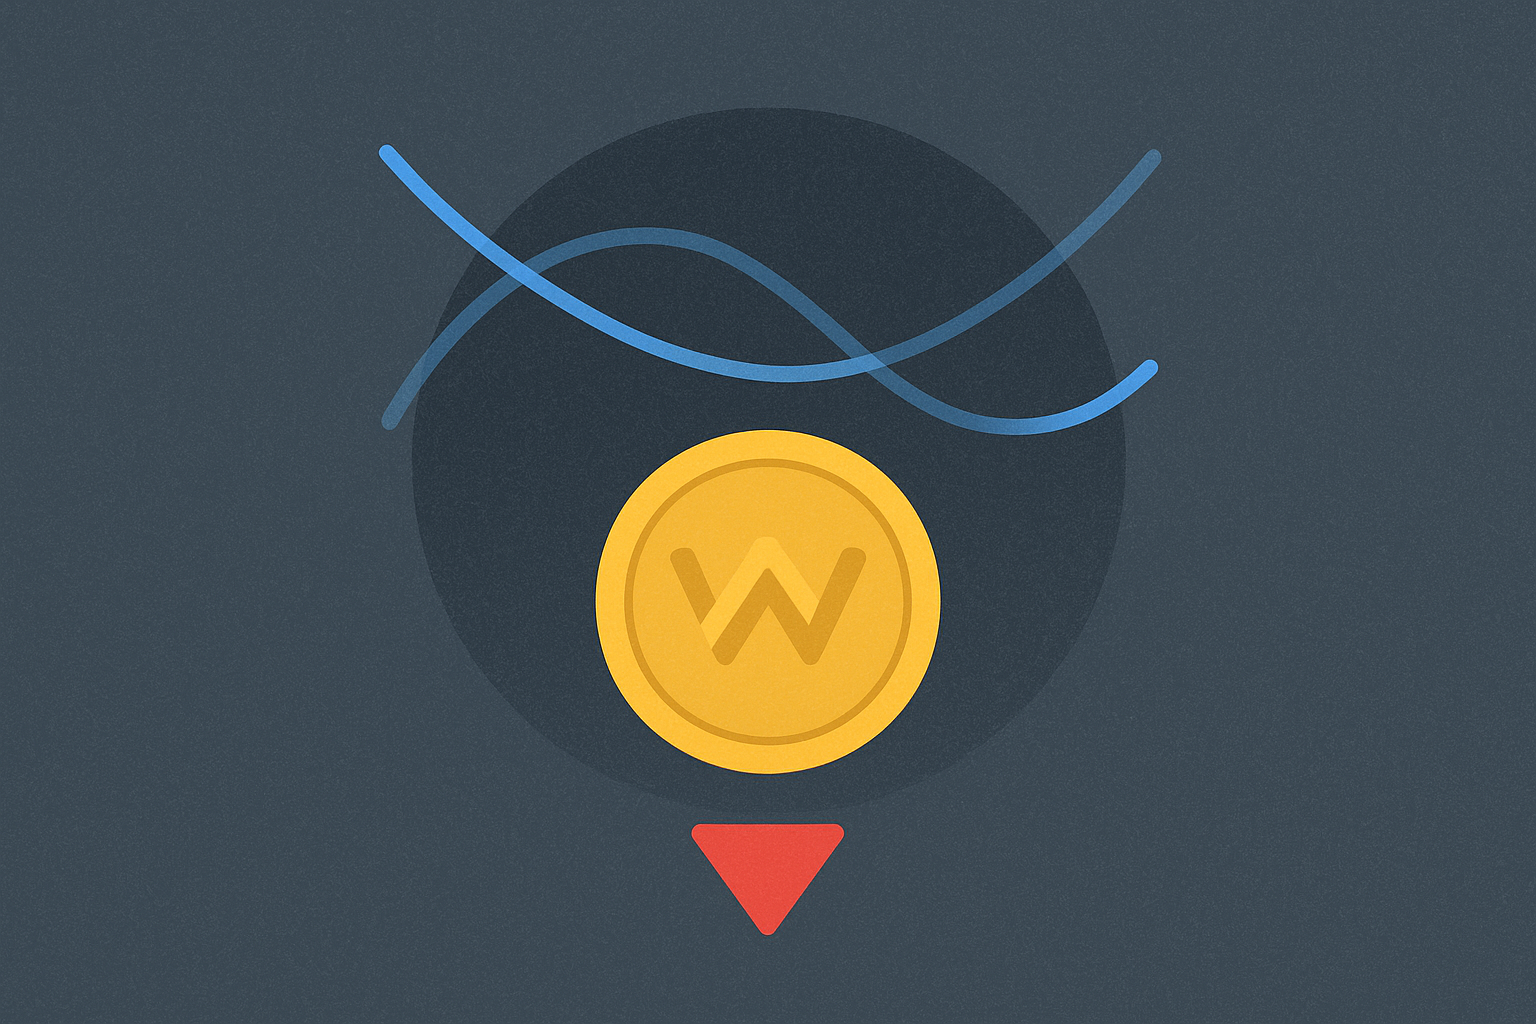
How to Interpret Key Technical Indicators for Cryptocurrency Trading?

Understanding MACD, RSI, KDJ, and Bollinger Bands for crypto trading
Technical indicators serve as essential tools for cryptocurrency traders seeking to identify market trends and optimize entry and exit points. The MACD indicator measures momentum by analyzing the relationship between two exponential moving averages, helping traders recognize bullish and bearish crossovers. RSI functions as an oscillator ranging from 0 to 100, with readings above 70 indicating overbought conditions and below 30 suggesting oversold opportunities.
The KDJ indicator, similar to the Stochastic Oscillator, compares closing prices to price ranges over specific periods, offering early signals for potential reversals. Bollinger Bands comprise three lines derived from standard deviation calculations, creating dynamic support and resistance levels that adapt to market volatility. When price touches the upper band, it may signal overbought conditions, while lower band touches can indicate oversold situations.
Effective traders combine these indicators rather than relying on single metrics. For instance, confirming MACD crossovers with RSI divergences significantly improves accuracy. During high volatility periods, as observed in major cryptocurrency markets with volume exceeding $70 million daily, Bollinger Bands become particularly valuable for identifying potential breakout opportunities. This multi-indicator approach reduces false signals and enhances decision-making quality in volatile crypto markets.
Interpreting moving average crossovers in cryptocurrency markets
Moving average crossovers represent a fundamental technical analysis tool that traders utilize to identify potential trend reversals and momentum shifts in cryptocurrency markets. When a shorter-term moving average crosses above a longer-term moving average, known as a "golden cross," it typically signals bullish momentum and potential entry opportunities. Conversely, a "death cross" occurs when the shorter-term average dips below the longer-term average, suggesting bearish sentiment.
The effectiveness of moving average crossovers varies significantly across different cryptocurrencies and market conditions. For instance, tokens operating on established platforms like Polygon demonstrate distinct crossover patterns influenced by network activity and ecosystem developments. When analyzing Origin (LGNS), trading at $8.89 with a 24-hour volume of $73.19 million, traders observe how crossover signals align with broader market sentiment. The token's 4.48% daily increase and negative 30-day performance of -25.11% illustrate how crossover indicators must be interpreted within larger market cycles.
Successful traders recognize that moving average crossovers function most effectively when combined with volume confirmation and support resistance levels. A crossover accompanied by increased trading volume provides stronger validation than signals occurring during low-volume periods. This multi-factor approach prevents false signals that commonly occur during sideways markets, enabling more precise decision-making in volatile cryptocurrency trading environments.
Analyzing volume and price divergence in digital asset trading
Volume and price divergence represents a critical analytical framework in digital asset trading, revealing the relationship between trading intensity and asset valuation movements. Origin (LGNS), a Polygon-based token launched in August 2023, exemplifies this dynamic effectively. The token demonstrates significant trading activity with $73.19 million in 24-hour volume, yet exhibits notable price fluctuations that warrant deeper examination.
| Metric | 24-Hour Change | 7-Day Change | 30-Day Change |
|---|---|---|---|
| Price Movement | +4.48% | -10.61% | -25.11% |
| Volume Traded | $73.19M | - | - |
| Current Price | $8.89 | - | - |
This divergence pattern suggests that elevated volume doesn't necessarily correlate with sustained price appreciation. Origin's 24-hour volume surge of 53.49% accompanied only modest price gains, indicating profit-taking behavior among traders. Meanwhile, the token's negative monthly performance of -25.11% despite consistent market participation demonstrates how volume can mask underlying selling pressure.
Such divergences occur when institutional and retail participants hold conflicting market perspectives. High volume combined with declining prices typically signals capitulation, whereas volume increases with rising prices indicate accumulation phases. For traders analyzing Origin or similar assets, monitoring these divergences provides early warning signals about potential trend reversals before they materialize in price action.
FAQ
What is an LGNS token?
LGNS token is a digital asset in the Web3 ecosystem, designed for decentralized applications and transactions on the LGNS blockchain network.
Is it safe to invest in LGNS coins?
Yes, LGNS coins are considered a safe investment in the Web3 space. With strong market performance and growing adoption, LGNS has proven to be a reliable digital asset for investors seeking stability and growth potential in the cryptocurrency market.
What is the price of 1 LGNS coin?
As of November 30, 2025, 1 LGNS coin is trading at $2.75. The price has shown steady growth over the past year, reflecting increased adoption and market confidence in the project.
Is LGNS listed on Binance?
No, LGNS is not currently listed on Binance. It is available on other major cryptocurrency exchanges.
Share
Content
How to Buy Cryptocurrency


Trending Cryptocurrencies


How to Use MACD, RSI, and Moving Averages for Effective LINK Technical Analysis?

How Does CUDIS Token Flow Between Exchanges Affect Its Price?

How to Use MACD, RSI, and KDJ Indicators to Predict DOT Price Movements?

Optimizing High Frequency Trading Tactics
How Does the MACD Indicator Signal a Bearish Trend for WEMIX/USD in 2025?

How to Interpret PHB Technical Indicators for Trading Signals in 2026?

Understanding Soulbound Tokens: A New Frontier in NFTs

Understanding Tendermint's Consensus Mechanism in Blockchain Technology

How to Purchase and Manage Ethereum Name Service Domains

Key Features of the Upcoming Unique NFT Project

A Comprehensive Overview of New NFT Projects Set to Launch in 2024